25 May 2018
Market snapshot
Equities - India
Close
Chg .%
Sensex
34,663
0.9
Nifty-50
10,514
0.8
Nifty-M 100
18,428
-0.4
Equities-Global
Close
Chg .%
S&P 500
2,728
-0.2
Nasdaq
7,424
0.0
FTSE 100
7,717
-0.9
DAX
12,855
-0.9
Hang Seng
12,153
0.5
Nikkei 225
22,437
-1.1
Commodities
Close
Chg .%
Brent (US$/Bbl)
78
-1.1
Gold ($/OZ)
1,305
0.9
Cu (US$/MT)
6,858
0.2
Almn (US$/MT)
2,280
0.8
Currency
Close
Chg .%
USD/INR
68.3
-0.1
USD/EUR
1.2
0.2
USD/JPY
109.3
-0.7
YIELD (%)
Close
1MChg
10 Yrs G-Sec
7.9
0.02
10 Yrs AAA Corp
8.6
0.02
Flows (USD b)
24-May
MTD
FIIs
-0.1
-1.0
DIIs
0.2
2.0
Volumes (INRb)
24-May
MTD*
Cash
326
340
F&O
15,167
8,047
Note: YTD is calendar year, *Avg
YTD.%
1.8
-0.2
-12.8
YTD.%
2.0
7.5
0.4
-0.5
3.8
-1.4
YTD.%
17.2
0.1
-4.8
1.1
YTD.%
7.0
-2.4
-3.0
YTDchg
0.5
0.7
YTD
0.2
7.0
YTD*
370
8,040
Today’s top research idea
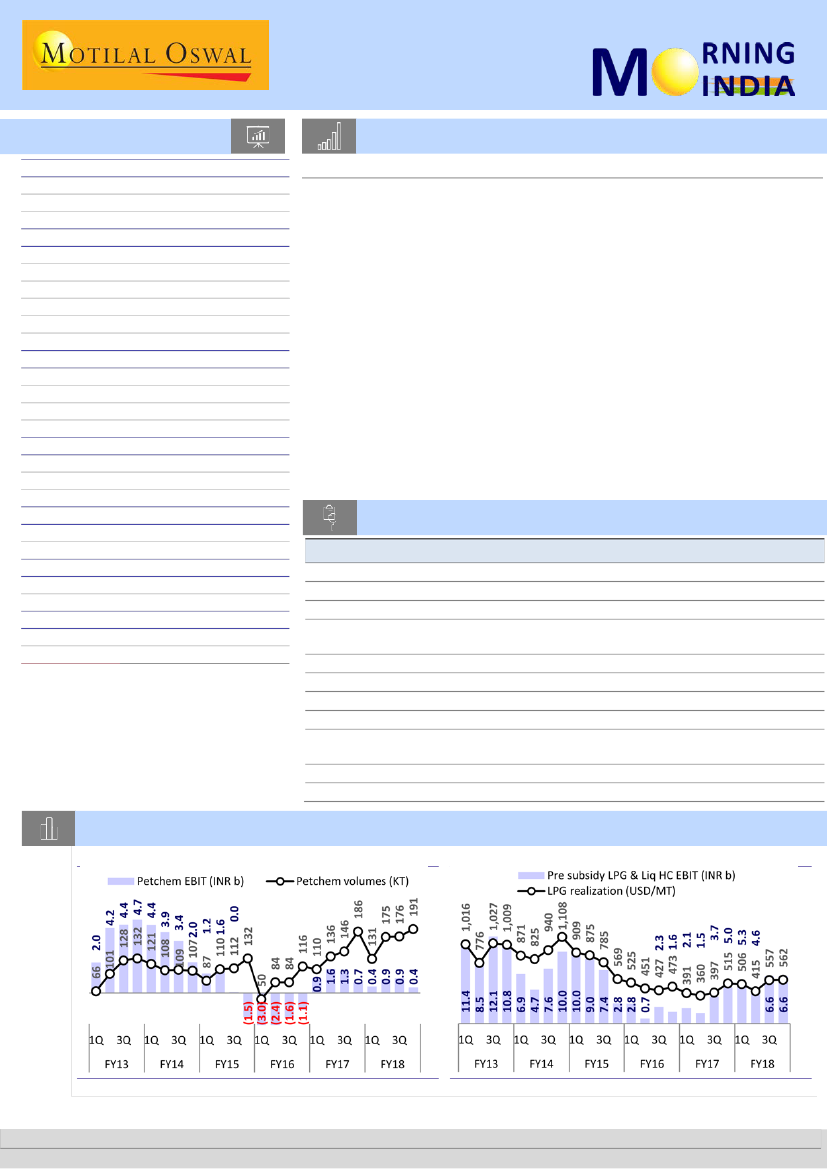
Gail India: EBITDA significantly below estimate; Petchem disappoints
Segmental analysis: Petchem disappoints due to higher input cost
Gas transmission EBIT grew 37% YoY (+6% QoQ) to INR7.1b. Gas transmission
volume stood at 106mmscmd (+5% YoY, -3% QoQ) and implied tariff at
INR1,244/mscm (-8% YoY, -6% QoQ). Base was lower due to one-time pay hike
provisioning.
While petchem sales stood at 191kmt (+3% YoY, +9% QoQ), realization declined
to USD1,322/MT (-6% YoY, +5% QoQ). EBIT stood at INR366m (-46% YoY, -61%
QoQ), hurt by higher input cost in 4QFY18.
Due to higher availability of rich gas, LPG/liq. HC sales stood at 324tmt (+17%
YoY, -1% QoQ). Realization was USD562/mt (+9% YoY, +1% QoQ). EBIT stood at
INR6.6b (+31% YoY, flat QoQ).
Gas trading EBIT fell 41% YoY (-54% QoQ) to INR1.6b, led by trading volumes of
89.2mmscmd (+8% YoY, +2% QoQ) and trading margins of INR197/mscm (-67%
YoY, -53% QoQ). Performance was impacted by higher gas cost in 4QFY18,
which lowers GAIL’s ability to charge higher marketing margin.
Research covered
Cos/Sector
Consumer
GAIL
Pidilite Inds
Key Highlights
Rural consumption gathering pace
EBITDA significantly below estimate; Petchem disappoints
Sales ahead of expectations, EBITDA in-line
Prestige & Above volumes up 15.3% YoY; higher other income drives
United Spirits
adj. PAT beat
United Breweries Stellar numbers, 24% volume growth drives beat on all fronts
L&T Infotech
Traction intact, but upside appears capped for now
Cummins India
Lower-than-expected margins dent results
GSK Pharma
Muted revenue growth; margins stable sequentially
Engineering-led beat; Keeping rating under review until demerger is
KPIT Tech
completed
Other Results
KPIT | REPCO | NELI | KSCL | ENIL | GRAN
Results Expectation BOB | CDH | ENGR | ICEM | JAGP | PAG | PCJL | SHKL | SUNP | TECHM
Chart of the Day: Gail India – EBITDA significantly below estimate; Petchem disappoints
Petchem volumes recovered to 191kt
Realizations up YoY
Source: MOSL, Company
Research Team (Gautam.Duggad@MotilalOswal.com)
Motilal Oswal research is available on www.motilaloswal.com/Institutional-Equities, Bloomberg, Thomson Reuters, Factset and S&P Capital.
Investors are advised to refer through important disclosures made at the last page of the Research Report.
 Motilal Oswal Financial Services
In the news today
Kindly click on textbox for the detailed news link
1
Govt push for merger of
Vodafone-Idea: new entity can
pay all dues
The government has allowed the
merged entity of Vodafone India
Ltd and Idea Cellular Ltd to clear
dues related to spectrum charges
and licence fees, a departure from
the telecom department’s earlier
stand that the merger will be
approved…
2
Donald Trump cancels 12 June summit with North Korea’s Kim Jong
Un
President Donald Trump cancelled his planned summit with North Korean
leader Kim Jong Un that had been scheduled for 12 June in Singapore,
citing “tremendous anger and open hostility” in recent statements from
Pyongyang. Trump’s decision was communicated on Thursday in a letter to
Kim released by the White House. North Korea hardened its rhetoric
toward the US earlier Thursday, warning it was ready for a “nuclear-to-
nuclear” showdown if the US didn’t follow through on the summit…
3
Windfall oil tax on ONGC in
offing to soften fuel prices
The government may levy a
windfall tax on oil producers like
Oil and Natural Gas Corp (ONGC)
as part of a permanent solution it
is working on for moderating the
spiralling retail prices of petrol and
diesel…
4
The telecom department (DoT) on
Thursday cleared Idea Cellular’s
sale of nearly 9,000-odd
standalone towers to a local arm
of American Tower Corp (ATC) for
Rs 4,000 crore. A top DoT official
told ET that the “Idea-ATC captive
towers deal has been approved”…
DoT clears Idea-ATC tower
deal
5
Bank credit grows at 12.64%,
deposits at 7.61%
Banks’ credit grew by 12.64%
year-on-year to Rs8,551,099
crore in the fortnight ended 11
May 2018, according to Reserve
Bank of India (RBI) data. In the
similar fortnight ended 12 May
2017, banks’ advances stood at
Rs7,590,941 crore…
6
Rs 130 bn tenders withdrawn
or cancelled to promote
Make in India products
Government tenders worth
about Rs 130 billion were either
cancelled or withdrawn and re-
issued after the Department of
Industrial Policy and Promotion
(DIPP) stepped in to change their
conditions for promoting 'made
in India' goods, a top official
said…
7
Govt hikes customs duty on
wheat to 30% to curb cheaper
imports
The government has raised the
customs duty on wheat from 20
% to 30 % in order to curb
cheaper imports and protect
domestic growers. The import
duty on walnut shell has also
been increased from 30 % to 100
%, according to a late night
notification issued by the…
25 May 2018
2
 Motilal Oswal Financial Services
Sector Update | 25 May 2018
Consumer
Rural consumption gathering pace
There has been an
increase in demand
from rural. Rural is
doing very well now. We
saw an improvement in
2017 and in 2018, we
are really gung-ho
about rural. Rural is the
economy that is going
to grow pretty fast, said
Parle Products Category
head BK Rao.
HUVR, HMN, BRIT our top rural picks from a medium-term perspective
Strong rural sales momentum reinforces positive outlook
For the third consecutive quarter, all consumer companies under coverage that
have rural reach of over 30% have stated that rural growth has outpaced urban
growth.
Rural demand had been the fulcrum of the strong volumes witnessed by the
sector in the years leading up to FY14, but had slowed down in FY15 and FY16
because of drought, and in FY17 because the impact of demonetization had
negated the potential positive benefits of a normal monsoon.
While urban volume growth has remained fairly resilient at mid-single-digit
levels, rural growth, which was growing at 1.5-2x urban growth in the years
leading up to FY14, declined to flat and even negative levels in the years that
followed. This continued be the case until 1QFY18, which was also affected by
channel disturbances ahead of GST implementation from July.
What are the factors leading to growth?
Patanjali's
spokesperson, SK
Tijarawala said, "The
rural market has picked
up. Today, someone
from the rural area is
also looking to consume
the same things as the
urban consumer. The
difference between
urban living and rural
living has been reduced.
GST has also played a
role in this as it has
made the entire nation
a single market.
Normal monsoon in FY18
Low base
Increase in MSPs in FY18
Increased rural allocation in recent budgets
Notably, the recovery in the past three quarters has happened despite disruptions in
the wholesale channel due to GST implementation. The wholesale channel acts as a
feeder for almost the entire rural demand in the sector.
Outlook appears promising
Four factors in particular brighten the prospects of a further recovery in rural
demand to earlier high levels:
Initial reports by both Skymet and IMD indicate that the monsoon is likely to be
normal in FY19.
Unlike the preceding two years, there will (hopefully) be no disturbances like
demonetization/GST implementation, impacting purchasing power or product
availability.
Likely spate of new launches in FY19, as demand trajectory is improving.
Distribution expansion by most companies over the past 3-4 years will start
bearing fruit.
Valuation and view
Link for above articles:
http://bestmediainfo.com/2018/
05/ad-spend-may-get-a-boost-as-
consumption-picks-up-in-rural/
We have BUY ratings on all four stocks that have high rural exposure – Hindustan
Unilever (HUVR), Colgate-Palmolive (CLGT), Dabur India (DABUR) and Emami (HMN).
HUVR, HMN and BRIT remain our top rural picks from a medium-term perspective.
While Britannia is currently an urban company (Rural is only around 20% of sales) a
combination of (a) its remarkable efforts in distribution ramp up- both in direct and
total reach over the past four years and (b) its success in its new strategy of Low
Unit Packs of its premium products as well as ‘Tiger’ Creams have resulted in
tremendous growth in the hinterland states in recent years with FY18 being
particularly strong. Management is targeting 33% of sales from rural.
25 May 2018
3
 Motilal Oswal Financial Services
Financial & Valuation (INR b)
Y/E March
2018 2019E
Sales
339.3 387.6
EBITDA
72.8
87.4
Adj. PAT
53.0
62.7
Adj. EPS INR
24.5
29.0
EPS Gr. (%)
24.7
18.3
RoE (%)
78.1
85.5
RoCE (%)
100.2 112.4
P/E (x)
64.0
54.1
2020E
442.1
105.9
76.7
35.4
22.3
96.1
126.3
44.2
Rationale for Hindustan Unilever (HUVR)
Five key trends are particularly relevant for HUVR, resulting in an elevation in its
earnings growth trajectory compared to the past (~20% EPS CAGR over FY17-20E
against 6-10% for the preceding 3/5/10 years before FY17: (i) its rapidly improving
adaptability to market requirements, (ii) its recognition of Naturals as a key sub-
segment across categories, (iii) continuing strong trend towards premiumization; (iv)
extensive plans to employ technology, and (v) renewed emphasis on margin growth
through ZBB and other cost saving efforts. Allied with best-of-breed RoE, HUVR
remains our sole BUY in the large-cap FMCG universe.
Financial & Valuation (INR b)
Y/E March
2018 2019E
Sales
25.3
29.9
EBITDA
7.2
9.0
Adj. PAT
5.5
6.7
Adj. EPS INR
24.3
29.6
EPS Gr. (%)
-8.5
21.9
RoE (%)
29.2
31.3
RoCE (%)
27.8
34.3
P/E (x)
43.2
35.4
Financial & Valuation (INR b)
Y/E March
2018 2019E
Sales
98.3 117.8
EBITDA
14.2
18.6
Adj. PAT
10.0
12.9
Adj. EPS INR
83.6 107.4
EPS Gr. (%)
13.5
28.4
RoE (%)
32.9
35.5
RoCE (%)
28.0
30.5
P/E (x)
68.3
53.2
2020E
34.5
10.5
8.1
35.6
20.4
33.9
39.6
29.4
2020E
139.8
23.0
16.0
133.2
24.0
39.9
34.7
42.9
Rationale for Emami (HMN)
We believe HMN remains a credible long-term play due to (a) healthy growth likely
in existing product categories where it has dominant market share, (b) best-of-breed
R&D spend and A&P spend, resulting innovative products as well as ability to back
up innovation with strong marketing, and (c) much-needed efforts on improving
direct distribution reach. At 29.4x FY20E EPS, HMN is inexpensive relative to peers,
particularly given the healthy long-term earnings growth opportunity and mid-30s
return ratios.
Rationale for Britannia (BRIT)
Rapidly expanding distribution, continuing investments in R&D and significant
expansion of its own manufacturing indicate the immense confidence that
management has on the growth prospects. The opportunity beyond biscuits is also
big. Continuing premiumization, significant incremental cost savings and a favorable
commodity cost outlook indicate the bright prospects for further EBITDA margin
expansion. We have a Buy rating with a TP of INR6,400 (48x Mar’20 EPS, at a 15%
premium to three-year average due to improving visibility on both volume recovery
and margin growth).
Financial & Valuation (INR b)
Y/E March
2018 2019E
Sales
41.9
47.1
EBITDA
11.1
13.0
Adj. PAT
6.8
7.9
Adj. EPS INR
25.0
29.2
EPS Gr. (%)
18.0
16.5
RoE (%)
48.7
50.5
RoCE (%)
47.6
49.4
P/E (x)
49.3
42.3
2020E
53.8
15.2
9.4
34.6
18.5
58.0
56.7
35.7
Rationale for Colgate-Palmolive (CLGT)
We are optimistic on CLGT’s earnings prospects, given (1) its impressive execution
after a delay in the herbal portfolio launch – the two products launched have seen
good response, and more products will be rolled out under the
Vedshakti
umbrella,
and (2) its high rural market share of ~60% (rural contributes 40%+ of its sales),
which makes it a promising play on rural recovery. Patanjali had severely impacted
business initially, but the threat is perceptibly reducing. Even on FY18 EPS, CLGT
trades at ~10% discount to our ex-cigarette and alcohol consumer peer valuations.
With return ratios superior to peers barring HUVR (return ratios will only improve on
better utilization of expanded capacity and with earnings growth apparently back on
track), such discounts are unwarranted, in our view.
Financial & Valuation (INR b)
Y/E March
2018 2019E
Sales
77.5
88.3
EBITDA
16.2
18.7
Adj. PAT
13.7
15.9
Adj. EPS INR
7.8
9.0
EPS Gr. (%)
7.2
16.0
RoE (%)
25.9
26.5
RoCE (%)
22.9
23.8
P/E (x)
47.4
40.8
2020E
100.8
21.5
18.3
10.4
15.5
28.0
25.4
35.3
Rationale for Dabur India (DABUR)
The much-vaunted earnings revival in the sector appears poised to come through,
and rural-dependent plays are likely to be at the vanguard in FY19. DABUR has
addressed the market share loss issue in its two key categories of Juices and Honey,
while Oral Care continues to do very well. With an expected EPS CAGR of ~16%
going forward (v/s less than 12% CAGR over FY14-17), we value the stock at 42x
March 2020E EPS (10% premium to three-year average) and derive a target price of
INR435. Relative to other three rural plays, however, DABUR has a much more
diversified product portfolio and is not dominant in many of them. Weaker
competitive advantage, therefore, results in some risks to earnings projections. RoE
is also weaker than the peers mentioned above.
4
25 May 2018
 Motilal Oswal Financial Services
24 May 2018
4QFY18 Results Update | Sector: Oil & Gas
GAIL India
BSE SENSEX
34,663
Bloomberg
Equity Shares (m)
M.Cap.(INRb)/(USDb)
52-Week Range (INR)
1, 6, 12 Rel. Per (%)
Avg Val, INRm
Free float (%)
S&P CNX
10,514
GAIL IN
1,691
786.5 / 12.2
389 / 260
-8/-16/-10
1575.0
46.4
CMP: INR317
TP: INR303 (-5%)
Upgrade to Neutral
EBITDA significantly below estimate; Petchem disappoints
Financials & Valuations (INR b)
Y/E Mar
2018 2019E
Net Sales
536.6
568.5
EBITDA
76.3
88.3
PAT
46.0
53.6
EPS (INR)
20.4
23.8
Gr. (%)
20.5
16.6
BV/Sh (INR)
182.1
197.0
RoE (%)
11.8
12.8
RoCE (%)
10.2
11.1
P/E (x)
15.5
13.3
P/BV (x)
1.7
1.6
EV/EBITDA (x)
8.8
7.8
2020E
654.4
95.7
58.6
26.0
9.4
213.3
12.9
11.0
12.2
1.5
7.2
Estimate change
TP change
Rating change
4QFY18 EBITDA stood at INR17b (+11% YoY, -14% QoQ), below our estimate of
INR21b, led by lower petchem earnings. Adj. PAT declined 4% YoY (-20% QoQ) to
INR10b (est. of INR12b) – the difference at PAT level declined due to lower
interest cost of INR333m (est. of INR1b; +50% YoY, -30% QoQ) and higher other
income of INR2.8b (est. of INR1.8b; -45%YoY, -9% QoQ). For FY18, EBITDA grew
by 21% YoY to INR76b and PAT grew by 32% YoY to INR46b.
Segmental analysis: Petchem disappoints due to higher input cost
Gas transmission EBIT grew 37% YoY (+6% QoQ) to INR7.1b. Gas
transmission volume stood at 106mmscmd (+5% YoY, -3% QoQ) and implied
tariff at INR1,244/mscm (-8% YoY, -6% QoQ). Base was lower due to one-
time pay hike provisioning.
While petchem sales stood at 191kmt (+3% YoY, +9% QoQ), realization
declined to USD1,322/MT (-6% YoY, +5% QoQ). EBIT stood at INR366m (-46%
YoY, -61% QoQ), hurt by higher input cost in 4QFY18.
Due to higher availability of rich gas, LPG/liq. HC sales stood at 324tmt
(+17% YoY, -1% QoQ). Realization was USD562/mt (+9% YoY, +1% QoQ). EBIT
stood at INR6.6b (+31% YoY, flat QoQ).
Gas trading EBIT fell 41% YoY (-54% QoQ) to INR1.6b, led by trading volumes
of 89.2mmscmd (+8% YoY, +2% QoQ) and trading margins of INR197/mscm
(-67% YoY, -53% QoQ). Performance was impacted by higher gas cost in
4QFY18, which lowers GAIL’s ability to charge higher marketing margin.
Valuation view:
US volumes for CY18 have been placed through various derivate
contracts, we are concerned about profitable placement of the contracts in light
of the long-term nature of the expensive contracts. The stock trades at 12.2x
FY20E EPS of INR26. We value GAIL using SOTP at INR303/share, implying 5%
downside. The core business is valued at 9x FY20E EPS, adjusted for other
income. The stock has corrected sharply ~10% since last earnings result. Thus,
purely on valuation basis, we upgrade the stock to
Neutral
from Sell.
FY17
FY18
4Q
134,217
15.4
15,250
11.4
3,471
220
4,981
-7,880
8,659
6,058
70.0
2,602
10,482
36.1
4.6
102
186
1Q
114,065
6.7
18,994
16.7
3,451
1,014
1,158
0
15,687
5,431
34.6
10,256
10,256
21.3
4.5
100
131
2Q
124,097
4.7
20,694
16.7
3,425
926
2,929
0
19,273
6,177
32.0
13,096
13,096
41.6
5.8
106
175
3Q
144,143
19.0
19,699
13.7
3,668
479
3,027
0
18,580
5,957
32.1
12,622
12,622
28.4
5.6
109
176
4Q
154,307
15.0
16,953
11.0
3,608
333
2,756
277
16,044
5,835
36.4
10,209
10,060
-4.0
4.5
106
191
FY17
480,743
-6.9
63,152
13.1
13,968
4,794
12,705
-2,987
54,108
19,079
35.3
35,029
38,016
65.4
16.9
100
578
FY18
536,612
11.6
76,339
14.2
14,151
2,751
9,870
277
69,584
23,400
33.6
46,184
46,035
21.1
20.4
105
673
FY18
4QE
147,458
9.9
21,105
14.3
3,724
1,019
1,757
0
18,120
6,161
34.0
11,959
11,959
14.1
5.3
110
158
Quarterly Performance
Y/E March
Net Sales
Change (%)
EBITDA
% of Net Sales
Depreciation
Interest
Other Income
Extraordinary item*
PBT
Tax
Rate (%)
PAT
Adj PAT
Change (%)
EPS (INR)
Key Assumptions
Gas Trans. volume (mmsmd)
Petchem sales ('000MT)
E: MOSL Estimates
1Q
106,866
-14.6
15,732
14.7
3,354
1,774
1,362
4,893
16,858
3,506
20.8
13,352
8,459
99.4
3.8
96
110
(INR Million)
2Q
118,582
-15.8
15,155
12.8
3,563
1,198
3,361
0
13,755
4,508
32.8
9,247
9,247
109.9
4.1
101
136
3Q
121,079
-9.5
17,015
14.1
3,579
1,601
3,002
0
14,836
5,007
33.7
9,829
9,829
48.0
4.4
103
146
Var.
vs est
5%
-20%
-3%
-67%
57%
-11%
-5%
-15%
-16%
-16%
-3%
21%
25 May 2018
5
 Motilal Oswal Financial Services
RESULTS
FLASH
24 May 2018
Results Flash | Sector: Consumer
Pidilite
Buy
BSE SENSEX
34,663
S&P CNX
10,514
CMP: INR1,080
TP: INR1,155
Conference Call Details
Date:
25 May 2018
Time:
4:00pm IST
Dial-in details:
+91-22-6280 1145
th
Sales ahead of expectations, EBITDA in-line
Consolidated performance
Reported net sales grew 14.7% YoY to INR14.9b (est. of INR14.1b). Reported
consumer bazaar segment revenues were up 6% YoY to INR12.3b, with
segmental EBIT growing 10.5% YoY to INR2.8b. Segmental EBIT margin
expanded 80bp YoY to 23.0%. Reported industrial segment grew by 7.3% to
INR2.7b, with segment margin expanding 100bp to 17.2%.
Gross margin shrank 110bp YoY to 52.1%. Lower staff costs (-80bp YoY to
11.7%) were offset by higher other expenses (+120bp YoY to 21.9%). This, along
with a weak gross margin, led to EBITDA margin contraction of 150bp YoY to
18.4% (est. of 19.6%).
EBITDA grew 6.2% YoY to INR2.7b (est. of INR2.8b). Adj. PAT grew 59.3% YoY to
INR2.5b (est. of INR1.9b).
FY18 highlights:
Sales rose 8.2% to INR60.8b. EBITDA increased 6.5% to
INR13.4b. EBITDA margin shrunk 40bp to 22.1%. Adj. PAT rose 12.1% to
INR9.7b.
Standalone performance
Reported net sales grew 12.5% YoY to INR12.7b. Reported consumer bazaar
segment revenues were up 2.4% YoY to INR10.2b, with segment EBIT growing
3.0% to INR2.7b. Segmental EBIT margin grew 20bp YoY to 26.4%.
Domestic consumer bazaar segment volumes are likely to have grown by 14%
YoY. Reported industrial segment grew by 7.3% to INR2.7b, with the segment
margin expanding 100bp to 17.2%.
Gross margin contracted 90bp YoY to 52.9%. Staff costs to sales were flat YoY at
11.0%, and increase in other expenses (+160bp YoY to 21.9%) led to EBITDA
margin contraction of 240bp YoY to 20%.
EBITDA grew 0.4% YoY to INR2.6b. Adj. PAT grew 78.7% YoY to INR2.4b.
4QFY18 imputed subsidiary
revenues increased 29.9% YoY to INR2.2b.
Financials & Valuations (INR b)
2018
2019E
Y/E Mar
Net Sales
60.8
71.3
EBITDA
13.4
15.4
NP
9.6
10.6
18.9
20.8
EPS (INR)
13.2
17.0
EPS Gr. (%)
57.0
51.9
P/E
2020E
82.2
17.7
12.1
23.9
14.9
45.1
Consolidated - Quarterly Earning Model
Y/E March
Net Sales
YoY Cha nge (%)
Tota l Expendi ture
EBITDA
Ma rgi ns (%)
Depreci a ti on
Interes t
Other Income
PBT
Ta x
Ra te (%)
Adj PAT
YoY Cha nge (%)
Ma rgi ns (%)
E: MOSL Estimates
1Q
15,694
6.8
11,754
3,939
25.1
258
35
241
3,887
1,174
30.2
2,713
16.3
17.3
FY17
2Q
3Q
14,177 13,344
7.5
-0.3
10,963 10,477
3,214
2,866
22.7
21.5
303
295
26
30
324
272
3,209
2,814
912
793
28.4
28.2
2,297
2,020
11.9
1.5
16.2
15.1
4Q
12,954
4.9
10,375
2,579
19.9
296
48
286
2,520
971
38.5
1,549
-7.5
12.0
1Q
15,203
-3.1
11,994
3,210
21.1
313
37
432
3,292
1,033
31.4
2,260
-16.7
14.9
FY18
2Q
3Q
15,299 15,429
7.9
15.6
11,538 11,727
3,761
3,703
24.6
24.0
296
292
39
41
337
195
3,763
3,564
1,245
1,193
33.1
33.5
2,518
2,370
9.6
17.3
16.5
15.4
FY17
4Q
14,853
14.7
12,114
2,739
18.4
298
38
521
2,924
457
15.6
2,467
59.3
16.6
56,168
4.8
43,570
12,598
22.4
1,151
139
1,123
12,430
3,851
31.0
8,579
6.7
15.3
FY18
60,784
8.2
47,372
13,412
22.1
1,199
155
1,484
13,542
3,927
29.0
9,615
12.1
15.8
(INR Million)
FY18
4QE
14,122
9.0
11,360
2,762
19.6
322
42
277
2,674
783
29.3
1,891
22.1
13.4
Var.
(%)
5.2
-0.8
9.3
30.5
25 May 2018
6
 Motilal Oswal Financial Services
RESULTS
FLASH
United Spirits
BSE SENSEX
34,663
S&P CNX
10,514
24 May 2018
Results Flash | Sector: Consumer
CMP: INR3,122
TP: INR3,510
Neutral
Conference Call Details
Date:
25 May 2018
Time:
12:00pm IST
Dial-in details:
+91-22-7115 8151
th
Prestige & Above volumes up 15.3% YoY; higher other income drives adj.
PAT beat
UNSP’s standalone net sales grew 7.3% YoY
to INR21.7b (est. of INR20.1b),
with a 2% YoY decline (est. of -9%) in overall volumes on a base of 8.2%
decline.
Prestige & Above volumes grew 15.3% YoY,
while Popular volumes fell 13.3%
YoY. Underlying* overall net sales grew 9% YoY. Underlying* net sales of
Prestige & Above rose 14% YoY and of Popular grew 2% YoY in 4QFY18.
Gross margin expanded 460bp YoY
(+140bp QoQ) to 48.8%, led by price
increase, productivity initiatives, favorable mix and operating model changes,
offsetting the adverse impact of GST. Underlying* gross margin expanded
260bp YoY. High operating costs as % of sales – advertising expenses (+200bp
YoY to 10.2%), staff costs (+250bp YoY to 8.5%) and other expenses (+30bp YoY
to 17.5%) – led to
EBITDA margin contraction of 30bp YoY.
Underlying*
EBITDA margin shrank 280bp YoY.
EBITDA grew 5.1% to INR2.7b (est. of INR2.7b). Adj. PAT grew 83.6% to INR1.9b
(est. of INR1.3b).
FY18 performance:
Volumes declined 13%. Reported sales, EBITDA and adj.
PAT grew -4.4%, -2.3% and 24%, respectively. Gross and EBITDA margin
expanded 460bp and 30bp YoY to 47.5% and 12%, respectively. Underlying*
net sales were up 1%. Underlying gross margin expanded 290bp, while EBITDA
margin stood flat.
Financials & Valuations (INR b)
2018 2019E 2020E
Y/E Mar
Net Sales
81.7
95.7
112.3
EBITDA
10.2
14.4
18.5
NP
5.6
8.3
11.4
EPS (INR)
38.2
56.9
78.5
EPS Gr. (%)
43.0
74.3
38.1
BV/Sh. (INR) 172.3 254.7 350.6
RoE (%)
22.2
22.3
22.4
RoCE (%)
13.5
16.7
18.9
P/E (x)
81.6
57.1
41.4
P/BV (x)
18.1
12.8
9.3
*Underlying movement excludes the one off impact of operating model changes,
customer claim arising out of legacy commercial terms last year and restructuring
costs.
25 May 2018
7
 Motilal Oswal Financial Services
RESULTS
FLASH
United Breweries
BSE SENSEX
34,663
S&P CNX
10,514
24 May 2018
Results Flash | Sector: Consumer
CMP: INR1,180
TP: INR1,450
Buy
Stellar numbers, 24% volume growth drives beat on all fronts
4QFY18 performance
Net sales grew 32% YoY off a weak base to INR14.7b (est. of INR13.7b).
EBITDA more than doubled YoY to INR2.1b (est. of INR1.8b). Adj. PAT grew
from INR67m in 4QFY17 to INR909m (est. of INR693m) in 4QFY18.
Volumes grew by a strong 24% YoY, with continued market share gains
(industry grew at 22%).
Demand was impacted in the base quarter ahead of the highway ban in two
states (with both industry and UBBL reporting 13% volume decline for
4QFY17). Growth was healthy despite the absence of supply in West Bengal
due to the lack of clarity on the new excise structure.
Gross margin expanded 150bp YoY to 52.8% in 4QFY18. Strong sales growth
meant that employee costs were down 50bp YoY to 7.5% and other
expenses were down 300bp to 31.2%. Consequently, EBITDA margin
expanded 510bp YoY to 14.2% (est. of 13.1%).
FY18 performance
Net sales were up 18.6% YoY to INR56.2b. EBITDA was up 40.5% YoY to
INR9b, as the margin expanded 250bp YoY to 16%. PAT was up 71.6% YoY to
INR3.9b.
Full-year volume growth was 10%, ahead of industry growth of 7%. This is
the second consecutive year of market share gain for UBBL.
Market share gains were registered in most large states like Telangana,
Andhra Pradesh, Rajasthan, Orissa, Tamil Nadu and Karnataka.
Company announced in the press release that it expects mid-single-digit
industry volume growth in FY19 as well.
In view of the improved demand scenario, management expects to increase
capex by 50% over the current capex of around INR2b.
Conference Call Details
Date:
30 May 2018
Time:
4:00pm IST
Dial-in details:
+91-22-6280 1384
th
Financials & Valuations (INR b)
Y/E Mar
Net Sales
EBITDA
NP
EPS (INR)
EPS Gr. (%)
P/E (x)
P/BV (x)
2018
56.2
9.0
3.9
14.9
71.5
79.3
11.8
2019E
63.5
10.5
4.6
17.4
23.9
67.7
10.2
2020E
73.0
13.0
6.0
22.9
31.2
51.6
8.7
Standalone - Quarterly Earning Model
Y/E March
Net Sales
YoY Cha nge (%)
Tota l Expendi ture
EBITDA
YoY Cha nge (%)
Ma rgi ns (%)
Depreci a ti on
Interes t
Other Income
PBT
Ta x
Ra te (%)
MI & P/L of As s o. Cos .
Adj PAT
YoY Cha nge (%)
Ma rgi ns (%)
E: MOSL Es ti ma tes
1Q
15,642
7.5
12,733
2,909
17.1
18.6
637
148
136
2,260
790
34.9
0
1,471
20.4
9.4
FY17
2Q
3Q
10,368 10,222
-3.3
-6.8
9,156
8,942
1,212
1,280
-10.3
-28.9
11.7
12.5
702
698
141
153
8
330
376
759
106
274
28.1
36.1
0
0
271
485
-48.1
-31.9
2.6
4.7
4Q
11,127
-8.4
10,116
1,011
-21.3
9.1
833
144
43
76
9
11.7
0
67
-87.1
0.6
1Q
16,742
7.0
13,559
3,184
9.4
19.0
649
142
63
2,456
837
34.1
0
1,619
10.1
9.7
FY18
2Q
3Q
4Q
12,764 11,971 14,693
23.1
17.1
32.0
10,545 10,445 12,611
2,219
1,526
2,082
83.1
19.3
105.9
17.4
12.7
14.2
650
650
648
127
93
114
12
8
48
1,454
791
1,368
515
317
459
35.4
40.1
33.6
0
0
0
938
474
909
246.9
-2.3 1,250.4
7.4
4.0
6.2
FY17
47,341
-2.2
40,930
6,412
-7.3
13.5
2,870
587
516
3,472
1,178
33.9
0
2,293
-23.0
4.8
FY18
56,170
18.6
47,159
9,011
40.5
16.0
2,596
477
130
6,068
2,128
35.1
4
3,936
71.6
7.0
FY18
4QE
13,742
23.5
11,945
1,796
78
13.1
769
146
62
943
249
26.5
0.0
693
930.3
5.0
Variance
6.9%
15.9%
45.1%
31.1%
25 May 2018
8
 Motilal Oswal Financial Services
24 May 2018
4QFY18 Results Update | Sector: Technology
L&T Infotech
BSE SENSEX
34,663
Bloomberg
Equity Shares (m)
M.Cap.(INRb)/(USDb)
52-Week Range (INR)
1, 6, 12 Rel. Per (%)
Avg Val, INRm
Free float (%)
S&P CNX
10,514
LTI IN
172
259.4 / 3.8
1755 / 725
10/67/103
169.0
17.0
CMP: INR1,690
TP: INR1,700(+1%) Downgrade to Neutral
Traction intact, but upside appears capped for now
Financials & Valuations (INR b)
2018 2019E
Y/E Mar
73.1
91.1
Net Sales
12.5
16.4
EBITDA
10.6
14.4
PAT
66.3
82.3
EPS (INR)
19.6
24.0
Gr. (%)
220.6
283.1
BV/Sh (INR)
33.1
32.7
RoE (%)
31.2
36.4
RoCE (%)
25.1
20.3
P/E (x)
7.6
5.9
P/BV (x)
2020E
104.8
19.2
16.3
92.9
13.0
353.7
29.2
34.0
17.9
4.7
Estimate change
TP change
Rating change
All-round momentum intact…
LTI’s 4.5% QoQ CC revenue growth exceeded our estimate of +3.5%. EBITDA
margin of 17.7% (est. of 17.1%) expanded 60bp QoQ. PAT of INR3.4b was up
20% YoY (in-line), as lower other income offset the operational beat.
For FY18, LTI clocked an industry leading growth rate of 14.7% YoY CC. Due
to currency headwinds, the margin for the year contracted by 180bp to
17.7%. However, hedges at >INR71/USD resulted in foreign exchange gains
of INR3.4b (23% of PBT) in FY18, leading to PAT growth of 20%.
…and traction remains broad-based
Growth in FY18 has been broad-based, with five out of seven verticals (65%
of revenue) growing in strong double-digits (13-30% YoY). Although there
was some weakness in Insurance, it is likely to be short-lived.
This, along with 42% YoY growth in Digital (now 33% of revenue) and
healthy deal wins, provides visibility of continued momentum in FY19 – as
evident from the 18.7% YoY CC run-rate the company is at as of 4Q.
Valuation view – upside capped in the near term
Given the strong exit and the likelihood of continued traction, even a 3%
CQGR (v/s 5% in FY18) would lead to 18% YoY growth in FY19. Furthermore,
INR depreciation would propel margin expansion, although that wanes
because of lower hedge gains.
Given the strong performance and adjustments to our currency estimates
(-3%), we have upgraded our earnings estimate by 12/8% for FY19/20.
Despite this, LTI’s CMP discounts forward earnings by 18x for FY18-20 USD
revenue/earnings CAGR of 16/18%. Although LTI’s performance would be in
the top quartile, in our view, further upside from current levels may be
capped from a one-year-forward perspective. Peers (MPHL, HEXW, MTCL)
demonstrating similarly traction are trading at the same valuation level.
Our price target of INR1,700 discounts forward earnings by 18x – and we are
changing our rating to Neutral, given the implied one-year upside. However,
we would turn buyers on dips.
3Q
245
2.3
16,667
12.1
34.3
16.2
3,020
18.1
15.3
597
21.2
2,481
6.7
10.5
14.2
20,605
78.1
18.1
52.3
4Q
254
3.7
16,772
7.7
35.8
16.8
3,190
19.0
16.5
503
22.3
2,547
2.7
11.4
14.6
21,023
78.3
16.9
51.3
1Q
259
2.0
16,707
7.4
33.8
17.0
2,799
16.8
14.4
1,084
23.4
2,673
4.9
13.3
15.3
22,321
77.7
14.7
53.2
FY18
2Q
271
4.4
17,509
9.3
33.9
17.1
2,943
16.8
14.5
1,017
23.2
2,730
2.1
17.4
15.6
22,554
79.6
15.0
53.4
FY17
3Q
294
8.5
18,837
13.0
33.3
16.2
3,215
17.1
14.9
883
23.4
2,829
3.6
14.0
16.2
23,394
80.3
14.6
53.8
4Q
309
5.3
20,012
19.3
33.5
15.9
3,537
17.7
15.9
1,118
21.3
3,380
19.5
32.7
15.8
24,139
79.9
14.8
54.3
970
9.3
65,009
11.2
35.2
16.3
12,303
18.9
16.2
1,835
21.4
9,709
5.9
55.5
21,023
78.1
48.3
FY18
1,132
16.7
73,065
12.4
33.6
16.5
12,494
17.1
15.0
4,101
22.8
11,609
19.6
66.3
24,139
79.4
53.7
(INR Million)
Est.
Var. (% /
4QFY18
bp)
305
1.2
4.0
127
19,648
1.9
17.1
217
34.1
(53)
17.0
(114)
5.5
3,353
17.1
61
15.6
24
1,330
(16.0)
23.4
0.2
3,373
19.2
25
32.4
28
19.3
24,314
(0.7)
81.0
(110)
54.8
(53)
Quarterly Performance
Y/E March
Revenue (USD m)
QoQ (%)
Revenue (INR m)
YoY (%)
GPM (%)
SGA (%)
EBITDA
EBITDA Margin (%)
EBIT Margin (%)
Other income
ETR (%)
Adj PAT
QoQ (%)
YoY (%)
EPS (INR)
Headcount
Util incl. trainees (%)
Attrition (%)
Offshore rev. (%)
E: MOSL Estimates
1Q
231
0.6
15,550
16.6
35.3
15.7
3,050
19.6
16.9
372
21.2
2,359
3.2
35.1
13.5
19,292
77.4
19.5
51.9
FY17
2Q
240
3.7
16,020
9.1
35.4
16.4
3,044
19.0
16.1
365
21.0
2,326
-1.4
21.3
13.3
21,074
78.7
18.5
51.2
25 May 2018
9
 Motilal Oswal Financial Services
RESULTS
FLASH
Cummins India
BSE SENSEX
34,663
S&P CNX
10,514
14 May 2018
Results Flash | Sector: Capital Goods
CMP: INR718
TP:INR1,040(+45%)
Buy
Conference Call Details
Date:
25
May 2018
Time:
11:00am IST
Dial-in details:
+91-22-3945 5000
Pin:39082031#
th
Lower-than-expected margins dent results
Sales of INR12.3b (+4% YoY) were in line with our estimate of INR12.2b
(consensus: INR12.9b).
Gross margin of 34.9% (flat YoY, -200bp QoQ) was below our estimate of
36.4%. The contraction in the margin can be attributed to RM pressures,
inability to take price hikes in domestic DG segment, and adverse product mix.
EBITDA stood at INR1.73b (+2% YoY; miss v/s estimate of INR1.9b), with the
margin of 14% (-40bp YoY) also below our estimate of 15.4%.
Other income stood at INR664m v/s our estimate of INR564m.
Tax rate was at 23% v/s our estimate of 19%.
PAT of INR1.61b (+2% YoY) was below our estimate of INR1.68b (consensus:
INR1.7b).
Financials & Valuations (INR b)
FY18 FY19E
Y/E Mar
Net Sales
50.8
59.6
EBITDA
7.3
9.9
NP
7.1
8.6
EPS (INR)
23.5
30.9
EPS Gr. (%)
-11.2
31.2
BV/Sh. (INR)
143.8 155.7
RoE (%)
18.3
20.6
RoCE (%)
16.1
19.7
Div. Yield
1.9
2.3
FY20E
68.8
11.9
10.1
36.6
Valuation view:
18.6
The stock trades at 23/20x FY19/20E EPS of INR31/36.6. We have a
Buy
rating on
169.8
22.5
the stock with a target price of INR1,040, valuing the business at 25x FY20E EPS.
21.5
2.7
KKC: Quarterly Performance (Standalone)
Y/E March
Sales
Change (%)
EBITDA
Change (%)
As of % Sales
Depreciation
Interest
Other Income
PBT
Tax
Effective Tax Rate (%)
Adjusted PAT
Change (%)
Reported PAT
Change (%)
1Q
12,590
-3.9
2,063
-6.9
16.4
206
21
416
2,252
440
19.5
1,812
(14.3)
1,812
(14.3)
FY17
FY18
FY17 FY18 Vs Est.
2Q
3Q
4Q
1Q
2Q
3Q
4Q
4Q
12,790 13,550 11,844 13,408 11,539 13,547 12,332 50,773 50,825 12,227
7.1
19.0
11.1
6.5
-9.8
0.0
4.1
7.8
0.1
3.2
1,990 2,265 1,700 1,953 1,675 1,967 1,731 8,018 7,325 1,877
-1.4
31.1
-4.9
-5.4 -15.8
-13.2
1.8
14.6 -12.3
10.4
15.6
16.7
14.4
14.6
14.5
14.5
14.0
15.8
14.4
15.4
209
225
208
208
220
237
273
848
938
316
43
55
49
42
38
34
34
168
148
54
692
461
511
583
536
501
664 2,080 2,285
564
2,430 2,446 1,954 2,286 1,953 2,197 2,088 9,082 8,523 2,072
461
19.0
1,969
(0.5)
1,969
(0.5)
466
19.0
1,981
11.3
1,981
11.3
369
18.9
1,585
(5.1)
1,585
(5.1)
625
27.4
1,660
(8.4)
2,222
22.6
424
21.7
1,529
(22.3)
1,529
(22.3)
475
21.6
1,722
(13.1)
1,722
(13.1)
475
22.8
1,612
1.7
1,612
1.7
1,736
19.1
7,346
(2.8)
7,346
(2.8)
2,000
23.5
6,524
(11.2)
6,524
(11.2)
394
19.0
1,678
5.9
1,678
5.9
(INR m)
Var.
(%)
0.9%
-7.8%
0.7%
-3.9%
-3.9%
25 May 2018
10
 Motilal Oswal Financial Services
24 May 2018
Q4FY18 Results Update | Sector: Healthcare
GSK Pharma
Neutral
BSE SENSEX
34,663
Bloomberg
Equity Shares (m)
M.Cap.(INRb)/(USDb)
52-Week Range (INR)
1, 6, 12 Rel. Per (%)
Avg Val, INRm
Free float (%)
S&P CNX
10,514
GLXO IN
Muted revenue growth; margins stable sequentially
84.7
4QFY18 sales declined ~2% YoY (+6% QoQ) to INR7.5b (est. of INR7.4b).
202.3 / 3.1
Other income came in lower at INR183m v/s INR351m in 4QFY17. EBITDA
2700 / 2040
rose significantly by ~33% YoY to INR1.5b, primarily due to a lower base
-2/-7/-15
29.0
(4QFY17 was impacted by regulatory issues). EBITDA margin stood at 20.7%
25.0
(+540bp YoY). Adj. PAT rose ~21% YoY to INR1.1b, led by operational
CMP: INR2,388
TP: INR2,500(+5%)
Financials & Valuations (INR b)
2018
2019E
Y/E Mar
Net Sales
29.0
32.1
EBITDA
5.1
6.4
PAT
3.3
4.8
EPS (INR)
39.3
56.9
Gr. (%)
14.4
44.9
BV/Sh (INR)
197.8
174.3
RoE (%)
19.9
32.7
RoCE (%)
18.1
30.6
P/E (x)
60.8
42.0
P/BV (x)
12.1
13.7
leverage.
2020E
Margin at healthy level:
Sales declined 2% YoY. Although revenues
declined marginally, adjusting for GST impact and prior-year disposals,
revenue growth was in double-digits with strong volume growth. Margin
improvement of 540bp YoY is primarily due to a lower base, which was
impacted by regulatory issues and price erosion. GLXO’s change in strategy
of focused brands and portfolio led to an improved product mix and a
healthy margin. During the quarter, GLXO launched Biopatch. The company
expects the EBITDA margin of 18-20% over the medium term.
Revenue improvement is key:
GLXO’s manufacturing plant at Vemgal is
nearing completion (expected to be commissioned by mid-CY18), post which
we expect revenues to pick up. The company is also planning to diversify its
product portfolio (currently >90% of top-line comes from the acute
business). According to AIOCD, FDC-related market grew by 17% YoY.
Secondary sales of GLXO rose 5.8%, while market secondary sales increased
8.7% in 4QFY18.
Valuation view:
We believe GLXO has strong parent support, a superior
brand portfolio (competitive advantage), a high payout ratio (>100%) and
industry leading return ratios (RoCE of ~30%). We maintain
Neutral
with a
TP of INR2,500 @ 40x 1HFY20E EPS (v/s INR2,500 @ 43x 1HFY20E PER). We
increase FY19/20E EPS by ~4/2% led by margin improvement. We cut our
target multiple to 40x from 43x due to regulatory uncertainty.
36.0
7.2
5.3
62.3
9.3
174.3
35.7
35.7
38.4
13.7
Estimate change
TP change
Rating change
25 May 2018
11
 Motilal Oswal Financial Services
KPIT Technologies
BSE SENSEX
34,663
Bloomberg
Equity Shares (m)
M.Cap.(INRb)/(USDb)
52-Week Range (INR)
1, 6, 12 Rel. Per (%)
Avg Val, INRm
Free float (%)
S&P CNX
10,514
KPIT IN
197
53.5 / 0.8
273 / 105
10/51/128
404.0
81.1
24 May 2018
Q4FY18 Results Update | Sector: Technology
CMP: INR271
TP: NA
Under Review
Financials & Valuations (INR b)
2018 2019E
Y/E Mar
36.7
42.3
Net Sales
3.8
5.1
EBITDA
2.6
3.3
PAT
12.7
15.0
EPS (INR)
6.4
18.3
Gr. (%)
82.6
97.6
BV/Sh (INR)
15.4
16.7
RoE (%)
15.8
19.9
RoCE (%)
21.3
18.0
P/E (x)
3.3
2.8
P/BV (x)
2020E
45.9
5.5
3.7
16.6
10.9
114.2
15.7
19.1
16.3
2.4
Estimate change
TP change
Rating change
Strong revenue beat:
4QFY18 revenue growth of 6.5% QoQ was above our
estimate of +2.8%, primarily driven by strength in Product Engineering
(+11% QoQ) and Products & Platforms (+49% QoQ). IT Services business
remained sluggish, with SAP declining by 3% and IES remaining flat QoQ.
Margins bogged down by transaction expenses:
EBITDA margin expanded
60bp QoQ to 11.4%, largely in-line. However, the quarter included expenses
related to the demerger of the Engineering business and the merger with
Birlasoft. Excluding these, EBITDA margin was at 12.7% (+190bp QoQ). PAT
of INR838m was up 35% QoQ (est. of +18%).
Guidance implies lower CQGR:
KPIT guided for 8-10% revenue growth in
FY19, despite the strong exit to FY18, implying a CQGR of 0.8-1.5%, which is
much lower than the 4% achieved in FY18. The profitability guidance of
11.5-12.5% for FY19 is lower than the current adjusted operating margin of
12.7%, but it bakes in the additional transaction-related expenses. We have
upped our earnings by 11/12% for FY19/20 to factor in 3% lower INR, higher
revenue growth and margins.
On the sidelines till the transaction takes place:
KPIT’s merger-demerger
transactions are likely to be executed this year. Birlasoft will be nearly one-
third of the combined entity, and thus, visibility in that segment is key
determinant of KPIT’s value. However, that will remain elusive until the
merger process is completed. As a result, any view on KPIT’s current
disclosures is only on two thirds of the business, which compels us to put
our rating under review.
Awaiting completion of demerger before taking a stance:
That said, we
note that current valuations capture a fairly robust recovery in margins for
KPIT, continued strong growth in Engineering, and also revenue momentum
in Birlasoft (~12-13% CAGR, mid-teens EBITDA margin), based on the
numbers shared at the time of the demerger announcement. Further upside
will be a function of material traction in Birlasoft (which we would not
know) and/or recovery in KPIT’s IT Services segment.
4Q
128
4.4
8,585
2.1
29.2
19.0
870
10.1
7.3
12
0
15.3
537
13.1
-39.3
2.7
12,110
68.3
43.9
35.8
1Q
134
4.8
8,704
8.4
26.6
17.6
788
9.1
6.9
121
26
23.4
555
3.3
0.9
2.8
12,261
68.8
44.8
34.8
FY18
2Q
3Q
142
141
5.7
-0.7
9,160
9,128
10.2
9.9
28.1
30.7
18.2
19.9
902
989
9.9
10.8
7.8
8.6
114
25
26
24
24.4
21.3
603
619
8.7
2.6
7.4
30.3
3.0
3.1
11,946
12,211
70.2
70.8
43.2
43.0
36.2
38.0
FY17
4Q
150
6.5
9,664
12.6
31.3
19.9
1,099
11.4
8.7
191
29
16.5
838
35.4
56.0
3.8
12,527
73.0
44.5
38.4
494
0.8
33,234
3.1
29.1
18.7
3,486
10.5
8.0
207
136
22.2
2,125
-24.5
11.9
12,110
68.3
43.4
FY18
568
14.8
36,656
10.3
29.2
18.9
3,785
10.3
8.0
450
104
21.1
2,616
23.1
12.7
12,527
70.7
43.9
Est. Var. (% /
4QFY18
bp)
145
3.6
2.8
374bp
9,328
3.6
8.7
391bp
31.1
21bp
19.5
44bp
1,083
1.5
11.6
-24bp
9.4
-67bp
123
54.8
24
18.0
25.0
730
14.8
18.0 1745bp
35.9 2010bp
3.7
12,805
-2.2
73.0
-5bp
42.7
181bp
Engineering-led beat; Keeping rating under review until
demerger is completed
Quarterly Performance (Consolidated)
Y/E March
Revenue (USD m)
QoQ (%)
Revenue (INR m)
YoY (%)
GPM (%)
SGA (%)
EBITDA
EBITDA Margin (%)
EBIT Ma rgi n (%)
Other i ncome
Interes t
ETR (%)
PAT
QoQ (%)
YoY (%)
EPS (INR)
Headcount
Uti l excl . tra i nees (%)
Offs hore rev. (%)
Fi xed Pri ce (%)
1Q
120
-3.5
8,032
5.9
28.9
18.3
855
10.7
8.3
116
56
24.3
551
-37.8
24.0
2.8
11,288
68.1
41.5
28.5
FY17
2Q
3Q
123
123
3.0
-0.4
8,310
8,307
2.3
2.2
29.5
29.0
18.5
18.8
914
846
11.0
10.2
8.6
7.9
49
29
14
66
25.1
23.1
562
475
2.0
-15.5
-25.2
-35.4
2.8
3.7
11,666
11,881
69.2
67.8
44.1
44.0
28.0
33.7
25 May 2018
12
 Motilal Oswal Financial Services
Repco Home Finance
BSE SENSEX
34,663
Bloomberg
Equity Shares (m)
M.Cap.(INR b)/(USD b)
52-Week Range (INR)
1, 6, 12 Rel. Per (%)
Avg Val,( INR m)
Free float (%)
REPCO IN
Core TN market tepid; improvement in asset quality
62.6
REPCO’s 4QFY18 PAT increased 10% YoY to INR566m (in-line). Modest loan
35.5/0.5
growth, a tapering cost-to-income ratio and a sequential decrease in the GNPL
923 / 515
ratio were the key highlights of the quarter.
-8/-13/-38
Sanctions increased 19% QoQ to INR9.2b, while disbursements rose 29% QoQ
195.0
to INR8.5b. This was modestly below management’s guidance of sanctions of
62.9
2020E
5.3
4.7
2.8
44.3
283.7
2.3
16.8
7.0
12.8
2.0
0.5
S&P CNX
10,514
24 May 2018
4QFY18 Results Update | Sector: Financials
CMP: INR568
TP: INR710 (+25%)
Buy
Financials & Valuations (INR b)
Y/E March
2018 2019E
NII
4.3
4.7
PPP
3.8
4.1
PAT
2.1
2.4
EPS (INR)
32.9
37.7
BV/Sh. (INR)
207.5 242.5
RoAA (%)
2.2
2.2
RoE (%)
16.9
16.7
Payout (%)
8.0
7.0
Valuation
P/E (x)
17.2
15.1
P/BV (x)
2.7
2.3
Div. Yield (%)
0.4
0.4
INR10b in 4QFY18. Management indicated that the core market of Tamil Nadu
(TN) still faces lingering effects of the sand mining ban, as TN loan book growth
was a tepid 6% YoY.
Consequently, loan growth was at 10.3% YoY (v/s 9.6% in 3QFY18), resulting in
a loan book of INR98.6b. LAP book has remained steady at INR17-18b for the
past seven quarters.
Calculated spreads increased 25bp QoQ to 3.4%, driven by stable yields and a
25bp reduction in CoF. We believe cost of funds has bottomed out and this
should have an impact on spreads, going forward.
The mix of CPs in the borrowing mix continues to increase (9.8% in 4QFY18 v/s
7% in 3QFY18 and 4.6% YoY in 4QFY17).
Opex increased 7% YoY to INR138m (4% beat), leading to a 140bp QoQ decline
in the cost-to-income ratio to 17.5%.
GNPA ratio decreased 87bp QoQ to 2.9%, driven by an 80bp QoQ reduction in
the home loans GNPA ratio and a 100bp reduction in LAP GNPLs. However, we
estimate INR150m write-off in the quarter.
Valuation view:
REPCO recorded a loan book CAGR of 26% and earnings CAGR
of 24% over the past five years. Presence in the underserved markets,
reasonable pricing power on the asset side and expanding reach should
support its earnings over the longer term. However, in the recent past, the
company has been plagued with several issues, predominantly on the growth
front. We believe that these issues should get resolved over the next few
quarters. We cut our FY19E/20E EPS by 3%/4% to factor in lower growth.
Buy
with a target price of INR710 (2.5x FY20E BVPS).
FY17
2Q
2,499
1,597
902
22.0
98
1,000
22.0
163
-6.8
837
29.9
127
710
253
457
17.0
22.6
16.3
35.7
3Q
2,589
1,682
907
16.2
67
974
15.5
163
1.9
811
18.7
96
714
250
464
20.4
21.1
16.8
35.0
4Q
2,663
1,635
1,028
20.7
73
1,102
16.8
200
30.7
902
14.1
116
786
280
506
19.8
15.6
18.2
35.6
1Q
2,587
1,628
959
14.2
71
1,030
12.0
171
14.9
859
11.4
167
692
241
452
14.2
11.7
16.6
34.8
FY18
2Q
2,715
1,622
1,093
21.2
95
1,188
18.8
179
9.4
1,009
20.6
166
843
285
559
22.3
8.9
15.0
33.7
3Q
2,694
1,623
1,071
18.1
82
1,153
18.3
217
33.0
935
15.3
194
741
256
485
4.4
6.9
18.9
34.6
4Q
2,774
1,610
1,164
13.2
59
1,223
11.0
214
6.9
1,009
12.0
143
866
300
566
11.9
7.6
17.5
34.6
(INR Million)
FY18
FY17
10,140
6,463
3,677
21.1
319
3,996
19.8
676
5.1
3,320
23.3
519
2,802
979
1,823
21.4
15.6
16.9
35.0
10,771
6,484
4,287
16.6
307
4,594
15.0
781
15.6
3,813
14.8
670
3,143
1,082
2,061
13.1
0.0
17.0
34.4
REPCO: Quarterly performance
Y/E March
Interes t Income
Interes t Expens es
Net Interest Income
YoY Growth (%)
Other i ncome
Total Income
YoY Growth (%)
Opera ti ng Expens es
YoY Growth (%)
Operating Profits
YoY Growth (%)
Provi s i ons
Profit before Tax
Ta x Provi s i ons
Profit after tax
YoY Growth (%)
Borrowi ngs growth (%)
Cos t to Income Ra ti o (%)
Ta x Ra te (%)
E: MOSL Es ti ma tes
1Q
2,390
1,550
840
26.5
80
920
26.0
149
-3.5
771
33.9
179
592
196
395
30.8
25.3
16.2
33.2
25 May 2018
13
 Motilal Oswal Financial Services
Navneet Education
BSE SENSEX
34,663
Bloomberg
Equity Shares (m)
M.Cap.(INRb)/(USDb)
52-Week Range (INR)
1, 6, 12 Rel. Per (%)
Avg Val, INRm
Free float (%)
S&P CNX
10,514
NELI IN
233.6
30.1 / 0.4
194 / 125
-16/-28/-33
17.0
38.2
May 2018
4QFY18 Results Update | Sector: Publishing
CMP: INR129
TP: INR149 (+15% )
Neutral
Sluggish quarter; policy uncertainty prevails
Financials & Valuations (INR b)
Y/E March
2018 2019E
Net Sales
12.0
13.7
EBITDA
2.2
2.8
NP
1.3
1.7
EPS (INR)
5.4
7.5
EPS Gr. (%)
-26.1
38.0
BV/Sh. (INR)
32.2
36.0
RoE (%)
17.4
21.8
RoCE (%)
14.4
18.9
P/E (x)
23.9
17.3
P/BV (x)
4.0
3.6
Revenues hurt by weak Publishing and Stationery performance
:
Navneet
Education’s (NELI) revenue grew by a sluggish 1.3% YoY to INR2,126m in
4QFY18. EBITDA fell 15% YoY to INR238m, with the margin down 210bp YoY to
11.2%. Adj. PAT declined 10% YoY to INR151m. PAT margin contracted 92bp YoY
to 7.1% in 4QFY18. For FY18, revenue grew 2% to INR12,040m, EBIDTA declined
2020E
21% to INR2,225m and EBIDTA margin contracted 533bp to 18.5%.
14.4
3.0
1.9
8.3
11.3
39.5
22.0
20.8
15.5
3.3
Publishing revenue marred by delay in textbook release:
Publishing revenue
grew at a muted 5% in FY18 due to: (1) a six-month delay in the government
releasing its text books (based on which the supplementary material is created)
and (2) lower-than-estimated government orders for the year. These
government orders are typically placed by the social welfare and tribal
departments, among others, to provide support to underprivileged students.
According to management, the focus of these departments has now shifted to
infrastructure provision, and thus, it does not foresee any government orders
from now.
Stationery growth too disappoints due to delay in a large order:
Execution of a
large stationary order worth INR350m (which was received in 4QFY18) was
deferred to 1QFY19, resulting in sluggish growth (2%) in Stationary in 4Q, which
is a seasonally strong quarter for the segment. Going forward, management
expects high growth in the high-margin exports business, while the domestic
business is expected to continue witnessing competitive pressures.
Policy change brings uncertainty, but no impact seen on margins:
(1)
The
Balbharti Board, which publishes textbooks for the state board of Maharashtra,
has issued an advertisement/information in newspapers that all publishers in
Maharashtra (including coaching classes) will have to procure a license before
publishing any title.
(2)
The publishers association is awaiting the draft policy, as
a result of which none of the publishers have released any supplementary books
for standard X (a key revenue driver). A few standard X textbooks, though, have
been released, while no textbooks for standards 1
st
and 8
th
are released yet.
(3)
Maharashtra Board syllabus change (which is due for standards 1
st
, 8
th
and 10
th
)
was expected to boost revenues by more than 50%; however, the policy change
has now introduced an element of uncertainty over this.
(4)
We note that the
corresponding increase in cost in the form of license fee will be passed on to
consumers and, thus, will not have any impact on margins.
Estimate change
TP change
Rating change
25 May 2018
14
 Motilal Oswal Financial Services
Britannica in transition; one-time expense drags FY18 margins:
Britannica
previously had a single series offering of each title it sold. However, it now plans to
introduce another series in each title in order to increase the addressable market.
Both the offerings will be targeted toward separate grade of schools, thereby
expanding the target market. We expect the new series introduction to drive 55%
growth in revenues to INR860m in FY19. We note that revenues declined 12% YoY to
INR560m in FY18 due to an unforeseen event – key employees of Britannica left the
organization, leading to a temporary dip in revenues, and one-time expense of
INR90m was incurred toward employee compensation.
Valuation view:
Due to the lack of clarity on the final policy, the license fee charges
and the timeline to obtain the licenses, we cut our PAT estimates by 31%/36% for
FY19/20. We, however, see upside risk to our estimates from earlier-than-expected
declaration of the final policy and speedier license approval. We value the stock at
18x FY20E earnings of INR8.3/share and downgrade our rating to Neutral with a
revised target price of INR149/share.
Quarterly Performance (Standalone)
Y/E March
Net Sales
YoY Change (%)
Total Expenditure
EBITDA
Margins (%)
Depreciation
Interest
Other Income
PBT before EO expense
Extra-Ord expense
PBT
Tax
Rate (%)
Minority Interest & P/L of Asso. Cos.
Reported PAT
Adj PAT
YoY Change (%)
Margins (%)
E: MOSL Estimates
1Q
5,602
8.5
3,853
1,749
31.2
60
23
76
1,743
0
1,743
607
34.8
0
1,136
1,136
15.5
20.3
FY17
2Q
3Q
1,725
1,566
47.0
38.6
1,443
1,363
282
203
16.3
13.0
62
65
0
1
61
55
281
193
0
0
281
193
95
66
33.9
34.3
0
0
186
126
186
126
69.8
68.3
10.8
8.1
FY18
2Q
3Q
1,834
1,744
6.3
11.4
1,553
1,540
281
205
15.3
11.7
56
62
16
1
47
44
256
186
0
0
256
186
89
67
34.9
36.1
0
0
166
119
166
119
-10.5
-6.1
9.1
6.8
FY17
11,813
24.0
9,001
2,813
23.8
284
43
152
2,638
0
2,638
827
31.3
0
1,811
1,811
50.7
15.3
FY18
12,040
1.9
9,816
2,225
18.5
307
77
260
2,100
0
2,100
825
39.3
0
1,275
1,275
-29.6
10.6
4Q
2,098
11.9
1,819
279
13.3
64
11
40
244
0
244
75
30.8
0
169
169
80.1
8.0
1Q
5,652
0.9
4,028
1,624
28.7
53
26
123
1,668
0
1,668
572
34.3
0
1,097
1,097
-3.4
19.4
4Q
2,126
1.3
1,888
238
11.2
64
17
79
236
0
236
84
35.8
0
151
151
-10.3
7.1
25 May 2018
15
 Motilal Oswal Financial Services
RESULTS
FLASH
Kaveri Seeds
BSE SENSEX
34,663
S&P CNX
10,514
24 May 2018
Results Flash | Sector: Others
CMP: INR507
TP: INR664(31%)
Buy
Revenue below estimate; profitability improves YoY but misses estimate
Conference Call Details
Date:
25th May 2018
Time:
2:00pm IST
Dial-in details:
+91-22-6280 1141
Financials & Valuations (INR b)
2018
2019E
Y/E Mar
Sales
8.2
8.9
EBITDA
2.2
2.7
NP
2.1
2.7
Adj EPS (INR)
32.0
40.6
EPS Gr. (%)
67.8
26.8
BV/Sh (INR)
137.2
157.3
RoE (%)
22.0
27.5
RoCE (%)
23.7
29.2
Payout (%)
56.3
50.3
Valuations
P/E (x)
15.8
12.5
P/BV (x)
3.7
3.2
EV/EBITDA (x)
15.7
12.5
Div Yield (%)
2.9
3.2
2020E
10.2
3.2
3.1
47.4
17.0
184.4
27.8
29.4
43.0
10.7
2.7
10.4
3.2
KSCL’s revenue grew 3.4% YoY to INR416m (est. of INR443m) in 4QFY18.
EBITDA stood at INR-133m (est. of INR-15m), as against INR-272m in 4QFY17.
Margin came in at -32.1% (est. -3.3%) v/s -67.5% in 4QFY17 on account of a
significant reduction of 4,712bp in RM cost to 62.8% of sales, offset by a rise of
1,215bp in employee cost to 28.1%.
Consequently, adjusted PAT stood at INR-184m (est. INR-26m) in 4QFY18 v/s
INR-306m in 4QFY17.
For FY18, revenue grew 16% YoY to INR8,192m, margin expanded 730bp to
27.1% and EBITDA grew 59% YoY to INR2,218m. Consequently, adj. PAT
increased 174% to INR2,114m.
Valuation view:
Based on our current estimates, at CMP of INR507, the stock
trades at 13x/11x P/E on FY19/FY20 EPS estimates. We have a Buy rating on the
stock.
25 May 2018
16
 Motilal Oswal Financial Services
Entertainment Network India
BSE SENSEX
34,663
Bloomberg
Equity Shares (m)
M.Cap.(INRb)/(USDb)
52-Week Range (INR)
1, 6, 12 Rel. Per (%)
Avg Val, INRm
Free float (%)
S&P CNX
10,514
ENIL IN
47.7
31.1 / 0.5
1008 / 630
-5/-19/-25
25.0
28.9
24 May 2018
4QFY18 Results Update | Sector: Media
CMP: INR664
TP: INR770(+16%)
Buy
Subdued quarter; New stations to fuel growth
Revenue continues to disappoint:
Standalone revenue declined 4% YoY (+8%
QoQ) to INR1,594m (2% miss). Yet, EBITDA of INR352m was flat YoY (-1% QoQ;
2% miss), as a steep 22% YoY fall in other expenses offset the impact of revenue
decline. EBITDA margin expanded 80bp YoY to 22.1% (10bp miss). PAT declined
15% YoY to INR117m (13% miss) due to one-offs in taxes. For FY18, revenue
declined 3% YoY to INR5,371m (1% miss), EBITDA declined 7% YoY to INR1,166m
(in-line) and adj. PAT declined 41% YoY to INR324m (5% miss).
Concall highlights:
1) Expect legacy stations to grow in mid-to-low double-
digits/single-high-digits, and new stations (Batch 1 – Phase III) to grow rapidly in
FY19. 2) Expect 7-10% yield improvement from 2HFY19, led by festive season
and a pick-up in economy. 3) New stations are expected to reach 35% EBITDA
margin by FY20 and contribute 20% of overall revenue. 4) Gross margin in the
non-FCT business is expected to be steady at 20-25%.
New stations to fuel growth:
Inventory capping in FY18 led to a steep 18%/10%
volume/revenue decline in legacy stations. We believe that it would take long
for ENIL to recoup the downfall, despite a 7-10% yield improvement (at legacy
stations, which constitute 80-85% of overall revenue), and thus, cut our overall
revenue/EBITDA estimate by 4% for FY19 and 9%/20% for FY20. We expect 18%
revenue CAGR over FY18-20, primarily led by higher utilization at new stations
(Phase III- Batch 1) and support from relatively small Phase III- Batch 2 stations
(post launch in FY19). The acquisition of (three) TV Today radio stations in FY19
should also support growth. We expect 33% EBITDA CAGR over FY18-20, driven
by higher contribution from new (Batch 1) stations (turned profitable in
3QFY18), partly offset by the launch of Batch 2 stations.
Valuation view:
At CMP, ENIL is valued at 14x FY20E EBITDA. Given the cut in our
estimates, we reduce our TP to INR770 (prior: INR820), ascribing 16x to FY20E
EBITDA. Maintain
Buy.
FY17
2Q
1,296
11.5
1,065
231
17.8
140
-22
114
0
114
35
30.5
79
79
-70.7
6.1
3Q
1,506
4.9
1,125
381
25.3
147
-4
239
0
239
76
31.7
163
163
-43.3
10.8
4Q
1,652
12.2
1,300
352
21.3
164
-1
188
0
188
50
26.7
138
138
-31.6
8.3
1Q
1,044
-5.8
877
167
16.0
156
-15
25
42
68
23
34.2
44
17
-89.9
1.6
FY18
2Q
1,257
-3.0
973
284
22.6
159
-9
134
0
134
74
55.5
60
60
-24.5
4.7
FY17
3Q
1,479
-1.8
1,123
356
24.1
161
-6
201
0
201
70
34.9
131
131
-19.8
8.8
4Q
1,594
-3.5
1,242
352
22.1
158
-19
213
0
213
96
45.0
117
117
-15.2
7.3
5,562
9.4
4,304
1,259
22.6
536
-60
783
0
783
238
30.4
545
545
-46.5
9.8
FY18
5,371
-3.4
4,205
1,166
21.7
635
-41
573
42
615
263
42.8
352
324
-40.6
6.0
4Q
Est
FY18E Var (%)
1,618
-1.5
-2.2
1,259
-1.4
359
-2.0
22.2
-11bps
167
-5.1
-6
NM
199
7.1
0
199
7.1
64
32.0
135
-13.4
135
-13.4
-2.1
8.3
-101bps
Financials & Valuations (INR b)
2018 2019E
Y/E Mar
Net Sales
5.4
6.4
EBITDA
1.2
1.7
PAT
0.3
0.7
EPS (INR)
6.8
14.9
Gr. (%)
-40.6
119.5
BV/Sh (INR)
185.5
199.2
RoE (%)
3.7
7.7
RoCE (%)
3.1
6.6
P/E (x)
97.8
44.5
P/BV (x)
3.6
3.3
EV/EBITDA (x)
27.9
18.7
2020E
7.5
2.1
1.0
22.0
47.3
220.0
10.5
9.0
30.2
3.0
14.4
Estimate change
TP change
Rating change
Standalone quarterly performance (INR m)
Y/E March
Net Sales
YoY Change (%)
Total Expenditure
EBITDA
Margins (%)
Depreciation
Net Interest cost
PBT before EO expense
Extra-Ord expense
PBT
Tax
Rate (%)
Reported PAT
Adj PAT
YoY Change (%)
Margins (%)
1Q
1,107
9.0
813
294
26.6
85
-33
243
0
243
78
32.0
165
165
-36.3
14.9
25 May 2018
17
 Motilal Oswal Financial Services
24 May 2018
4QFY18 Results Update | Sector: Healthcare
Granules India
BSE SENSEX
34,663
Bloomberg
Equity Shares (m)
M.Cap.(INRb)/(USDb)
52-Week Range (INR)
1, 6, 12 Rel. Per (%)
Avg Val, INRm
Free float (%)
S&P CNX
10,514
GRAN IN
229
32.5 / 0.5
…but one-off expenses and higher RM cost impact margin
151 / 81
Strong 4Q:
GRAN’s 4QFY18 sales rose significantly by ~39% YoY to INR5b
-25/-36/-53
(est. of INR4.1b). Gross margin shrank to 38.5% from 57% in 4QFY17 and
269.0
49.1% in 3QFY18, primarily due to higher RM prices, one-time write-off
55.1
CMP: INR83
TP: INR130(+57%)
Buy
Revenues exceed estimate…
Financials & Valuations (INR b)
2018 2019E
Y/E Mar
Net Sales
17.0
20.2
EBITDA
2.8
3.8
PAT
1.4
1.7
EPS (INR)
5.7
6.7
Gr. (%)
-21.8
17.8
BV/Sh (INR)
51.4
55.4
RoE (%)
12.2
12.5
RoCE (%)
11.3
11.9
P/E (x)
14.7
12.4
P/BV (x)
1.6
1.5
2020E
24.3
4.6
2.2
8.7
30.8
60.2
15.1
13.8
9.5
1.4
Estimate change
TP change
Rating change
related to obsolete inventory, and product mix change. EBITDA fell ~44%
YoY to INR436m (est. of INR760m), with the margin down ~1,300bp YoY to
8.7% due to certain write-offs. Weak operating performance led to a decline
in PAT by ~55% YoY to INR204m (est. of INR391m). For FY18, sales, EBITDA
and PAT stood at INR16.9b (~18%), INR2.8b (-7%) and INR1.4b (-18%),
respectively.
Margin improvement is key:
Margin was impacted by INR120m write-off
related to obsolete inventory and INR240m related to R&D write-off. GRAN
expects margin to normalize going forward due to passing on of RM price
increase to customers, absence of one-offs and ramp-up of Methergine
sales. GRAN also expects to launch 7-8 products in the US market in FY19. It
filed 7-8 ANDAs in FY18, with 2-3 complex filings.
Con-call takeaways:
1) Construction of Oncology facility is on track and is
expected to be completed by 2HFY19. 2) GRAN has a total of 23 products in
the pipeline, of which 60% are limited-competition products. It plans to file
~10 ANDAs in FY19. 3) GRAN has guided for mid-to-high teens growth for
FY19 and expects EBITDA margin of 18-20%. 4) Debt is expected to come
down by INR200m in FY19 and by EUR6m in FY20. 6) PAT contribution by
Omnichem is expected to retreat to FY17 levels in FY19.
Negatives already factored in:
We believe that the capex cycle for GRAN is
nearing an end. Margin contraction in 4Q was a key negative surprise;
however, management expects a recovery in coming quarters led by ramp-
up of new capacity utilization, passing on of high RM cost and key launches
in the US. We expect EBITDA and PAT to grow at >25% CAGR over FY18-20.
We cut our target multiple to 15x (from 18x) and reduce FY19/20E EPS by
~16/21% due to slower margin recovery and slower ramp-up in US sales.
Maintain
Buy
with TP of INR130 @ 15x FY20E (v/s INR175 @ 18x 1HFY20E).
25 May 2018
18
 Motilal Oswal Financial Services
March 2018 Results Preview | Sector: Financials
Bank of Baroda
Bloomberg
Equity Shares (m)
M. Cap. (INR b)/(USD b)
52-Week Range (INR)
1,6,12 Rel Perf. (%)
BOB IN
2646.4
384 / 6
207 / 128
7 / 0 / -27
CMP: INR145
TP: INR185 (+28%)
Buy
Financial Snapshot (INR B)
Y/E March
2017 2018E 2019E 2020E
NII
OP
NP
NIM (%)
EPS (INR)
EPS Gr. (%)
BV/Sh. (INR)
ABV/Sh. (INR)
RoE (%)
RoA (%)
Div. Payout (%)
Valuations
P/E(X)
P/BV (X)
P/ABV (X)
Div. Yield (%)
135.1
109.8
13.8
2.2
6.0
NA
151.6
111.9
4.0
0.2
27.9
24.2
1.0
1.3
1.0
161.7
129.5
8.4
2.4
3.4
-43.1
161.2
113.0
2.0
0.1
31.9
42.5
0.9
1.3
0.7
175.8
141.5
23.6
2.5
8.9
161.5
167.3
124.2
5.0
0.3
31.2
16.3
0.9
1.2
1.9
195.3
161.3
41.4
2.5
15.7
75.6
180.2
143.4
8.4
0.5
17.8
9.3
0.8
1.0
1.9
After an uptick in loan growth in 3Q, 4QFY18 should register ~11%
YoY loan growth (+6% QoQ). Balance sheet recalibration will
continue, led by focus on granular retail loans. We expect drill-
down in the international book to continue. We expect deposits
to decline ~2% YoY (but grow 2% QoQ).
We expect margins to improve to ~2.9%, as interest income
reversals continue to moderate.
We expect slippages to remain elevated (6.7% annualized). We
expect absolute GNPAs to increase 6% QoQ to ~INR514b.
Fee income growth is expected to pick up, but non-interest
income is expected to decline 27% YoY, as the base period had
one-off treasury gains from demonetization-related inflows.
PAT is expected to be at INR1.7b v/s INR1.1b in 3QFY18, with
increase in credit costs. Return ratios would still remain sub-
optimal. The stock trades at 0.9x FY19E BV and 16.3x FY19E EPS.
Buy.
Key issues to watch for
Stress addition, mainly from the international book.
Guidance on loan growth, margins and operating expenses
.
(INR Million)
FY17
FY18E
4QE
46,494
39.7
14,376
60,871
24,760
36,111
30.5
33,579
2,531
788
1,743
-276.3
40.7
93.0
5,866
4,235
547
12.0
238.5
5.4
55.8
1,35,134
6.1
67,581
2,02,715
92,964
1,09,751
24.5
85,024
24,727
10,896
13,831
NA
45.9
77.5
6,017
3,833
427
10.5
180.8
4.7
66.8
1,61,689
19.7
63,989
2,25,678
96,167
1,29,511
18.0
1,14,818
14,693
6,244
8,448
-38.9
42.6
88.7
5,866
4,235
547
12.0
238.5
5.4
55.8
Quarterly Performance
1Q
33,711
-2.6
14,444
48,155
21,460
26,695
21.2
20,041
6,654
2,418
4,236
-59.7
44.6
75.1
5,622
3,628
430
11.2
207.8
5.7
60.2
FY17
2Q
3Q
34,261 31,344
5.6
15.9
15,614 17,750
49,875 49,093
22,973 23,141
26,902 25,952
15.1
52.3
17,958 20,795
8,944
5,157
3,422
2,630
5,521
2,527
343.5
NA
46.1
47.1
66.8
80.1
5,675
3,541
429
11.4
193.4
5.5
63.0
5,899
3,500
426
11.4
190.1
5.4
64.5
4Q
33,283
-0.1
19,773
53,056
25,390
27,666
7.5
26,230
1,436
2,425
-989
NA
47.9
94.8
6,017
3,833
427
10.5
180.8
4.7
66.8
1Q
34,050
1.0
15,512
49,561
23,080
26,481
-0.8
23,681
2,801
767
2,034
-52.0
46.6
89.4
5,706
3,776
462
11.4
195.2
5.2
66.3
FY18E
2Q
3Q
37,205 43,940
8.6
40.2
17,371 16,730
54,576 60,671
24,158 24,170
30,418 36,501
13.1
40.6
23,294 34,265
7,125
2,236
3,571
1,118
3,554
1,118
-35.6
-55.8
44.3
39.8
76.6
93.9
5,832
3,873
463
11.2
195.7
5.1
67.2
5,733
3,994
485
11.3
198.5
5.0
68.0
Net Interest Income
% Change (YoY)
Other Income
Total Income
Operating Expenses
Operating Profit
% Change (YoY)
Provisions
Profit before Tax
Tax
Net Profit
% Change (YoY)
Cost/Income Ratio (%)
Provisions/Operating Profits (%)
Operating Parameters
Deposit (INR b)
Loan (INR b)
Asset Quality
Gross NPA (INR B)
Gross NPA (%)
Net NPA (INR B)
Net NPA (%)
PCR (%)
E: MOSL Estimates
25 May 2018
19
 Motilal Oswal Financial Services
March 2018 Results Preview | Sector: Healthcare
Cadila Healthcare
Bloomberg
Equity Shares (m)
M. Cap. (INR b)/(USD b)
52-Week Range (INR)
1,6,12 Rel Perf. (%)
CDH IN
1023.7
403 / 6
558 / 361
-1 / -23 / -23
CMP: INR394
TP:INR555 (+41%)
Buy
Financial Snapshot (INR Billion)
y/e march
2017 2018E 2019E 2020E
Sales
EBITDA
NP
EPS (INR)
EPS Gro. (%)
BV/Sh. (INR)
RoE (%)
RoCE (%)
Valuations
P/E (x)
P/BV (x)
EV/EBITDA (x)
27.7
5.8
22.9
24.6
4.9
15.8
19.6
4.1
12.8
16.9
3.4
11.0
94.3
19.0
14.5
14.2
-7.9
68.0
23.0
15.2
117.6
27.1
16.4
16.0
12.7
80.1
21.6
13.8
131.8
32.6
20.6
20.1
25.5
96.3
22.8
15.6
150.7
37.7
23.8
23.3
15.9
115.7
22.0
16.6
Cadila Healthcare's (CDH) 4QFY18 revenue is likely to grow
significantly by 24% YoY to INR30.7b, driven by strong growth in
the US formulations business (up ~44% YoY to INR14.2b) on the
back of launch of gLialda and ramp-up of other key products.
Overall export formulations are expected to grow ~46% YoY to
INR18.3b, while domestic formulation is likely to grow 10% YoY to
INR9.3b.
We expect EBITDA to significantly increase by 57% YoY to INR7.3b
and margin to expand ~500bp. Adj. PAT is also likely to increase
~95% YoY to INR5.5b on the back of significant margin expansion.
We believe CDH has made investments in the right areas, and will
start accruing benefits over next 2-3 years. We expect strong EPS
growth from FY17-19E (29% CAGR) on the back of Moraiya
resolution and strong launch pipeline in US, with better return
ratios over next two years.
Strong launch momentum and limited-competition launches (like
Lialda) should drive strong margin improvement (FY19E EBITDA
margin to be ~25%). Maintain Buy with a TP of INR555 @22x
1HFY20E PER.
Key issues to watch out
Outlook for FY19E.
Update on US business post increased competition in gLialda
and Tamiflu.
Quarterly Performance
Y/E March
Net Revenues
YoY Change (%)
EBITDA
Margins (%)
Depreciation
Interest
Other Income
PBQ before EO Income
EO Exp/(Inc)
PBQ after EO Income
Tax
Rate (%)
Min. Int/Adj on Consol
Adj PAT
YoY Change (%)
Margins (%)
1Q
22,871
-1.2
5,239
22.9
843
140
153
4,409
2
4,407
966
21.9
-121
3,564
-13.0
15.6
FY17
2Q
3Q
23,531 23,111
1.0
-4.8
5,160
4,043
21.9
17.5
864
898
187
66
236
166
4,345
3,245
0
0
4,345
3,245
1,068
504
24.6
15.5
-99
-76
3,376
2,817
-26.5
-27.8
14.3
12.2
4Q
24,782
1.2
4,636
18.7
1,145
99
731
4,123
0
4,123
19
0.5
249
3,855
-0.7
15.6
1Q
21,973
-3.9
2,773
12.6
1,220
219
210
1,544
0
1,544
293
19.0
133
1,384
-61.2
6.3
FY18E
2Q
3Q
32,340
32,596
37.4
41.0
8,571
8,412
26.5
25.8
1,267
1,473
406
135
225
411
7,123
7,215
0
0
7,123
7,215
2,123
1,786
29.8
24.8
33
4
5,033
5,433
49.1
92.9
15.6
16.7
4QE
30,715
23.9
7,297
23.8
1,399
254
183
5,828
0
5,828
791
13.6
-82
4,954
28.5
16.1
(INR Million)
FY17
94,295
-1.0
19,036
20.2
3,750
450
1,286
16,122
0
16,122
1,289
8.0
47
14,880
3.7
15.8
FY18E
117,624
24.7
27,053
23.0
5,359
1,014
1,029
21,710
0
21,710
4,993
23.0
88
16,804
12.9
14.3
25 May 2018
20
 Motilal Oswal Financial Services
March 2018 Results Preview | Sector: Capital Goods
Engineers India
Bloomberg
Equity Shares (m)
M. Cap. (INR b)/(USD b)
52-Week Range (INR)
1,6,12 Rel Perf. (%)
ENGR IN
673.9
110 / 2
206 / 141
-3 / 5 / 2
CMP: INR164
TP: INR200 (+22%)
Buy
Financial Snapshot (INR b)
Y/E March
2017 2018E 2019E 2020E
Net Sales
14.5 18.0 23.8 28.3
EBITDA
Adj. PAT
EPS (INR)
EPS Gr. (%)
BV/Sh. (INR)
RoE (%)
RoCE (%)
Payout (%)
Valuations
P/E (x)
P/BV (x)
EV/EBITDA (x)
Div Yield (%)
37.6
3.9
28.0
0.9
25.4
3.6
16.4
1.6
23.3
3.4
14.7
1.7
19.4
3.1
11.5
2.1
3.0
2.9
4.3
3.8
41.2
10.4
10.4
46.4
4.6
4.0
6.3
48.1
44.0
13.9
13.9
46.4
5.0
4.3
6.9
9.2
47.5
14.1
14.1
46.4
6.1
5.2
8.2
19.8
51.7
15.6
15.6
46.4
We expect revenue to increase 18% YoY, supported by growth in
turnkey segment execution (24% YoY) and expect consultancy and
engineering projects to register 16% growth.
Despite strong revenue growth, we expect operating profit to
decline 26% YoY, as consultancy and engineering projects segment
as well as turnkey project segment included provision write-back of
INR570m in 4QFY17, leading to margin expansion in both
segments. We expect margins to normalize in 4QFY18.
We expect net profit to decline 43% YoY to INR890m, led by
normalized tax rate assumed for 4QFY18 (34% as against 19% in
4QFY17). Maintain
Buy.
Key issues to watch
Performance of the turnkey project segment, which has seen margin
volatility in the recent past.
Standalone - Quarterly Earning Model
Y/E March
Net Sales
YoY Change (%)
EBITDA
Margins (%)
Depreciation
Interest
Other Income
PBT before EO expense
PBT
Tax
Rate (%)
Reported PAT
Adj PAT
YoY Change (%)
Margins (%)
1Q
3,419
-12.5
734
21.5
53
1
546
1,226
1,226
422
34.4
804
804
41.4
23.5
FY17
2Q
3,389
-24.6
937
27.7
53
0
561
1,446
1,815
508
28.0
1,308
1,042
34.8
30.7
3Q
3,250
-11.8
809
24.9
59
-1
559
1,309
1,309
458
35.0
851
851
37.1
26.2
4Q
4,429
46.8
1,443
32.6
60
30
571
1,924
1,024
363
35.5
660
1,241
59.5
28.0
1Q
3,754
9.8
818
21.8
60
0
456
1,214
1,214
400
32.9
815
815
1.4
21.7
FY18
2Q
4,291
26.6
1,390
32.4
62
1
467
1,794
1,794
602
33.6
1,192
1,192
14.4
27.8
FY17
3Q
4,734
45.7
1,349
28.5
59
1
393
1,682
1,682
597
35.5
1,084
1,084
27.4
22.9
4QE
5,221
17.9
1,069
20.5
75
3
350
1,341
1,341
452
33.7
890
890
-28.3
17.0
14,486
-4.1
3,022
20.9
225
32
2,237
5,002
4,102
1,752
42.7
2,351
2,866
3.8
19.8
FY18E
18,000
24.3
4,625
25.7
255
5
1,666
6,031
6,031
2,050
34.0
3,980
3,980
38.9
22.1
25 May 2018
21
 Motilal Oswal Financial Services
March 2018 Results Preview | Sector: Cement
India Cements
Bloomberg
Equity Shares (m)
M. Cap. (INR b)/(USD b)
52-Week Range (INR)
1,6,12 Rel Perf. (%)
ICEM IN
308.2
47 / 1
226 / 136
0 / -22 / -18
CMP: INR153
TP: INR148 (-3%)
Neutral
Financial Snapshot (INR Billion)
Y/E March
2017 2018E 2019E 2020E
Sales
50.8 51.5 57.8 65.5
EBITDA
8.6
7.1
8.9 10.3
NP
1.7
0.9
2.0
2.9
Adj. EPS (INR)
5.6
2.9
6.6
9.4
EPS Gr. (%)
31.3 -48.5 129.3 41.8
BV/Sh (INR)
165.8 167.6 173.0 181.3
RoE (%)
3.4
1.7
3.9
5.3
RoCE (%)
5.1
4.4
5.5
6.6
Payout (%)
20.7 40.1 17.5 12.3
Valuations
P/E (x)
27.2 52.9 23.0 16.3
P/BV (x)
0.9
0.9
0.9
0.8
EV/EBITDA(x)
8.9 10.8
8.5
7.1
EV/Ton (USD)
72
72
71
69
India Cements’ volumes are expected increase by 9% YoY to 3.16mt
in 4QFY18 due to healthy demand from the southern region. We
expect realizations to decrease by 2% QoQ to INR4,365/ton due to
weak prices in the underlying markets of the South. We estimate
revenue at INR13.7b (+3% YoY).
EBITDA is estimated at INR1.8b. EBITDA margin is likely to contract
1.3pp YoY and 0.9pp QoQ to 12.8%, translating into blended
EBITDA/ton of INR560 (-INR53 QoQ and –INR 95YoY) led by
decrease in realization. PAT is expected to be INR238m in
4QFY18(v/s INR343m in 4QFY17).
The stock trades at a P/E of 23x (FY19E) and 16.3x (FY20E),
EV/EBITDA of 8.5x (FY19E) and 7.1x (FY20E), and EV/ton of USD71
(FY19E) and USD69 (FY20E). Maintain Neutral.
Key issues to watch out for
Visibility on demand recovery in the South.
Demand, especially in Tamil Nadu, after resolution of sand mining
ban.
Pricing outlook in South India.
Quarterly Performance (Standalone)
Y/E March
Sales Dispatches (m ton)
YoY Change (%)
Realization (INR/ton)
YoY Change (%)
QoQ Change (%)
Net Sales
YoY Change (%)
EBITDA
Margins (%)
Depreciation
Interest
Other Income
PBT before EO expense
Extra-Ord expense
PBT
Tax
Rate (%)
Reported PAT
Adj PAT
YoY Change (%)
Margins (%)
E: MOSL Estimates
1Q
2.31
10
5,173
2.5
10.7
12,025
11.9
2,014
16.7
511
825
32
710
0
710
271
38.1
440
440
-9.4
3.7
FY17
2Q
3Q
2.46
2.65
14
37
5,259
4,784
-5.6
-11.6
1.7
-9.0
13,075 12,679
6.7
19.8
2,244
1,886
17.2
14.9
521
516
876
858
69
31
917
542
0
0
917
542
293
189
31.9
34.8
624
353
624
353
53.9 1,018.4
4.8
2.8
4Q
2.90
19
4,633
-0.9
-3.2
13,436
17.1
1,900
14.1
639
820
17
458
0
458
115
25.1
343
343
-19.6
2.6
1Q
2.66
15
4,857
-6.1
4.8
12,901
7.3
1,856
14.4
630
874
52
404
0
404
140
34.6
264
264
-39.9
2.0
FY18
2Q
3Q
2.70
2.73
10
3
4,696
4,450
-10.7
-7.0
-3.3
-5.2
12,683
12,131
-3.0
-4.3
1,814
1,673
14.3
13.8
632
633
886
924
66
37
362
152
0
0
362
152
125
0
34.6
0.0
237
152
237
152
-62.1
-56.9
1.9
1.3
4QE
3.16
9
4,365
-5.8
-1.9
13,784
2.6
1,770
12.8
622
919
41
271
0
271
32
11.9
238
238
-30.4
1.7
(INR Million)
FY17
FY18E
11.00
27.3
4,589
-16.7
50,795
5.6
8,610
17.0
2,571
3,605
165
2,600
2,600
867
33.3
1,734
1,734
31.3
3.4
11.24
2.2
4,553
-0.8
51,498
1.4
7,113
13.8
2,517
3,602
196
1,189
1,189
297
25.0
892
892
-48.5
1.7
25 May 2018
22
 Motilal Oswal Financial Services
March 2018 Results Preview | Sector: Media
Jagran Prakashan
Bloomberg
Equity Shares (m)
M. Cap. (INR b)/(USD b)
52-Week Range (INR)
1,6,12 Rel Perf. (%)
JAGP IN
326.9
56 / 1
209 / 156
5 / -10 / -19
CMP: INR172
TP: INR215 (+25%)
Buy
Financial Snapshot (INR Billion)
Y/E MARCH
2017 2018E 2019E 2020E
Net Sales
EBITDA
Adj. Net Profit
Adj. EPS (INR)
Adj. EPS Gr. (%)
BV/Sh (INR)
RoE (%)
RoCE (%)
Div. Payout (%)
Valuations
P/E (x)
P/BV (x)
EV/EBITDA (x)
Div. Yield (%)
16.2
2.6
7.9
0.0
17.1
2.7
8.1
1.7
13.1
2.4
6.3
1.7
10.8
2.0
5.0
1.7
22.8
6.4
3.5
10.7
-11.5
65.9
18.4
15.9
0.0
23.3
5.9
3.1
10.1
-5.3
63.1
14.9
14.1
35.8
26.0
7.1
4.1
13.1
30.5
72.1
18.5
17.1
27.4
28.6
8.3
5.0
16.0
21.5
83.9
19.5
18.1
22.6
We expect advertising revenue to remain flat at INR3.3b on
account of high base in 4QFY17 (led by UP elections).
However, driven by an increase in the circulation copies, circulation
revenue is likely to grow 7% YoY to INR1.1b.
We estimate Radio revenue to grow 15% to INR0.8b and EBITDA to
grow 53% to INR0.3b.
Aggregate revenue is expected to grow 3% to INR5.8b.
Increase in newsprint cost is likely to impact EBITDA. We expect
EBITDA decline of 9% YoY to INR1.3b and EBITDA margin at 22.8%
(-280bp YoY). PAT is expected to fall 11% to INR0.7b.
The stock trades at 13.1x FY19E and 10.8x FY20E EPS. Maintain
Buy.
Key things to watch for
Ad revenue (we expect flat YoY growth).
EBITDA margin (we expect 22.8% margin).
Consolidated - Quarterly Earning Model
Y/E March
Total Revenue from Operations
YoY Change (%)
Total Expenditure
EBITDA
Margins (%)
Depreciation
Interest
Other Income
PBT before EO expense
Extra-Ord expense
PBT
Tax
Rate (%)
MI & P/L of Asso. Cos.
Reported PAT
Adj PAT
YoY Change (%)
Margins (%)
E: MOSL Estimates
1Q
5,644
17.3
4,086
1,558
27.6
302
102
93
1,248
0
1,248
407
32.6
3
838
838
-11.6
14.9
FY17
2Q
5,548
6.8
4,018
1,531
27.6
308
78
112
1,257
0
1,257
396
31.5
8
853
853
5.9
15.4
3Q
6,016
4.4
4,151
1,866
31.0
329
89
78
1,526
0
1,526
546
35.8
7
973
973
4.3
16.2
4Q
5,620
6.1
4,180
1,441
25.6
351
81
128
1,137
0
1,137
327
28.7
0
811
811
1.2
14.4
1Q
5,913
4.8
4,301
1,613
27.3
328
72
120
1,333
0
1,333
446
33.5
21
866
866
3.3
14.6
FY18
2Q
5,665
2.1
4,279
1,386
24.5
340
74
125
1,098
0
1,098
375
34.2
27
695
695
-18.5
12.3
FY17
3Q
5,981
-0.6
4,352
1,629
27.2
343
76
108
1,318
0
1,318
446
33.8
25
848
848
-12.9
14.2
4QE
5,775
2.8
4,457
1,318
22.8
330
79
130
1,040
0
1,040
313
30.2
0
726
726
-10.5
12.6
22,829
8.4
16,434
6,395
28.0
1,289
350
412
5,168
0
5,168
1,675
32.4
17
3,475
3,475
-2.4
15.2
(INR m)
FY18E
23,335
2.2
17,389
5,945
25.5
1,340
301
484
4,788
0
4,788
1,580
33.0
73
3,135
3,135
-9.8
13.4
25 May 2018
23
 Motilal Oswal Financial Services
March 2018 Results Preview | Consumer
Page Industries
Bloomberg
Equity Shares (m)
M. Cap. (INR b)/(USD b)
52-Week Range (INR)
1,6,12 Rel Perf. (%)
PAG IN
11.2
249 / 4
25779 / 13650
4 / 16 / 41
CMP: INR22,288 TP: INR27,490 (+23%)
Buy
We expect Page to report net sales of INR5.9b, up 19.7% YoY, led
by double digit volume growth. We note that volume growth in
men’s innerwear has a high base of 10.5%.
We expect EBITDA margin to grow by 140bp YoY to 20.9%. Thus,
EBITDA should grow by 28.3% YoY to INR1.2b.
Adj. PAT is likely to post 17.7% YoY growth to INR786m.
The stock trades at 53.6x/40.5x FY19E/20E EPS of
INR415.7/INR549.8; maintain Buy.
Financial Snapshot (INR b)
Y/E March
2017 2018E 2019E 2020E
Sales
EBITDA
Adj. PAT
Adj. EPS (INR)
EPS Gr. %
FCF to PAT
BV/Sh.INR
RoE (%)
RoCE (%)
Payout (%)
Valuations
P/E (x)
EV/EBITDA (x)
21.3
4.1
2.7
15.0
0.7
40.0
40.4
43.7
93.4
60.2
25.4
5.2
3.3
24.5
1.0
39.9
41.4
50.0
75.0
47.6
32.3
7.1
4.6
39.9
0.5
44.6
47.5
55.0
53.6
34.7
41.1
9.3
6.1
32.2
0.8
47.7
51.7
60.0
40.5
26.5
238.7 297.1 415.7 549.8
596.9 745.5 932.5 1152.5
Key issues to watch for
Performance of kidswear.
Competitive intensity.
Minimum wage hike in Karnataka for textile industry.
Quarterly Performance
Y/E MARCH
Net Sales
YoY Change (%)
COGS
Gross Profit
Gross margin (%)
Other Expenditure
EBITDA
Margins (%)
YoY Change
Depreciation
Interest
Other Income
PBT
Tax
Rate (%)
PAT
YoY Change (%)
E: MOSL Estimates
27%
1Q
5,686
26.7
2,570
3,116
54.8
2,024
1,092
19.2
8.8
59
39
59
1,053
373
35.5
679
8.5
25%
FY17
2Q
5,344
14.6
2,156
3,188
59.7
2,113
1,075
20.1
6.3
60
40
62
1,037
350
33.8
687
14.0
25%
3Q
5,283
19.2
2,131
3,151
59.7
2,160
991
18.8
19.6
62
45
20
904
275
30.4
629
20.9
23%
4Q
4,989
12.8
1,766
3,223
64.6
2,249
974
19.5
5.3
65
56
103
955
287
30.1
668
17.9
1Q
6,962
22.5
3,187
3,775
54.2
2,410
1,365
19.6
25.0
67
45
40
1,294
441
34.1
853
25.5
FY18
2Q
6,257
17.1
2,651
3,606
57.6
2,321
1,284
20.5
19.5
68
36
49
1,229
389
31.6
841
22.4
FY17
3Q
6,210
17.6
2,760
3,450
55.6
2,162
1,289
20.8
30.0
70
41
53
1,231
397
32.2
834
32.6
4QE
5,974
19.7
2,452
3,521
59.0
2,271
1,250
20.9
28.3
76
43
61
1,192
406
34.0
786
17.7
21,301
18.3
8,623
12,678
59.5
8,546
4,132
19.4
9.7
247
180
243
3,948
1,285
32.6
2,663
15.0
FY18E
25,403
19.3
11,050
14,353
56.5
9,165
5,188
20.4
25.6
280
165
203
4,946
1,632
33.0
3,314
24.4
25 May 2018
24
 Motilal Oswal Financial Services
March 2018 Results Preview | Sector: Retail
PC Jeweller
Bloomberg
Equity Shares (m)
M. Cap. (INR b)/(USD b)
52-Week Range (INR)
1,6,12 Rel Perf. (%)
PCJL IN
394.2
123 / 2
601 / 195
-4 / -17 / 38
CMP: INR313
TP: INR520 (+66%)
Buy
We expect PCJ’s revenue to grow by 15% YoY in 4QFY18 to
INR24.8b, led by strong SSSG in the domestic business.
Store additions are likely to be lower this quarter than earlier
expectations.
Gross margins are likely to expand 150bp YoY to 13.7%.
We expect EBITDA margin to expand by 170bp YoY to 9.9%, and
EBITDA to grow by 38.9% YoY to INR2.5b.
We estimate adj. PAT to grow by 49.2% to INR1.6b.
The stock trades at 16x/12.6x FY19E/20E EPS of INR19.5/INR24.9.
Maintain Buy.
Financial Snapshot (INR b)
Y/E March
FY17 FY18E FY19E FY20E
Sales
84.8 103.6 124.1 149.9
EBITDA
7.6 10.4 12.7 15.5
NP
4.2
6.1
7.7
9.8
EPS (Rs)
10.7 15.4 19.5 24.9
EPS Growth (%)
5.7 44.4 26.6 27.6
BV/Share (Rs)
85.0 98.0 113.9 134.0
RoE (%)
14.6 16.9 18.4 20.1
RoCE (%)
16.9 17.8 18.8 20.2
Valuation
P/E (x)
29.3 20.3 16.0 12.6
P/BV (x)
3.7
3.2
2.7
2.3
EV/EBITDA (x)
15.6 11.6
9.3
7.5
EV/Sales (x)
1.4
1.2
0.9
0.8
Key issues to watch for:
Pace of shift from unorganized to organized.
Outlook and same-store sales growth guidance.
Standalone - Quarterly Earning Model
Y/E March
Sales
YoY Change (%)
Gross Profit
Margins (%)
Total Expenditure
EBITDA
YoY Change (%)
Margins (%)
Depreciation
Interest
Other Income
PBT
Tax
Rate (%)
Adj PAT
YoY Change (%)
Margins (%)
E: MOSL Estimates
1Q
16,645
10.2
2,658
16.0
14,588
2,057
22.0
12.4
50
636
101
1,472
406
27.6
1,066
31.2
6.4
FY17
2Q
21,746
30.2
2,419
11.1
19,959
1,787
-8.9
8.2
55
710
504
1,527
457
30.0
1,069
16.3
4.9
3Q
21,074
-3.4
2,601
12.3
19,307
1,767
-20.6
8.4
56
699
139
1,150
81
7.0
1,070
-27.4
5.1
4Q
21,581
15.3
2,644
12.3
19,813
1,769
6.7
8.2
59
702
508
1,515
415
27.4
1,101
39.7
5.1
1Q
21,185
27.3
3,060
14.4
18,853
2,332
13.4
11.0
49
596
215
1,901
543
28.6
1,358
27.4
6.4
FY18
2Q
26,223
20.6
3,497
13.3
23,438
2,785
55.9
10.6
49
764
207
2,178
672
30.9
1,506
40.8
5.7
3Q
26,449
25.5
3,695
14.0
23,760
2,689
52.2
10.2
53
816
455
2,276
649
28.5
1,627
52.1
6.2
4QE
24,818
15.0
3,412
13.7
22,363
2,456
38.9
9.9
60
500
450
2,346
704
30.0
1,642
49.2
6.6
FY17
81,046
12.1
10,322
12.7
73,667
7,379
-2.0
9.1
220
2,747
1,252
5,664
1,359
24.0
4,305
7.8
5.3
FY18E
98,676
21.8
13,663
13.8
88,414
10,262
39.1
10.4
211
2,676
1,327
8,701
2,568
29.5
6,133
42.5
6.2
25 May 2018
25
 Motilal Oswal Financial Services
March 2018 Results Preview | Sector: Others
S H Kelkar
Bloomberg
Equity Shares (m)
M. Cap. (INR b)/(USD b)
52-Week Range (INR)
1,6,12 Rel Perf. (%)
SHKL IN
144.6
38 / 1
333 / 237
-8 / -4 / -25
CMP: INR260
TP: INR318 (+22%)
Buy
We expect revenue to grow 14% YoY to INR3,075m in 4QFY18, led
by a rebound in FMCG demand and available cross-selling
opportunities post CFF acquisition.
EBIDTA margin is likely to expand 480bp YoY to 18.5%, and EBIDTA
is likely to grow by 54% YoY to INR569m.
We estimate adj. PAT to grow 30% YoY to INR357m from INR274m.
Buy.
Financial Snapshot (INR Billion)
Y/E MARCH
2017 2018E 2019E 2020E
Net Sales
EBITDA
Adj. Net Profit
Adj. EPS (INR)
Adj. EPS Gr. (%)
BV/Sh (INR)
RoE (%)
RoCE (%)
Div. Payout (%)
Valuations
P/E (x)
P/BV (x)
EV/EBITDA (x)
Div. Yield (%)
37.9
4.9
24.0
0.6
34.8
4.5
20.5
0.6
28.4
4.0
17.3
0.8
22.5
3.6
13.6
1.1
10.6
1.7
1.0
7.2
43.5
56.1
13.7
19.0
28.9
10.6
1.9
1.1
7.9
9.1
61.4
13.4
19.8
28.9
12.3
2.3
1.4
9.7
22.4
68.3
14.9
21.8
28.9
14.1
2.9
1.8
12.2
26.6
77.0
16.9
24.8
28.9
Key things to watch for
Supply side issues with disruptions in Germany, US, China.
CFF acquisition – cross-selling opportunities.
Complete shift of ingredients from Netherlands to
manufacturing plants in India.
Quarterly Performance
Y/E March
Net Sales
YoY Change (%)
Total Expenditure
EBITDA
Margins (%)
Depreciation
Interest
Other Income
PBT before EO expense
Extra-Ord expense
PBT
Tax
Rate (%)
Minority Interest & P/L of Asso. Cos.
Reported PAT
Adj PAT
YoY Change (%)
Margins (%)
E: MOSL Estimates
1Q
2,768
25.2
2,294
474
17.1
44
17
32
444
0
444
169
38.1
0
275
275
41.0
9.9
FY17
2Q
3Q
2,453
2,494
9.8
1.9
2,032
2,099
420
395
17.1
15.9
49
48
22
2
25
19
375
364
0
0
375
364
132
110
35.1
30.2
0
0
243
254
243
254
246.2
16.4
9.9
10.2
4Q
2,698
-6.5
2,328
370
13.7
53
10
40
346
0
346
71
20.7
0
274
274
12.5
10.2
1Q
2,529
-8.6
2,102
427
16.9
58
6
38
401
0
401
133
33.1
0
268
268
-2.5
10.6
FY18E
2Q
3Q
2,219
2,831
-9.5
13.5
1,865
2,255
355
576
16.0
20.3
57
58
11
7
12
7
298
517
0
101
298
416
110
144
36.8
34.7
0
0
189
272
189
338
-22.4
33.0
8.5
11.9
4QE
3,075
14.0
2,506
569
18.5
60
6
20
523
0
523
176
33.6
-10
357
357
30.2
11.6
(INR Million)
FY17
10,412
6.5
8,762
1,650
15.9
194
52
115
1,520
0
1,520
482
31.7
0
1,038
1,038
42.8
10.0
FY18E
10,655
2.3
8,729
1,926
18.1
234
30
76
1,739
101
1,638
563
34.3
-10
1,086
1,152
11.0
10.8
25 May 2018
26
 Motilal Oswal Financial Services
March 2018 Results Preview | Sector: Healthcare
Sun Pharma
Bloomberg
Equity Shares (m)
M. Cap. (INR b)/(USD b)
52-Week Range (INR)
1,6,12 Rel Perf. (%)
SUNP IN
2399.3
1224 / 19
701 / 433
-3 / -4 / -38
CMP: INR510
TP:INR675(+32%)
Buy
Financial Snapshot (INR Billion)
Y/E MARCH
2017 2018E 2019E 2020E
Sales
EBITDA
NP
EPS (INR)
EPS Gro. (%)
BV/Sh. (INR)
RoE (%)
RoCE (%)
Valuations
P/E (x)
P/BV (x)
EV/EBITDA
(x)
D.Yield (%)
19.5
3.3
13.1
0.7
38.7
3.3
21.3
1.2
23.7
3.0
14.2
1.2
18.4
2.7
10.9
1.2
302.6
87.8
69.6
28.9
48.0
152.3
18.1
19.0
259.9
52.6
26.6
11.0
-61.8
156.3
8.5
7.7
302.4
76.0
51.8
21.5
94.8
170.8
13.2
13.6
351.5
95.3
66.7
27.7
28.8
191.6
15.3
16.2
Sun Pharmaceuticals (SUNP) is likely to register decline in
revenues by ~4% YoY to INR65.8b, primarily on the back of a
decrease in US business by ~16% to INR21.4b.
India business is expected to grow ~6% YoY, while the Row and
API businesses are expected to grow 3% YoY and 7% YoY,
respectively.
SUNP’s EBITDA is expected to increase ~17% YoY to INR14.4b,
with margin expansion of ~380p to 21.9% primarily due to low
base in 4QFY17 on back of one time inventory write-off of
USD45m and weak US business revenues.
Although we expect increase in EBITDA, PAT is expected to
decline 30% YoY to INR8.5b due to lower other income coupled
with higher tax rate.
We expect the stock to remain under pressure in the near term
due to challenges related to growth and margins. We maintain
Buy rating with a TP of INR675, based on 24x FY20E.
Key issues to watch out
Update on resolution of USFDA warning letter and 483
observations on Halol.
Outlook for FY19E.
Launch of Tildrakizumab and other key products.
(INR Million)
Quarterly Performance
Y/E March
Net Revenues
YoY Change (%)
Total Expenditure
EBITDA
Margins (%)
Depreciation
Net Other Income
PBT before EO Exp
EO Exp/(Inc)
PBT
Tax
Rate (%)
PAT (pre Minority Interest)
Minority Interest
Reported PAT
One-off upsides
Adj Net Profit
YoY Change (%)
1Q
80,067
18.4
53,220
26,847
33.5
3,160
2,588
26,275
0
26,275
3,527
13.4
22,748
2,411
20,337
0
20,337
265.8
FY17
2Q
77,640
13.0
50,974
26,666
34.3
3,038
5,668
29,295
0
29,295
4,417
15.1
24,879
2,528
22,351
0
22,351
117.3
3Q
76,832
8.5
54,595
22,237
28.9
3,068
1,851
21,020
0
21,020
3,729
17.7
17,291
2,573
14,718
0
14,718
3.9
4Q
68,252
-10.6
55,895
12,357
18.1
3,382
4,913
13,888
0
13,888
443
3.2
13,445
1,208
12,237
0
12,237
-28.6
1Q
61,667
-23.0
51,131
10,535
17.1
3,466
847
7,916
9,505
-1,589
1,618
20.4
-3,207
1,042
-4,249
0
5,256
-120.9
FY18E
2Q
65,901
-15.1
52,747
13,153
20.0
3,587
1,577
11,144
0
11,144
1,114
10.0
10,030
908
9,121
0
9,121
-59.2
3Q
65,982
-14.1
51,999
13,984
21.2
3,393
889
11,479
0
11,479
7,487
65.2
3,992
338
3,654
-5,130
8,784
-75.2
4QE
65,821
-3.6
51,390
14,432
21.9
3,654
688
11,465
0
11,465
1,212
10.6
10,253
1,711
8,542
0
8,542
-30.2
FY17
302,642
7.1
214,892
87,751
29.0
12,648
15,376
90,479
0
90,479
12,116
13.4
78,363
8,719
69,644
0
69,644
28.9
FY18E
259,370
-14.3
207,267
52,104
20.1
14,100
3,500
41,504
0
41,504
11,431
27.5
30,073
4,000
26,073
0
26,073
-62.6
25 May 2018
27
 Motilal Oswal Financial Services
In conversation
1. TATA MOTORS : FIXED COSTS FOR JAGUAR LAND ROVER HAVE
TO BE BROUGHT DOWN; PB Balaji, CFO
The fixed costs for Jaguar Land Rover (JLR) production will have to be brought
down. Trying to get cost structure in place.
UK still remains a challenging market for JLR. At the same time China market
continues to do very well for company and rest of the world continues to do
pretty well too.
Company expects both growth and profitability to be better this year than last
financial year. JLR's EBITDA margin is expected to increase by 300 to 400 basis
points by the financial year 2020-21.
If one looks at the 3 year performance for JLR, while company did better on
most counts, the area where company lost out was operating leverage.
In the commercial vehicle business, really starting to put gaps between company
and competition. Passenger vehicle is beginning to sequentially improve its
contribution margins because better mixes are coming into the market. For
passenger vehicles, the vision is to be a very strong number three player which
is within the realm of achievability.
2. MOTHERSON SUMI : Sticking to original FY15 revenue
guidance; Vivek Chaand Sehgal, Chairman
Sticking to guidance of $18 billion topline by FY20. Have a very clear target
which was established in 2014-15 - topline at $18 billion by FY20 and return on
capital employed (ROCE) of 40% and company is absolutely on track for that.
In the last quarters report, had given a lot of new plants that are coming up and
they are all in the fructification stage at the moment. So, the start up costs and
all that kind of things will be little bit higher.
However, the car companies are also ramping up for higher numbers. So, there
is always that particular lag that comes in here and there. But company has
shown the highest ever quarterly revenues ever for the group at Rs 15,282
crore. Net profit is up by 24% and the order book is Rs 130,000 crore.
Will not accept orders which are not meeting threshold or the benchmark. Have
already hit a particular size and making good money over there. There is no
need to take orders just for the topline.
3. L&T INFOTECH : Seen broad based growth across verticals;
Sanjay Jalona, Managing Director and Chief Executive Officer
With the deals that company has closed and with investments that have made
in the growth of top 30, top 50 accounts and the new accounts, company is
optimistic of FY19.
The banking and financial services (BFS) vertical grew 23% and consumer
packaged goods (CPG), retail and pharma grew 30% year-on-year.
There has been a broad based growth in all the verticals.
No cyclical problem in insurance as such and it will pick up going forward.
With regards to BFS segment, optimistic of growth there on back of the large
deal last year of $120 million.
25 May 2018
28
 Motilal Oswal Financial Services
From the think tank
1. From market place to multi-brand, why India’s retail policies
must evolve
Much has been written about last week’s announcement of Walmart Inc.
purchasing India’s largest online retailer Flipkart for a hefty $16 billion. Yes, the
announcement is about the imminent future of retail, about consolidation and
omni-channel. It is also about Walmart taking its arch rival Amazon head-on in
what the former described as one of the world’s most attractive retail markets.
But that’s not all. It’s also about the company’s decade-long tumultuous journey
in India unfolding as it looks at selling directly to the consumer. It’s about India
being the global testbed for some of the world’s largest companies. It’s about
survival. To understand, let’s step back a bit. India’s foreign direct investment
(FDI) policy for retail differentiates between single brand, multi-brand, brick and
mortar and online, online marketplaces and wholesale cash and carry. Some of
these constructs were formed over a decade ago when modern retail was just
taking off. At that time, there were fears that India’s large traditional market could
be impacted by the entry of large foreign retailers. A decade on, traditional retail
channels still account for over 90% of the overall retail trade in India’s largest
sector of consumer packaged goods (CPG).
2. Why India must issue dollar and euro bonds
If you are a foreign investor investing in rupee-denominated government bonds,
you are primarily worried about two things. Will the government pay back in full
and what will the value then be of the rupees converted to your base currency?
That is, you are worried about intention and exchange rates. What you are not
worried about is capability—the government can always create new rupees.
Similarly, if you are investing in Indian sovereign debt denominated in the dollar,
the credit risk remains, but the currency risk goes away if the dollar is your base
currency. In theory, the capability risk is also there, but practically speaking, the
Indian government can almost always print rupees and buy dollars. Separating
the credit and currency risks explicitly can lead to an overall lower risk premium.
As it so happens, the Indian government does not have any outstanding foreign
currency-denominated direct debt. Also, the Indian government has never
defaulted on any of its debt.
3. India bearing the cost of ignoring rural distress
The agrarian economy continues to be plagued by falling output prices, declining
incomes and increased variation in agricultural production pointing to a situation
of uncertainty and vulnerability among most rural residents. This has created an
unprecedented demand deflation in rural areas with a decline in prices for most of
food items, including the ones that have seen stagnant production or decline in
production. The demand deflation is primarily a result of slow growth or
stagnation in farmer’s incomes but is also a result of decline in the incomes of
wage workers who are net consumers of food. Together, these two groups
account for two-third of all rural households. The data on rural wages is now
available up to January 2018 and these suggest a decline in real terms for both
agricultural as well as non-agricultural labourers.
25 May 2018
29
 Motilal Oswal Financial Services
4. Improving power procurement practices
In India there is a great concern over the retail tariffs being charged for
electricity, but ironically little attention is paid to the components contributing
to the overall costs. Power generation costs make up 70-80% of the cost of
supplying electricity, and power procurement practices have a significant effect
on that cost. Yet almost no attention is paid to how distribution companies
(discoms) procure power. Declining plant load factors (PLFs) of thermal power
plants are an indicator of surplus generating capacity in some states, which, in
turn, leads to additional fixed costs that must be paid ultimately by consumers.
While some may argue that surplus capacity is preferable to persistent
shortages, the shift from shortages to surpluses points to serious shortcomings
in the power procurement practices of discoms. Current practices focus on the
short-term, and, at best, on ensuring resource adequacy, or having sufficient
generation capacity to meet peak demand. But how resource adequacy is
achieved is also important; discoms must strive to have the right mix of
resources to ensure demand is met in the least-cost manner. Therefore, the
discourse needs to move to resource planning which focuses on more than just
resource adequacy.
International
5. North Korean action for us words?
Just days ago, the planned summit in Singapore between US President Donald
Trump and North Korean leader Kim Jong-un seemed to be hanging by a thread.
Talks are still on track, but the North Koreans have expressed second thoughts,
owing to statements from the Trump administration suggesting that the North
would be expected to denuclearize in exchange for the mere promise of
loosened sanctions. The North Koreans are also concerned about comments
made by Trump’s national security adviser, John Bolton, an old nemesis whom
the North – never lost for insulting words – once called “human scum.” In recent
weeks, Bolton has suggested that talks with North Korea could follow what he
calls the “Libya model” – a facile shorthand for a country that simply surrenders
its nuclear program for little in return. Contrary to Bolton’s cartoonish retelling,
former Libyan leader Muammar el-Qaddafi actually negotiated quietly with the
Europeans and the United States for years before surrendering his weapons in
2003, and he received security commitments and assistance in exchange.
25 May 2018
30
 Motilal Oswal Financial Services
Click excel icon
for detailed
valuation guide
Valuation snapshot
Company
Automobiles
Amara Raja
Ashok Ley.
Bajaj Auto
Bharat Forge
Bosch
CEAT
Eicher Mot.
Endurance Tech.
Escorts
Exide Ind
Hero Moto
M&M
Mahindra CIE
Maruti Suzuki
Motherson Sumi
Tata Motors
TVS Motor
Aggregate
Banks - Private
Axis Bank
DCB Bank
Equitas Hold.
Federal Bank
HDFC Bank
ICICI Bank
IDFC Bank
IndusInd
J&K Bank
Kotak Mah. Bk
RBL Bank
South Indian
Yes Bank
Aggregate
Banks - PSU
BOB
BOI
Canara
Indian Bk
PNB
SBI
Union Bk
Aggregate
NBFCs
Aditya Birla Cap
Bajaj Fin.
Capital First
Cholaman.Inv.&F
n
Dewan Hsg.
GRUH Fin.
HDFC
HDFC Stand. Life
Indiabulls Hsg
L&T Fin Holdings
Reco
Buy
Buy
Buy
Buy
Neutral
Buy
Buy
Buy
Neutral
Buy
Neutral
Buy
Buy
Buy
Buy
Buy
Neutral
CMP TP % Upside
EPS (INR)
EPS Gr. YoY (%)
P/E (x)
P/B (x)
ROE (%)
(INR) (INR) Downside FY18E FY19E FY20E FY18E FY19E FY20E FY18E FY19E FY18E FY19E FY18E FY19E
777
144
2737
644
17760
1300
29483
1251
890
244
3486
844
237
8410
302
289
542
952
181
3450
806
19291
1845
35572
1530
982
301
4052
914
274
10468
423
471
635
23
25
26
25
9
42
21
22
10
23
16
8
16
24
40
63
17
27.6
5.4
151.3
17.7
480.6
64.0
799.6
29.1
39.5
8.2
185.1
39.7
9.6
266.7
8.2
22.9
13.9
31.5
38.1
7.3
9.1
167.2 191.7
25.4
32.2
578.6 714.5
84.9 115.3
1,050.3 1,347.1
38.4
51.0
52.4
65.5
10.1
12.8
201.2 229.1
46.9
51.2
13.7
16.6
349.9 444.8
12.0
16.9
43.2
52.9
19.7
28.8
-1.5
23.9
7.3
37.9
1.6
-31.5
27.0
23.8
88.0
0.4
9.5
45.1
107.8
7.3
5.9
15.7
18.7
15.2
-92.8
13.8
-82.3
-1.3
19.4
-31.0
0.3
25.2
LP
21.3
27.3
-25.5
26.3
4.0
14.2
34.9
10.5
43.5
20.4
32.8
31.3
32.0
32.5
23.5
8.6
18.0
43.1
31.2
47.3
88.3
41.5
37.2
#####
22.4
710.5
21.3
16.9
68.7
7.2
37.9
13.5
24.5
46.1
77.8
31.7
44.7
20.8
25.6
14.7
27.1
23.5
35.8
28.3
32.9
25.0
26.1
13.9
9.3
20.5
27.1
41.0
22.5
46.1
22.8
84.1
17.9
58.1
42.4
19.3
35.2
19.2
25.8
43.6
23.6
33.6
38.8
32.3
33.1
28.1
26.8
18.1
36.5
37.0
20.3
36.9
43.0
22.5
29.8
18.8
21.2
24.7
31.5
37.0
12.6
38.9
25.1
480.9
22.9
167.9
17.4
29.3
28.2
13.3
31.1
5.8
39.2
32.7
13.1
17.9
31.5
40.7
NM
NM
11.7
NM
NM
NM
0.0
37.8
45.0
16.0
24.0
16.1
67.0
43.0
85.9
12.3
24.0
24.6
19.9
16.4
25.4
30.7
15.3
28.1
32.6
17.0
24.1
17.3
18.0
17.2
24.0
25.1
6.7
27.5
18.3
27.5
18.7
20.7
14.3
25.1
16.7
12.4
22.5
5.1
31.5
22.4
7.4
13.6
21.7
15.6
15.8
29.4
8.2
NM
14.2
NM
17.7
26.7
33.6
12.3
19.9
11.6
57.5
37.1
71.4
10.2
17.5
4.5
5.9
4.1
6.4
5.4
2.0
11.4
8.1
3.6
3.8
5.9
3.5
2.4
6.1
6.8
1.0
8.9
3.9
2.2
2.2
2.3
1.3
4.8
1.8
0.9
4.8
0.5
4.8
3.1
0.9
3.0
3.2
0.9
0.5
0.6
0.9
0.6
1.1
0.4
0.8
3.6
7.4
2.1
4.5
2.2
19.7
4.8
3.1
3.7
2.6
3.9
5.0
3.7
5.4
4.9
1.8
8.6
6.8
3.0
3.5
5.3
3.1
2.1
5.2
5.7
0.9
7.2
3.4
1.9
2.0
2.1
1.2
3.8
1.7
0.8
4.1
0.5
4.4
2.9
0.8
2.5
2.7
0.8
0.5
0.6
0.8
0.6
1.1
0.4
0.8
2.8
6.2
1.8
3.8
1.9
16.3
4.2
2.6
3.1
2.3
17.0
23.7
24.2
18.8
15.6
10.3
35.2
21.0
18.3
12.9
33.8
14.6
10.4
18.5
19.5
10.1
25.1
15.4
0.5
10.9
1.4
8.3
17.9
6.7
6.8
16.5
9.1
10.9
11.6
6.6
17.7
10.2
17.1
27.1
24.0
23.2
16.8
12.5
35.0
22.6
19.3
14.4
32.1
14.8
13.1
21.4
24.8
14.2
29.0
18.3
7.4
11.1
10.7
9.0
16.9
10.8
6.9
19.6
9.9
12.0
13.3
11.0
19.9
12.6
Buy
Neutral
Buy
Buy
Buy
Buy
Neutral
Buy
Buy
Buy
Buy
Buy
Buy
534 600
182 198
155 185
83
127
1986 2400
297 380
40
65
1871 2150
51
100
1276 1400
495 650
24
34
331 444
12
9
19
54
21
28
62
15
97
10
31
40
34
1.1
8.0
0.9
4.8
67.8
10.6
3.0
60.2
8.8
32.5
15.1
1.9
18.4
19.4
9.7
7.5
5.8
79.3
17.8
3.2
83.0
10.0
40.5
22.1
3.3
24.3
35.8
11.5
11.9
8.2
94.5
24.1
3.8
104.4
14.4
50.1
29.5
4.6
32.1
Buy
Neutral
Neutral
Buy
Neutral
Buy
Neutral
139
100
245
308
82
269
87
185
112
266
371
85
365
97
33
12
9
21
4
36
11
3.4
-18.8
-63.5
26.2
-50.3
-5.4
-56.5
8.9
6.3
8.3
37.3
-9.6
19.0
-1.5
15.7
12.1
39.9
45.6
8.0
35.2
5.7
-43.1 161.5 75.6
Loss
LP
91.8
PL
LP 378.2
-10.4 42.5 22.1
PL
Loss
LP
PL
LP
85.6
PL
Loss
LP
PL
LP 128.5
NA
45.6
38.9
35.5
26.2
21.9
5.3
23.5
31.5
29.5
41.5
33.9
30.2
20.4
38.4
16.6
16.1
20.4
20.6
37.4
42.1
33.4
27.5
19.1
22.8
20.4
18.9
25.8
20.9
49.3
2.0
5.0
-7.7 3.0
-12.2 1.8
8.3 11.0
-29.6 -6.8
-3.8 7.6
-23.8 -0.7
-6.3 4.6
12.4
20.7
13.7
20.6
14.1
32.6
18.4
21.7
30.7
13.4
12.1
20.1
15.6
20.7
17.4
31.0
17.5
21.7
33.2
14.1
Buy
Buy
Buy
Buy
Buy
Neutral
Buy
Buy
Buy
Buy
142 215
2093 2450
547 960
1493 1930
602 765
664 600
1806 2225
474 475
1110 1650
163 240
52
17
76
29
27
-10
23
0
49
47
3.8
46.5
34.2
62.3
37.4
9.9
42.0
5.5
90.2
6.8
5.3
62.3
44.6
75.0
51.7
11.6
48.7
6.6
108.8
9.3
7.5
83.1
56.8
89.3
63.5
13.9
57.9
8.4
131.5
13.9
25 May 2018
31
 Motilal Oswal Financial Services
Click excel icon
for detailed
valuation guide
Valuation snapshot
ROE (%)
FY18E FY19E
17.0 17.2
21.3 17.8
10.5 13.1
24.1 21.4
14.3 16.5
16.9 16.7
12.7
13.1
14.6
11.6
16.6
3.6
18.1
48.7
1.7
16.5
13.9
18.8
18.7
23.1
13.0
9.1
21.9
8.8
17.1
15.9
10.8
6.1
10.1
4.6
10.3
8.6
1.7
6.1
14.2
4.4
11.9
6.5
6.9
16.3
9.3
8.7
25.3
32.9
48.7
25.9
29.2
-2.8
24.9
21.2
16.3
19.5
15.9
14.3
16.7
4.0
24.0
43.5
2.7
20.7
14.1
24.2
21.0
20.8
14.0
11.5
22.0
13.2
16.0
16.3
12.1
7.8
12.4
8.9
11.2
15.9
3.9
9.8
15.7
10.3
21.2
12.0
10.8
18.2
12.2
12.2
27.9
35.5
50.5
26.5
31.3
4.6
23.2
21.4
Company
Reco
LIC Hsg Fin
Neutral
MAS Financial
Buy
M&M Fin.
Buy
Muthoot Fin
Neutral
PNB Housing
Buy
Repco Home
Buy
Shriram
City
Buy
Union
Shriram Trans. Buy
Aggregate
Capital Goods
ABB
Sell
Bharat Elec.
Buy
BHEL
Sell
Blue Star
Neutral
CG Cons. Elec.
Buy
CG Power & Indu. Neutral
Cummins
Buy
Engineers India Buy
GE T&D
Neutral
Havells
Buy
K E C Intl
Neutral
L&T
Buy
Siemens
Neutral
Solar Ind
Neutral
Thermax
Buy
Va Tech Wab.
Buy
Voltas
Neutral
Aggregate
Cement
Ambuja Cem.
Neutral
ACC
Neutral
Birla Corp.
Buy
Dalmia Bharat
Buy
Grasim Inds.
Neutral
India Cem
Neutral
JK Lakshmi Ce
Buy
Ramco Cem
Buy
Orient Cem
Buy
Prism Johnson Buy
Not
Sagar Cements
Rated
Sanghi Inds.
Buy
Shree Cem
Buy
Ultratech
Buy
Aggregate
Consumer
Asian Paints
Neutral
Britannia
Buy
Colgate
Buy
Dabur
Buy
Emami
Buy
Future Consumer Buy
Godrej Cons.
Neutral
GSK Cons.
Neutral
CMP TP % Upside
EPS (INR)
EPS Gr. YoY (%)
P/E (x)
P/B (x)
(INR) (INR) Downside FY18E FY19E FY20E FY18E FY19E FY20E FY18E FY19E FY18E FY19E
471 610
29
39.4 45.0
53.5
3.0 14.3 18.7 12.0
10.5
1.9
1.7
590 750
27
24.4 31.1
38.9 62.2 27.5 25.2 24.2
19.0
3.6
3.2
457 600
31
14.5 20.7
26.5 104.9 42.9 27.9 31.5
22.0
3.0
2.7
397 470
18
43.0 44.8
48.9 45.6 4.1
9.2
9.2
8.9
2.0
1.8
1219 1750
44
49.9 65.7
87.3 57.7 31.8 32.9 24.5
18.6
3.3
2.9
567
710
25
32.9 37.7
42.3 13.1 14.3 12.3 17.2
15.0
2.7
2.3
2196 2800
1477 1950
28
32
100.8 145.9
69.1
118.2
175.9
141.5
19.5
24.7
27.2
8.1
3.7
135.9
17.0
14.3
-72.2
-13.2
48.1
42.3
17.4
51.1
14.8
10.9
18.2
-1.2
76.4
11.9
16.3
29.5
31.3
-30.5
109.9
-15.3
-48.5
5.8
-12.3
LP
769.4
LP
44.8
71.0
27.1
37.7
11.4
14.2
46.8
19.5
63.3
34.7
9.2
48.8
27.4
9.2
18.5
36.2
18.6
63.0
5.7
17.9
20.8
34.9
28.1
102.8
20.5
98.7
129.3
72.3
25.7
148.6
105.1
20.6
19.8
24.3
17.7
7.6
19.4
33.8
22.0
58.8
18.6
19.8
12.0
19.3
30.6
20.0
18.8
27.4
27.7
9.8
11.2
18.9
31.9
31.0
26.0
48.3
25.3
41.8
71.6
24.0
62.2
32.7
21.8
21.4
30.4
58.9
17.8
23.7
46.8
45.7
63.0
31.2
21.2
40.6
47.6
20.8
27.6
52.1
45.6
55.1
13.5
30.7
30.7
35.2
28.1
36.9
42.5
17.8
43.1
51.8
33.3
56.3
44.0
35.8
25.8
41.5
43.4
35.5
61.0
68.3
50.0
47.6
42.9
NM
53.0
37.8
15.0
12.5
23.9
42.8
15.9
20.7
31.9
38.3
38.6
23.2
19.4
27.3
37.3
19.1
23.3
38.3
38.4
33.8
12.7
26.1
25.4
26.1
21.9
18.2
35.3
8.9
18.8
30.0
26.5
22.6
21.5
17.8
13.1
31.8
30.2
22.8
50.4
53.2
42.9
41.1
35.2
191.2
46.1
33.5
2.6
2.7
4.4
6.9
3.0
0.8
8.1
18.8
1.1
5.0
3.0
7.1
8.9
4.8
3.4
4.8
9.3
4.7
2.2
4.5
3.3
2.1
2.8
1.7
4.2
1.5
0.7
3.1
4.5
2.4
5.0
2.3
1.3
6.3
3.9
3.1
14.7
20.1
22.3
11.4
11.7
8.9
12.2
7.6
2.3
2.3
3.8
6.1
2.7
0.8
7.3
15.0
1.0
4.6
2.8
6.1
7.8
4.0
3.1
4.4
7.8
4.2
1.9
4.0
3.1
2.0
2.6
1.6
3.7
1.3
0.7
2.8
3.9
2.2
4.2
2.0
1.2
5.4
3.5
2.8
13.5
17.8
21.0
10.4
10.4
8.5
9.5
6.8
1167
116
75
705
236
72
718
134
331
534
373
1339
1029
1110
1130
448
531
1060
196
80
860
270
90
1040
200
430
640
410
1690
1185
1100
1370
700
620
-9
69
7
22
14
25
45
50
30
20
10
26
15
-1
21
56
17
19.8
6.5
3.2
15.1
5.2
1.1
23.0
6.3
8.2
11.2
17.9
48.6
19.8
24.4
20.5
33.3
17.3
27.3
7.3
3.6
22.1
6.2
1.9
31.0
6.9
12.1
14.3
19.6
57.6
26.9
28.9
33.4
35.2
20.4
32.1
7.8
4.3
29.6
7.5
3.0
36.8
8.2
13.6
17.1
25.5
69.0
31.9
36.8
42.7
38.6
22.7
212
1333
732
2563
1020
125
381
794
121
104
901
255
1747
1020
3403
1122
148
451
918
170
144
-
20
31
39
33
10
19
18
16
40
38
6.0
47.4
19.8
60.2
57.4
2.9
7.4
23.9
2.2
2.4
25.2
8.1
60.7
40.2
72.6
114.1
6.6
12.7
30.0
5.4
4.9
50.6
10.7
79.6
50.6
107.6
143.0
9.4
21.8
37.2
8.7
6.5
70.6
101.0 39.7
96.7
30.3
43.8
55.6
33.8
35.1
41.3
33.0
96
134
16123 19731
3658 4818
40
22
32
3.7
7.3
388.5 506.3
84.3 121.2
9.8
29.5
683.8 1.1
171.3 -12.3
0.1
30.5
133.2
34.6
10.4
35.6
1.1
28.1
215.6
1.9
13.5
18.0
7.2
-8.5
Loss
11.7
6.6
1290
5714
1251
370
1042
54
1118
6300
1280
6400
1420
435
1390
76
1155
6255
-1
12
13
18
33
41
3
-1
21.1 25.6
83.6 107.4
25.0 29.2
7.8
9.0
24.3 29.6
-0.2
0.3
21.1 24.3
166.5 187.8
21.1 19.0
28.4 24.0
16.5 18.5
16.0 15.5
21.9 20.4
LP 284.7
14.9 15.9
12.8 14.8
25 May 2018
32
 Motilal Oswal Financial Services
Click excel icon
for detailed
valuation guide
CMP
(INR)
1562
275
417
315
9658
23357
1080
9274
175
Valuation snapshot
ROE (%)
FY18E FY19E
78.1 85.5
22.3 23.0
13.4 17.1
34.0 35.8
40.3 50.2
39.9 44.6
24.2 24.5
57.0 59.7
4.9
14.9
17.2
26.3
19.6
16.4
26.0
24.2
7.2
21.6
11.3
16.0
8.5
1.2
16.4
13.2
19.7
10.5
18.9
11.9
15.8
16.1
11.0
3.9
8.5
17.6
12.6
2.2
14.6
23.6
13.5
12.4
9.5
9.4
5.0
8.8
-7.8
18.4
-6.3
3.7
8.5
16.2
22.3
28.3
19.4
19.5
20.4
21.7
11.5
22.8
12.9
20.0
11.1
2.2
15.3
13.9
27.2
13.0
21.5
17.8
11.8
16.8
17.4
5.7
13.2
19.9
14.3
6.9
14.1
16.2
13.7
12.4
10.8
13.4
10.1
12.3
32.1
18.2
0.2
7.9
Company
HUL
ITC
Jyothy Lab
Marico
Nestle
Page Inds
Pidilite Ind.
P&G Hygiene
Prabhat Dairy
United Brew
United Spirits
Aggregate
Healthcare
Alembic Phar
Alkem Lab
Ajanta Pharma
Aurobindo
Biocon
Cadila
Cipla
Divis Lab
Dr Reddy’s
Fortis Health
Glenmark
Granules
GSK Pharma
IPCA Labs
Jubilant Life
Laurus Labs
Lupin
Sanofi India
Shilpa Medicare
Strides Shasun
Sun Pharma
Torrent Pharma
Aggregate
Infrastructure
Ashoka Buildcon
IRB Infra
KNR
Constructions
Sadbhav
Engineering
Aggregate
Logistics
Allcargo Logistics
Concor
Gateway
Distriparks
Aggregate
Media
Dish TV
D B Corp
Den Net.
Ent.Network
Reco
Buy
Neutral
Neutral
Neutral
Neutral
Buy
Buy
Neutral
Not
Rated
Buy
Neutral
TP % Upside
EPS (INR)
EPS Gr. YoY (%)
P/E (x)
P/B (x)
(INR) Downside FY18E FY19E FY20E FY18E FY19E FY20E FY18E FY19E FY18E FY19E
1805
16
24.5 29.0
35.4 24.7 18.3 22.3 63.8
53.9 47.8 44.5
295
7
9.2
10.0
11.3
9.5
8.8 13.4 29.9
27.5
6.5
6.1
425
2
8.2
10.9
13.0 -26.7 32.7 19.4 50.6
38.1
6.6
6.4
350
11
6.4
7.6
9.0
2.0 18.3 18.2 49.1
41.5 16.0 13.9
9535
-1
140.0 189.3 209.0 13.2 35.2 10.4 69.0
51.0 27.2 24.2
27490
18
297.1 415.7 549.8 24.5 39.9 32.2 78.6
56.2 31.3 25.0
1155
7
17.6 20.6
23.7
5.4 17.0 14.9 61.3
52.4 13.8 12.0
9065
-2
131.3 162.1 187.8 -1.2 23.4 15.8 70.6
57.2 37.3 31.4
-
23
12
3.5
14.1
32.6
6.4
17.4
56.9
9.7
22.9
78.5
-2.0
62.0
22.1
10.1
2.5
-12.4
-7.5
11.4
-39.2
12.7
28.8
-17.7
-13.3
-85.8
-22.2
-12.4
11.5
33.2
23.3
-10.9
-17.4
9.8
-5.0
-65.1
-49.6
-12.9
-18.1
83.8
23.9
74.3
18.9
14.9
36.9
-2.6
11.2
73.9
25.5
25.0
33.9
41.4
87.8
7.7
25.2
11.2
36.6
37.3
72.1
-22.5
14.2
82.4
42.6
63.3
27.6
26.8
52.1
31.2
38.1
18.0
50.5
83.9
95.7
49.7
27.5
67.7
54.9
41.8
16.7
21.8
18.9
12.0
59.7
17.8
21.3
25.6
22.2
51.7
16.1
10.5
56.0
22.6
12.6
16.7
20.5
30.3
17.4
25.7
21.5
21.5
20.9
36.6
8.9
20.7
22.5
15.1
13.5
25.9
17.0
23.7
2.4
11.8
16.4
13.1
3.6
4.6
4.2
2.9
7.5
4.5
3.0
5.4
2.6
1.1
2.9
1.5
12.3
3.1
3.0
3.2
2.5
5.6
3.3
1.5
3.0
4.6
3.3
2.6
1.3
3.6
3.3
2.1
1.5
3.6
1.8
3.1
2.3
10.2
12.3
11.8
3.1
3.9
3.6
2.4
6.9
3.7
2.8
4.9
2.3
1.1
2.5
1.4
15.2
2.8
2.5
2.7
2.3
5.1
2.8
1.4
2.7
4.0
3.0
2.4
1.2
3.1
2.9
1.9
1.4
3.3
1.7
2.9
12.8
2.1
2.2
3.3
1180 1450
3122 3510
Neutral
Buy
Buy
Buy
Neutral
Buy
Neutral
Neutral
Neutral
Buy
Neutral
Buy
Neutral
Buy
Buy
Buy
Buy
Buy
Buy
Buy
Buy
Neutral
421
1950
976
584
645
358
532
1127
1974
143
531
83
2389
661
787
455
742
4900
424
412
462
1320
500
2500
1560
820
600
555
540
1100
2000
185
550
130
2500
750
1110
586
865
5600
686
481
675
1400
19
28
60
40
-7
55
1
-2
1
30
4
57
5
13
41
29
17
14
62
17
46
6
21.9 25.2
65.4 89.5
53.0 51.6
43.8 48.7
6.2
10.8
16.0 20.1
20.0 24.9
32.9 44.0
62.9 89.0
1.5
2.8
30.6 32.9
6.3
7.9
38.3 42.6
21.4 29.2
45.6 62.6
15.8 27.3
46.8 36.2
141.7 161.8
13.3 24.3
11.3 16.1
13.2 21.5
48.0 61.3
28.2
110.6
65.0
53.6
19.8
23.3
30.0
52.7
109.9
7.3
41.1
11.0
48.5
37.3
72.5
34.3
48.0
186.9
30.6
28.1
27.7
78.5
12.0 19.2
23.6 29.8
25.9 18.4
10.1 13.3
83.3 103.9
15.9 22.3
20.3 26.7
19.7 34.3
23.5 31.4
164.5 97.1
24.7 17.4
38.7 13.1
13.7 62.3
27.7 30.9
15.9 17.3
25.8 28.7
32.5 15.9
15.5 34.6
25.9 31.8
75.0 36.6
28.8 35.1
28.0 27.5
25.0 26.6
123.6
9.7
17.1
25.8
16.9
Buy
Neutral
Buy
Buy
256
231
289
359
290
290
375
460
13
26
30
28
2.1
23.9
16.9
13.9
7.0
26.0
14.0
16.0
8.3
26.5
18.2
17.4
LP 238.0 18.1
17.5 9.0
1.9
41.2 -17.3 30.2
27.1
14.9
8.6
Buy
Buy
Buy
120 163
1383 1553
166
199
35
12
20
7.3
35.1
4.7
8.9
53.4
9.8
11.7
64.6
11.2
-23.1 23.2
12.5 52.1
30.5
21.0
16.6
39.4
35.4
35.5
-32.1 109.0 14.4
1.6
50.1
21.8
Buy
Buy
Neutral
Buy
74
257
96
664
101
324
90
770
36
26
-7
16
-0.3
17.6
-2.9
6.8
1.6
20.5
0.1
15.2
3.4
24.9
4.0
28.5
PL
LP 109.9
-13.8 16.4 21.6
Loss
LP 5,545
-40.6 124.2 87.4
NM
46.4 17.7
14.6
12.5
2.4
NM 1,358.3 2.2
97.8
43.6
3.6
25 May 2018
33
 Motilal Oswal Financial Services
Click excel icon
for detailed
valuation guide
Valuation snapshot
ROE (%)
FY18E FY19E
-1.2 5.2
14.0 12.4
12.8 9.1
14.9 18.5
9.0 11.8
12.2 15.3
11.6 18.9
-15.8 2.4
25.2 28.4
19.6 19.4
14.2 16.6
12.8
26.7
-2.7
22.5
8.4
18.2
-1.0
22.9
13.3
17.8
11.7
30.7
24.1
11.9
16.7
14.4
28.7
21.0
20.8
26.2
21.3
7.4
9.6
23.3
13.0
13.5
20.3
16.9
23.9
19.4
18.1
25.0
26.9
24.1
15.4
33.1
18.8
14.6
16.2
16.7
15.5
28.6
2.1
23.9
18.3
17.2
4.8
26.3
17.1
17.4
14.7
35.9
21.6
12.0
22.7
13.2
19.6
14.0
20.8
20.8
16.8
10.5
12.0
23.8
13.2
13.0
24.3
18.4
26.7
22.0
18.1
24.0
26.4
22.9
16.0
30.4
24.3
18.3
18.2
18.7
Company
Hathway Cable
Hind. Media
HT Media
Jagran Prak.
Music Broadcast
PVR
Prime Focus
Siti Net.
Sun TV
Zee Ent.
Aggregate
Metals
Hindalco
Hind. Zinc
JSPL
JSW Steel
Nalco
NMDC
SAIL
Rain Industries
Vedanta
Tata Steel
Aggregate
Oil & Gas
Aegis Logistics
BPCL
GAIL
Gujarat Gas
Gujarat St. Pet.
HPCL
IOC
IGL
Mahanagar Gas
MRPL
Oil India
ONGC
PLNG
Reliance Ind.
Aggregate
Retail
Jubilant Food
PC Jeweller
Titan Co.
Aggregate
Technology
Cyient
HCL Tech.
Hexaware
Infosys
KPIT Tech
L&T Infotech
Mindtree
Mphasis
NIIT Tech
Persistent Sys
Reco
Buy
Neutral
Neutral
Buy
Buy
Buy
Buy
Neutral
Buy
Buy
CMP TP % Upside
EPS (INR)
EPS Gr. YoY (%)
P/E (x)
P/B (x)
(INR) (INR) Downside FY18E FY19E FY20E FY18E FY19E FY20E FY18E FY19E FY18E FY19E
28
47
68
-0.2
0.8
2.0
Loss
LP 161.9 NM
36.8
2.0
1.9
213 237
11
23.9 23.9
26.3 -7.5
0.1 10.2
8.9
8.9
1.2
1.0
77
92
19
13.2 10.5
11.5 78.9 -20.8 10.4
5.8
7.4
0.7
0.6
165 215
31
10.1 13.1
16.0 -5.3 30.5 21.5 16.3
12.5
2.6
2.3
342 469
37
9.1
13.2
17.3 41.1 45.1 31.8 37.8
26.0
3.3
2.9
1338 1760
32
26.7 38.0
51.2 29.9 42.4 34.7 50.2
35.2
5.8
5.0
83
130
58
2.5
5.8
7.9 100.6 137.5 36.4 33.7
14.2
3.5
2.2
14
27
95
-0.9
0.1
0.6
Loss
LP 411.6 NM 109.7 2.7
2.6
934 1200
28
27.7 35.0
40.6 11.6 26.2 15.9 33.7
26.7
7.9
7.3
554 690
24
14.5 16.5
19.7
8.4 14.1 19.0 38.2
33.5
7.0
6.0
15.4 32.9 28.1 35.2
26.5
5.0
4.4
234
284
228
314
71
116
70
223
250
548
371
336
349
394
120
215
71
426
345
705
58
18
53
26
69
86
2
91
38
29
18.9
21.1
-8.5
23.3
4.3
13.6
-0.9
23.7
21.3
71.9
26.1
26.8
6.4
30.4
9.9
14.0
4.3
35.2
28.3
90.0
29.3
30.6
10.4
30.5
10.2
14.7
6.5
39.8
35.3
67.4
120.5
7.2
Loss
57.5
16.8
37.0
Loss
238.1
40.7
76.5
72.9
74.2
-17.3
23.9
32.0
38.5
2.4
11.0
16.5
31.0
-13.3
-18.3
2.3
21.8
20.7
8.4
180.6
44.4
39.5
48.8
24.8
4.5
21.2
3.1
6.4
19.6
38.0
13.2
19.8
7.2
38.2
26.8
LP
30.2
128.2
2.9
LP
48.5
33.0
25.2
40.6
52.1
2.9
8.8
58.1
2.5
-21.0
-26.1
13.3
-10.3
-12.0
48.1
29.6
21.6
15.0
6.3
39.1
26.6
28.8
29.1
10.3
6.9
14.2
8.3
12.8
14.3
26.7
23.9
22.3
16.4
12.1
14.2
62.3
0.2
3.2
4.7
50.2
13.2
24.7
-25.1
7.0
28.5
13.0
7.7
24.2
7.5
14.9
23.0
12.9
0.0
9.1
3.3
8.2
16.8
6.8
10.7
31.4
27.6
26.1
27.1
11.8
8.0
11.0
10.8
12.3
18.3
23.9
9.6
19.4
21.7
12.4
13.5
NM
13.4
16.3
8.5
NM
9.4
11.8
7.6
12.9
43.1
9.3
14.6
39.8
14.3
6.8
6.5
25.1
15.1
7.5
11.7
10.0
15.2
15.0
11.2
89.1
12.2
73.1
55.2
20.4
14.6
26.1
18.9
21.3
25.4
30.2
24.9
23.9
20.8
9.0
10.6
35.6
10.3
7.2
8.2
16.2
6.3
8.8
6.1
9.2
28.3
9.0
13.4
25.2
14.0
8.6
8.8
22.2
16.9
8.6
7.9
7.7
12.5
13.1
10.5
64.1
9.6
56.8
42.7
18.5
13.6
22.8
17.4
18.9
22.2
23.9
20.1
19.5
17.9
1.4
3.3
0.7
2.8
1.4
1.5
0.8
1.9
1.6
1.2
1.5
11.8
2.1
1.7
6.3
1.9
1.8
1.3
5.0
3.7
1.5
0.9
0.9
3.3
1.8
1.5
18.1
1.9
16.1
10.7
3.7
3.5
6.6
4.3
3.3
7.6
6.2
3.9
3.8
3.3
1.4
2.8
0.7
2.2
1.2
1.4
0.8
1.5
1.5
1.0
1.3
8.9
1.8
1.6
5.2
1.8
1.6
1.2
4.3
3.3
1.3
0.8
0.9
2.7
1.6
1.4
15.6
1.7
14.4
9.4
3.3
3.1
5.6
3.8
2.8
6.1
5.4
3.5
3.4
3.2
Buy
Neutral
Buy
Buy
Buy
Buy
Sell
Buy
Buy
Neutral
Buy
Buy
Neutral
Buy
Neutral
Buy
Buy
Buy
Buy
Neutral
Buy
Buy
Buy
Buy
270
371
307
842
175
283
156
253
790
97
215
168
211
916
303
554
303
1122
187
507
263
384
936
120
260
222
320
1150
12
49
-5
33
7
79
68
52
18
24
21
32
52
26
6.3
40.0
21.0
21.2
12.2
41.7
23.9
10.1
52.2
12.8
18.3
16.8
13.9
60.9
9.5
41.2
22.9
33.5
12.5
32.9
17.6
11.4
46.8
11.3
27.2
21.8
16.8
70.1
12.3
46.5
24.6
41.6
13.4
37.9
21.7
12.9
46.8
12.3
28.1
23.5
19.7
74.9
Neutral
Buy
Buy
2651 2450
188 520
921 1125
-8
177
22
29.7
15.4
12.6
41.4
19.5
16.2
54.4
24.9
20.5
Neutral
Neutral
Sell
Buy
UR
Neutral
Buy
Neutral
Neutral
Buy
781
911
432
1222
271
1684
1039
1098
1089
840
800
1050
390
1330
1700
1000
960
1100
860
2
15
-10
9
-
1
-4
-13
1
2
38.2
62.6
16.6
64.8
12.7
66.3
34.4
44.0
45.6
40.4
42.2
66.9
18.9
70.1
14.3
75.8
43.5
54.6
55.7
47.0
47.1
72.2
21.0
77.7
16.1
89.7
53.9
59.8
66.6
57.2
25 May 2018
34
 Motilal Oswal Financial Services
Click excel icon
for detailed
valuation guide
CMP
(INR)
1196
3605
710
264
1292
Valuation snapshot
ROE (%)
FY18E FY19E
37.6 34.3
30.3 32.5
20.9 20.1
17.0 16.4
15.3 17.1
24.7 23.2
Company
Reco
Tata Elxsi
Buy
TCS
Neutral
Tech Mah
Buy
Wipro
Neutral
Zensar Tech
Buy
Aggregate
Telecom
Bharti Airtel
Buy
Bharti Infratel
Neutral
Idea Cellular
Buy
Tata Comm
Buy
Aggregate
Utiltites
Coal India
Buy
CESC
Buy
JSW Energy
Sell
NHPC
Buy
NTPC
Buy
Power Grid
Buy
Tata Power
Sell
Aggregate
Others
Arvind
Neutral
Avenue
Sell
Supermarts
BSE
Buy
Castrol India
Buy
Coromandel Intl Buy
Delta Corp
Buy
Interglobe
Neutral
Indo Count
Neutral
Info Edge
Buy
Kaveri Seed
Buy
Manpasand
Buy
MCX
Buy
Navneet
Neutral
Education
Oberoi Realty
Buy
Phoenix Mills
Buy
Quess Corp
Buy
PI Inds.
Buy
Piramal Enterp. Buy
SRF
Buy
S H Kelkar
Buy
Tata Chemicals Buy
Team Lease Serv. Buy
Trident
Buy
TTK Prestige
Neutral
UPL
Buy
V-Guard
Neutral
TP % Upside
EPS (INR)
EPS Gr. YoY (%)
P/E (x)
P/B (x)
(INR) Downside FY18E FY19E FY20E FY18E FY19E FY20E FY18E FY19E FY18E FY19E
1400
17
38.7 45.0
53.4 37.7 16.2 18.6 30.9
26.6 10.3 8.2
3000
-17
132.1 150.5 166.9 -1.0 13.9 10.9 27.3
24.0
8.4
7.2
700
-1
39.8 42.3
49.3 28.8 6.4 16.4 17.9
16.8
3.6
3.1
300
14
18.9 19.2
21.7 11.8 1.3 13.0 14.0
13.8
2.5
2.1
1400
8
52.8 67.0
85.2
1.3 27.0 27.2 24.5
19.3
3.5
3.1
4.9
5.7 10.9 20.8
19.7
5.1
4.6
581
346
85
730
56
9
50
19
4.1
13.6
-9.6
3.5
1.9
13.7
-12.3
7.5
5.6
14.2
-10.5
21.1
-63.3 -53.8 197.1 91.1
-8.1
0.4
3.6
23.3
Loss Loss Loss
NM
-67.2 115.3 182.9 177.4
-98.8 PL
LP 2,894.1
16.5
9.5
16.1
7.0
9.3
6.0
22.7
11.1
36.5
32.0
20.9
4.0
18.4
41.4
34.1
16.6
27.1
17.0
34.6
16.6
17.6
-3.4
30.9
38.3
18.5
27.1
30.2
26.6
19.5
45.8
18.7
15.4
19.2
12.1
15.7
13.5
23.2
10.9
12.7
12.5
14.3
13.6
31.3
108.7
18.6
23.3
18.4
39.9
20.0
11.9
50.2
14.8
50.5
33.9
16.9
36.7
43.6
49.3
31.6
28.8
22.3
31.5
14.9
63.8
10.4
43.8
15.7
50.5
197.4
23.2
NM
82.4
-128
10.6
10.5
16.8
8.9
10.9
10.2
12.0
10.5
25.8
82.4
17.1
24.0
17.8
32.1
16.6
10.1
44.6
12.5
31.8
24.9
13.3
9.9
34.0
37.4
25.0
20.6
18.0
25.7
15.6
40.6
7.9
34.3
14.9
38.0
2.1
3.5
0.9
35.1
2.1
7.5
1.2
1.0
0.9
1.3
2.0
1.4
2.0
2.6
18.8
1.4
15.8
3.9
3.9
6.3
1.6
6.6
3.6
4.1
2.7
3.9
2.8
3.7
5.0
6.0
2.2
2.9
4.1
1.6
10.3
0.9
7.5
3.8
12.3
371
318
57
615
2.1
2.4
1.1
3.6 15.6 15.2
1.1 -16.0 -21.9
24.6 9.4 35.1
2.2
0.1 -1.7
7.0
1.1
1.0
0.9
1.2
1.7
1.0
1.8
2.4
16.2
1.2
14.8
3.4
3.5
6.0
1.3
6.0
3.2
3.8
2.5
3.3
2.3
2.9
4.2
5.1
2.0
2.6
3.6
1.5
8.2
0.9
6.7
3.2
9.8
47.4
9.2
4.6
8.6
10.6
16.6
10.7
14.7
8.6
18.9
7.6
69.1
22.1
12.3
41.3
13.9
13.7
23.4
7.2
7.9
24.2
7.8
9.6
18.8
20.7
8.9
13.7
13.4
24.9
17.6
9.2
18.0
26.9
26.9
65.8
11.0
6.1
10.3
11.6
17.7
9.7
17.5
9.8
21.1
6.8
63.8
20.6
11.5
37.0
14.1
14.0
27.1
12.3
10.4
26.9
25.1
9.6
15.3
22.1
10.2
15.4
14.9
10.2
22.6
11.4
20.7
23.3
28.8
280 397
1020 1407
70
61
27
36
165 214
212 287
76
77
42
38
-13
36
30
36
1
17.8
75.5
3.0
2.4
13.0
16.9
5.3
26.4
97.5
4.2
3.0
15.2
20.7
6.3
30.8 19.2 48.4
106.7 45.5 29.1
4.8 -21.2 37.9
3.2 -17.2 22.2
16.6
5.0 16.9
21.9 21.3 22.1
7.8
3.5 18.7
11.3 29.3
20.3
22.5
57.2
7.1
27.9
10.2
94.1
8.7
33.4
47.4
18.7
33.7
11.5
48.6
26.6
39.8
39.9
147.9
129.8
12.2
54.8
98.6
8.3
203.2
55.6
6.7
-1.4
68.4
6.0
2.9
38.8
89.8
35.1
-46.0
49.0
79.5
38.2
-14.6
4.7
21.4
44.2
115.7
-20.2
14.5
-10.3
9.1
39.7
28.0
-21.8
4.4
5.9
25.3
21.6
31.9
9.0
-2.8
3.7
24.5
20.4
17.1
12.5
18.5
58.4
36.5
27.4
271.7
28.4
31.8
26.3
40.0
23.9
22.4
-4.8
57.1
32.7
27.8
5.6
32.9
383
1404
808
163
418
231
1166
75
1171
507
443
720
130
497
690
1075
842
2393
1796
249
717
2748
55
6037
695
226
460
900
1000
248
557
327
1318
95
1550
664
467
1050
149
654
737
1350
958
3500
2206
318
941
3400
83
5281
945
167
20
-36
24
52
33
41
13
26
32
31
6
46
15
31
7
26
14
46
23
28
31
24
51
-13
36
-26
12.2
12.9
43.5
7.0
22.7
5.8
58.3
6.3
23.4
34.2
8.8
21.2
7.7
14.8
17.0
47.4
6.8
23.5
7.2
70.2
7.4
26.3
40.6
13.9
28.9
9.8
13.5 50.3
15.8 20.3
21.8 28.8
26.7 33.7
83.1 116.4
80.4 99.6
7.9
9.7
48.2 45.9
43.0 67.6
5.3
7.0
137.8 176.1
44.2 46.7
4.5
6.0
25 May 2018
35
 Motilal Oswal Financial Services
MOSL Universe stock performance
Company
Automobiles
Amara Raja
Ashok Ley.
Bajaj Auto
Bharat Forge
Bosch
CEAT
Eicher Mot.
Endurance Tech.
Escorts
Exide Ind
Hero Moto
M&M
Mahindra CIE
Maruti Suzuki
Motherson Sumi
Tata Motors
TVS Motor
Banks - Private
Axis Bank
DCB Bank
Equitas Hold.
Federal Bank
HDFC Bank
ICICI Bank
IDFC Bank
IndusInd
J&K Bank
Kotak Mah. Bk
RBL Bank
South Indian
Yes Bank
Banks - PSU
BOB
BOI
Canara
Indian Bk
PNB
SBI
Union Bk
NBFCs
Aditya Birla Cap
Bajaj Fin.
Capital First
Cholaman.Inv.&Fn
Dewan Hsg.
GRUH Fin.
HDFC
HDFC Stand. Life
Indiabulls Hsg
L&T Fin.Holdings
LIC Hsg Fin
M&M Fin.
Muthoot Fin
1 Day (%)
-0.9
-0.6
-1.4
-6.0
-1.3
-0.7
0.3
-0.5
1.7
-2.0
0.1
1.5
0.7
-1.1
-4.9
-6.6
-4.1
2.7
-0.7
-1.0
0.6
1.0
1.9
-1.0
0.8
-1.8
1.6
-0.5
-1.4
-0.9
1.8
1.3
1.0
-0.4
1.9
2.0
0.1
0.5
0.7
-0.7
0.3
0.2
2.1
1.2
-0.4
-0.9
0.2
-0.8
-1.6
-0.2
1M (%)
-8.1
-9.1
-5.3
-14.2
-9.3
-16.7
-5.3
-3.8
-5.4
0.8
-6.3
0.7
-1.9
-7.3
-15.2
-12.8
-18.4
5.8
-6.2
4.2
-15.1
2.6
4.6
-16.2
-0.3
-14.3
9.3
-3.2
-6.0
2.2
-2.2
-1.3
-4.9
0.0
-12.0
11.6
-5.8
-9.0
9.1
-13.5
-9.5
2.8
-1.2
-2.6
-5.1
-16.6
-2.3
-13.4
-10.5
-10.4
12M (%)
-7.0
75.5
-1.3
18.8
-22.1
-23.5
7.6
50.9
47.9
9.7
-2.1
29.1
-1.2
22.7
7.7
-38.4
3.5
7.1
-1.1
6.0
-22.9
26.5
6.6
-29.6
32.3
-34.1
36.3
-5.6
-3.8
16.0
-21.1
-29.3
-30.5
-4.9
-44.3
-5.2
-45.8
Company
MAS Financial Serv.
PNB Housing
Repco Home
Shriram City Union
Shriram Trans.
Capital Goods
ABB
Bharat Elec.
BHEL
Blue Star
CG Cons. Elec.
CG Power & Inds Sol.
Cummins
Engineers India
GE T&D
Havells
K E C Intl
L&T
Siemens
Solar Ind
Thermax
Va Tech Wab.
Voltas
Cement
Ambuja Cem.
ACC
Birla Corp.
Dalmia Bharat
Grasim Inds.
India Cem
JK Lakshmi Ce
Ramco Cem
Orient Cem
Prism Johnson
Sagar Cements
Sanghi Inds.
Shree Cem
Ultratech
Consumer
Asian Paints
Britannia
Colgate
Dabur
Emami
Future Consumer
Godrej Cons.
GSK Cons.
HUL
ITC
Jyothy Lab
Marico
Nestle
Page Inds
Pidilite Ind.
1 Day (%)
-0.2
-0.7
-1.5
-1.4
1.9
-2.4
-0.6
-0.7
-1.0
-1.2
0.3
-2.4
-2.9
-8.5
-1.6
0.1
0.9
1.0
0.0
-0.6
-1.3
-2.7
2.5
1.5
-2.4
-5.2
-2.6
-2.5
-0.4
-0.6
1.2
-0.4
0.0
-0.1
0.7
-1.1
0.9
0.0
1.4
0.6
-0.6
-1.4
1.5
1.7
-0.4
0.5
-1.2
1.4
0.2
0.2
-0.4
1M (%)
-4.6
-10.0
-7.2
-6.8
-8.9
-14.1
-14.6
-15.1
-10.2
2.0
-12.5
-3.6
-15.1
-12.9
-1.3
-9.9
-2.8
-5.4
6.3
-2.0
-14.9
-16.9
-14.0
-14.9
-0.8
-14.8
-5.6
-16.2
-8.9
-7.7
-14.4
-10.5
-5.1
-16.2
-6.7
-11.3
10.0
7.9
13.8
3.7
-8.1
-8.9
-1.0
7.0
7.1
-0.3
13.2
-0.2
9.5
-4.6
1.2
12M (%)
-2.9
-23.9
1.2
56.2
-20.6
-23.5
-25.2
10.9
9.1
-18.4
-21.4
-13.3
-2.8
21.1
52.7
19.2
-22.7
35.4
14.9
-33.6
18.7
-9.9
-16.0
-2.6
10.1
11.2
-32.4
-20.8
17.7
-16.4
-10.0
9.2
30.9
-7.5
-12.4
18.0
61.7
26.4
37.5
-4.2
84.4
27.1
19.4
50.4
-8.4
11.7
1.2
48.0
66.1
49.7
71.1
-17.9
48.7
52.1
66.5
18.4
6.9
30.7
-29.8
54.4
3.1
25 May 2018
36
 Motilal Oswal Financial Services
MOSL Universe stock performance
Company
P&G Hygiene
Prabhat Dairy
United Brew
United Spirits
Healthcare
Alembic Phar
Alkem Lab
Ajanta Pharma
Aurobindo
Biocon
Cadila
Cipla
Divis Lab
Dr Reddy’s
Fortis Health
Glenmark
Granules
GSK Pharma
IPCA Labs
Jubilant Life
Lupin
Laurus Labs
Sanofi India
Shilpa Medicare
Strides Shasun
Sun Pharma
Torrent Pharma
Infrastructure
Ashoka Buildcon
IRB Infra.Devl.
KNR Construct.
Sadbhav Engg.
Logistics
Allcargo Logistics
Concor
Gateway Distriparks
Media
Dish TV
D B Corp
Den Net.
Ent.Network
Hathway Cab.
Hind. Media
HT Media
Jagran Prak.
Music Broadcast
PVR
Prime Focus
Siti Net.
Sun TV
Zee Ent.
Metals
Hindalco
Hind. Zinc
JSPL
1 Day (%)
0.6
-0.3
0.2
-2.8
0.6
-0.4
-0.9
1.8
0.9
3.0
-0.1
3.1
1.1
-1.4
3.0
-7.3
-0.6
-0.9
0.1
1.1
1.9
-0.7
0.8
1.8
2.2
-0.6
2.6
1.4
1.3
-1.0
-0.1
0.0
0.2
2.4
-2.0
-2.8
-0.7
0.4
0.4
0.5
0.2
-0.8
-0.5
-0.4
2.2
-0.3
0.3
1.9
-0.1
0.8
1M (%)
-3.5
-2.7
6.2
-12.4
-18.2
1.1
-29.1
-8.2
-1.0
-11.6
-11.3
-4.4
-8.5
-5.9
-8.5
-25.4
0.3
-10.1
-5.5
-9.4
-9.6
-0.7
-9.2
-36.2
-10.7
-7.0
-5.4
-12.1
-11.1
-8.9
-23.1
3.5
-9.3
-1.6
-18.6
-1.7
-5.5
-21.3
-7.3
-11.9
1.0
-11.7
-2.1
-14.2
-13.2
7.5
-5.8
-1.1
-11.6
-10.1
12M (%)
25.7
60.3
53.3
55.2
-27.4
6.6
-41.3
11.1
116.3
-18.9
2.3
102.2
-21.7
-26.6
-16.1
-38.2
-0.4
34.7
8.8
-39.6
-13.8
21.6
-38.9
-51.8
-23.4
6.6
30.2
6.8
45.7
17.8
-30.3
17.0
-30.4
-19.1
-27.4
5.3
-12.4
-29.8
-22.7
-3.6
-7.0
-1.3
-7.8
-17.1
-55.1
19.5
8.8
25.4
22.5
105.0
Company
JSW Steel
Nalco
NMDC
Rain Industries
SAIL
Vedanta
Tata Steel
Oil & Gas
Aegis Logistics
BPCL
GAIL
Gujarat Gas
Gujarat St. Pet.
HPCL
IOC
IGL
Mahanagar Gas
MRPL
Oil India
ONGC
PLNG
Reliance Ind.
Retail
Jubilant Food
PC Jeweller
Titan Co.
Technology
Cyient
HCL Tech.
Hexaware
Infosys
KPIT Tech
L&T Infotech
Mindtree
Mphasis
NIIT Tech
Persistent Sys
Tata Elxsi
TCS
Tech Mah
Wipro
Zensar Tech
Telecom
Bharti Airtel
Bharti Infratel
Idea Cellular
Tata Comm
Utiltites
Coal India
CESC
JSW Energy
NHPC Ltd
NTPC
Power Grid
Tata Power
1 Day (%)
1.2
0.4
2.3
-2.4
2.0
-0.9
1.7
1.7
-0.6
-5.1
0.0
4.1
-1.5
1.6
-3.9
-0.7
-0.2
-6.8
-4.5
0.0
0.4
3.3
-4.4
0.3
-0.9
1.9
1.9
3.1
4.7
5.8
0.5
1.7
1.7
1.5
-0.1
3.1
1.8
0.4
1.6
4.1
0.4
4.0
0.5
1.5
1.1
1.0
-1.5
-0.8
0.3
-1.1
1M (%)
-3.3
-9.6
-6.8
-34.0
-11.4
-16.0
-8.3
-6.5
-3.1
-9.0
-2.2
-6.4
-7.6
-4.4
-15.7
-13.0
-10.4
-9.2
-8.2
-11.3
-5.5
8.2
-35.0
-4.3
8.5
-14.3
1.5
5.9
12.1
9.4
4.1
11.9
9.1
15.7
-0.8
6.5
4.0
-8.0
11.9
-8.5
-3.5
-20.0
-2.6
-3.5
-2.8
-15.8
-3.5
-4.5
2.8
-10.2
12M (%)
65.6
8.7
-0.1
136.1
22.6
11.8
20.5
46.8
-21.6
4.8
12.2
1.7
-15.1
-27.5
28.8
-15.5
-22.0
5.5
-3.4
-0.8
41.3
171.4
-12.7
96.5
56.3
6.6
75.8
28.1
142.0
117.9
103.8
91.6
126.8
44.8
80.3
40.9
70.3
0.7
45.2
0.8
-13.8
-27.9
-5.1
6.8
16.5
12.7
-8.0
5.7
6.0
-4.6
25 May 2018
37
 Motilal Oswal Financial Services
MOSL Universe stock performance
Company
Others
Arvind
Avenue Super.
BSE
Castrol India
Coromandel Intl
Delta Corp
Interglobe
Indo Count
Info Edge
Kaveri Seed
Manpasand
MCX
Navneet Educat.
Oberoi Realty
Phoenix Mills
PI Inds.
Piramal Enterp.
Quess Corp
SRF
S H Kelkar
Tata Chemicals
Team Lease Serv.
Trident
UPL
V-Guard
1 Day (%)
0.1
3.3
0.2
-2.6
-3.7
1.6
0.5
-2.4
0.4
7.5
-0.3
-0.6
1.8
-0.5
-3.0
-1.2
1.9
-4.0
-0.6
0.1
-0.7
-0.3
1.1
1.5
1.3
1M (%)
-9.3
-4.9
0.0
-18.1
-11.3
-18.5
-21.3
-20.0
-5.1
-5.4
3.7
-8.4
-15.4
-12.3
12.7
-2.9
-6.9
1.1
-18.5
2.5
-1.8
11.1
-22.4
-6.8
-5.0
12M (%)
4.2
96.4
-23.5
-22.2
9.9
60.0
10.2
-55.4
39.0
2.9
21.2
-23.2
-18.6
32.9
68.5
4.5
-9.1
31.5
13.1
-10.1
20.7
142.0
-29.1
-11.5
25.7
25 May 2018
38
 Motilal Oswal Financial Services
THEMATIC/STRATEGY RESEARCH GALLERY
 Motilal Oswal Financial Services
REPORT GALLERY
RECENT INITIATING COVERAGE REPORTS
.
Rs
 Motilal Oswal Financial Services
DIFFERENTIATED PRODUCT GALLERY
 Motilal Oswal Financial Services
Explanation of Investment Rating
Investment Rating
BUY
SELL
NEUTRAL
UNDER REVIEW
NOT RATED
Expected return (over 12-month)
>=15%
< - 10%
> - 10 % to 15%
Rating may undergo a change
We have forward looking estimates for the stock but we refrain from assigning recommendation
India Electricals
*In case the recommendation given by the Research Analyst becomes inconsistent with the investment rating legend, the Research Analyst shall within 28 days of the inconsistency, take appropriate measures to make the recommendation consistent with the investment rating legend.
Disclosures:
The following Disclosures are being made in compliance with the SEBI Research Analyst Regulations 2014 (herein after referred to as the Regulations).
Motilal Oswal Securities Ltd. (MOSL) is a SEBI Registered Research Analyst having registration no. INH000000412. MOSL, the Research Entity (RE) as defined in the Regulations, is engaged in the business of providing Stock broking services,
Investment Advisory Services, Depository participant services & distribution of various financial products. MOSL is a subsidiary company of Motilal Oswal Financial Service Ltd. (MOFSL). MOFSL is a listed public company, the details in respect of
which are available on
www.motilaloswal.com.
MOSL is registered with the Securities & Exchange Board of India (SEBI) and is a registered Trading Member with National Stock Exchange of India Ltd. (NSE) and Bombay Stock Exchange Limited
(BSE), Multi Commodity Exchange of India Limited(MCX) and National Commodity & Derivatives Exchange Limited(NCDEX) for its stock broking activities & is Depository participant with Central Depository Services Limited (CDSL) & National
Securities Depository Limited (NSDL) and is member of Association of Mutual Funds of India (AMFI) for distribution of financial products and Insurance Regulatory & Development Authority of India (IRDA) as Corporate Agent for insurance products
.Details
of associate entities of Motilal Oswal Securities Limited are available on the website at
http://onlinereports.motilaloswal.com/Dormant/documents/Associate%20Details.pdf
MOSL, it’s associates, Research Analyst or their relative may have any financial interest in the subject company. MOSL and/or its associates and/or Research Analyst may have beneficial ownership of 1% or more securities in the subject company at
the end of the month immediately preceding the date of publication of the Research Report.
MOSL and its associate company(ies), their directors and Research Analyst and their relatives may; (a) from time to time, have a long or short position in, act
as principal in, and buy or sell the securities or derivatives thereof of companies mentioned herein. (b) be engaged in any other transaction involving such securities and earn brokerage or other compensation or act as a market maker in the financial
instruments of the company(ies) discussed herein or act as an advisor or lender/borrower to such company(ies) or may have any other potential conflict of interests with respect to any recommendation and other related information and opinions.;
however the same shall have no bearing whatsoever on the specific recommendations made by the analyst(s), as the recommendations made by the analyst(s) are completely independent of the views of the associates of MOSL even though there
might exist an inherent conflict of interest in some of the stocks mentioned in the research report.
Research Analyst may have served as director/officer, etc. in the subject company in the last 12 month period. MOSL and/or its associates may have
received any compensation from the subject company in the past 12 months.
In the last 12 months period ending on the last day of the month immediately preceding the date of publication of this research report, MOSL or any of its associates may have:
a)
managed or co-managed public offering of securities from subject company of this research report,
b)
received compensation for investment banking or merchant banking or brokerage services from subject company of this research report,
c)
received compensation for products or services other than investment banking or merchant banking or brokerage services from the subject company of this research report.
d)
Subject Company may have been a client of MOSL or its associates during twelve months preceding the date of distribution of the research report.
MOSL and it’s associates have not received any compensation or other benefits from the subject company or third party in connection with the research report. To enhance transparency, MOSL has incorporated a Disclosure of Interest Statement in
this document. This should, however, not be treated as endorsement of the views expressed in the report. MOSL and / or its affiliates do and seek to do business including investment banking with companies covered in its research reports. As a result,
the recipients of this report should be aware that MOSL may have a potential conflict of interest that may affect the objectivity of this report. Compensation of Research Analysts is not based on any specific merchant banking, investment banking or
brokerage service transactions.
Terms & Conditions:
This report has been prepared by MOSL and is meant for sole use by the recipient and not for circulation. The report and information contained herein is strictly confidential and may not be altered in any way, transmitted to, copied or distributed, in part
or in whole, to any other person or to the media or reproduced in any form, without prior written consent of MOSL. The report is based on the facts, figures and information that are considered true, correct, reliable and accurate. The intent of this report
is not recommendatory in nature. The information is obtained from publicly available media or other sources believed to be reliable. Such information has not been independently verified and no guaranty, representation of warranty, express or implied,
is made as to its accuracy, completeness or correctness. All such information and opinions are subject to change without notice. The report is prepared solely for informational purpose and does not constitute an offer document or solicitation of offer to
buy or sell or subscribe for securities or other financial instruments for the clients. Though disseminated to all the customers simultaneously, not all customers may receive this report at the same time. MOSL will not treat recipients as customers by
virtue of their receiving this report.
Analyst Certification
The views expressed in this research report accurately reflect the personal views of the analyst(s) about the subject securities or issues, and no part of the compensation of the research analyst(s) was, is, or will be directly or indirectly related to the
specific recommendations and views expressed by research analyst(s) in this report.
Disclosure of Interest Statement
Analyst ownership of the stock
Companies where there is interest
No
A graph of daily closing prices of securities is available at
www.nseindia.com, www.bseindia.com.
Research Analyst views on Subject Company may vary based on Fundamental research and Technical Research. Proprietary trading desk of MOSL or
its associates maintains arm’s length distance with Research Team as all the activities are segregated from MOSL research activity and therefore it can have an independent view with regards to subject company for which Research Team have
expressed their views.
Regional Disclosures (outside India)
This report is not directed or intended for distribution to or use by any person or entity resident in a state, country or any jurisdiction, where such distribution, publication, availability or use would be contrary to law, regulation or which would subject
MOSL & its group companies to registration or licensing requirements within such jurisdictions.
For Hong Kong:
This report is distributed in Hong Kong by Motilal Oswal capital Markets (Hong Kong) Private Limited, a licensed corporation (CE AYY-301) licensed and regulated by the Hong Kong Securities and Futures Commission (SFC) pursuant to the Securities
and Futures Ordinance (Chapter 571 of the Laws of Hong Kong) “SFO”. As per SEBI (Research Analyst Regulations) 2014 Motilal Oswal Securities (SEBI Reg No. INH000000412) has an agreement with Motilal Oswal capital Markets (Hong Kong)
Private Limited for distribution of research report in Hong Kong. This report is intended for distribution only to “Professional Investors” as defined in Part I of Schedule 1 to SFO. Any investment or investment activity to which this document relates is only
available to professional investor and will be engaged only with professional investors.” Nothing here is an offer or solicitation of these securities, products and services in any jurisdiction where their offer or sale is not qualified or exempt from
registration. The Indian Analyst(s) who compile this report is/are not located in Hong Kong & are not conducting Research Analysis in Hong Kong.
For U.S.
Motilal Oswal Securities Limited (MOSL) is not a registered broker - dealer under the U.S. Securities Exchange Act of 1934, as amended (the"1934 act") and under applicable state laws in the United States. In addition MOSL is not a registered
investment adviser under the U.S. Investment Advisers Act of 1940, as amended (the "Advisers Act" and together with the 1934 Act, the "Acts), and under applicable state laws in the United States. Accordingly, in the absence of specific exemption
under the Acts, any brokerage and investment services provided by MOSL, including the products and services described herein are not available to or intended for U.S. persons. This report is intended for distribution only to "Major Institutional
Investors" as defined by Rule 15a-6(b)(4) of the Exchange Act and interpretations thereof by SEC (henceforth referred to as "major institutional investors"). This document must not be acted on or relied on by persons who are not major institutional
investors. Any investment or investment activity to which this document relates is only available to major institutional investors and will be engaged in only with major institutional investors. In reliance on the exemption from registration provided by Rule
15a-6 of the U.S. Securities Exchange Act of 1934, as amended (the "Exchange Act") and interpretations thereof by the U.S. Securities and Exchange Commission ("SEC") in order to conduct business with Institutional Investors based in the U.S.,
MOSL has entered into a chaperoning agreement with a U.S. registered broker-dealer, Motilal Oswal Securities International Private Limited. ("MOSIPL"). Any business interaction pursuant to this report will have to be executed within the provisions of
this chaperoning agreement.
The Research Analysts contributing to the report may not be registered /qualified as research analyst with FINRA. Such research analyst may not be associated persons of the U.S. registered broker-dealer, MOSIPL, and therefore, may not be subject
to NASD rule 2711 and NYSE Rule 472 restrictions on communication with a subject company, public appearances and trading securities held by a research analyst account.
For Singapore
Motilal Oswal Capital Markets Singapore Pte Limited is acting as an exempt financial advisor under section 23(1)(f) of the Financial Advisers Act(FAA) read with regulation 17(1)(d) of the Financial Advisors Regulations and is a subsidiary of Motilal
Oswal Securities Limited in India. This research is distributed in Singapore by Motilal Oswal Capital Markets Singapore Pte Limited and it is only directed in Singapore to accredited investors, as defined in the Financial Advisers Regulations and the
Securities and Futures Act (Chapter 289), as amended from time to time. In respect of any matter arising from or in connection with the research you could contact the following representatives of Motilal Oswal Capital Markets Singapore Pte Limited:
Disclaimer:
The report and information contained herein is strictly confidential and meant solely for the selected recipient and may not be altered in any way, transmitted to, copied or distributed, in part or in whole, to any other person or to the media or reproduced
in any form, without prior written consent. This report and information herein is solely for informational purpose and may not be used or considered as an offer document or solicitation of offer to buy or sell or subscribe for securities or other financial
instruments. Nothing in this report constitutes investment, legal, accounting and tax advice or a representation that any investment or strategy is suitable or appropriate to your specific circumstances. The securities discussed and opinions expressed in
this report may not be suitable for all investors, who must make their own investment decisions, based on their own investment objectives, financial positions and needs of specific recipient. This may not be taken in substitution for the exercise of
independent judgment by any recipient. Each recipient of this document should make such investigations as it deems necessary to arrive at an independent evaluation of an investment in the securities of companies referred to in this document
(including the merits and risks involved), and should consult its own advisors to determine the merits and risks of such an investment. The investment discussed or views expressed may not be suitable for all investors. Certain transactions -including
those involving futures, options, another derivative products as well as non-investment grade securities - involve substantial risk and are not suitable for all investors. No representation or warranty, express or implied, is made as to the accuracy,
completeness or fairness of the information and opinions contained in this document. The Disclosures of Interest Statement incorporated in this document is provided solely to enhance the transparency and should not be treated as endorsement of the
views expressed in the report. This information is subject to change without any prior notice. The Company reserves the right to make modifications and alternations to this statement as may be required from time to time without any prior approval.
MOSL, its associates, their directors and the employees may from time to time, effect or have effected an own account transaction in, or deal as principal or agent in or for the securities mentioned in this document. They may perform or seek to perform
investment banking or other services for, or solicit investment banking or other business from, any company referred to in this report. Each of these entities functions as a separate, distinct and independent of each other. The recipient should take this
into account before interpreting the document. This report has been prepared on the basis of information that is already available in publicly accessible media or developed through analysis of MOSL. The views expressed are those of the analyst, and
the Company may or may not subscribe to all the views expressed therein. This document is being supplied to you solely for your information and may not be reproduced, redistributed or passed on, directly or indirectly, to any other person or
published, copied, in whole or in part, for any purpose. This report is not directed or intended for distribution to, or use by, any person or entity who is a citizen or resident of or located in any locality, state, country or other jurisdiction, where such
distribution, publication, availability or use would be contrary to law, regulation or which would subject MOSL to any registration or licensing requirement within such jurisdiction. The securities described herein may or may not be eligible for sale in all
jurisdictions or to certain category of investors. Persons in whose possession this document may come are required to inform themselves of and to observe such restriction. Neither the Firm, not its directors, employees, agents or representatives shall
be liable for any damages whether direct or indirect, incidental, special or consequential including lost revenue or lost profits that may arise from or in connection with the use of the information.
The person accessing this information specifically agrees
to exempt MOSL or any of its affiliates or employees from, any and all responsibility/liability arising from such misuse and agrees not to hold MOSL or any of its affiliates or employees responsible for any such misuse and further agrees to hold MOSL
or any of its affiliates or employees free and harmless from all losses, costs, damages, expenses that may be suffered by the person accessing this information due to any errors and delays.
Registered Office Address: Motilal Oswal Tower, Rahimtullah Sayani Road, Opposite Parel ST Depot, Prabhadevi, Mumbai-400025; Tel No.: 022-3980 4263; www.motilaloswal.com. Correspondence Address: Palm Spring Centre, 2nd Floor, Palm
Court Complex, New Link Road, Malad (West), Mumbai- 400 064. Tel No: 022 3080 1000. Compliance Officer: Neeraj Agarwal, Email Id:
na@motilaloswal.com,
Contact No.:022-38281085.
Registration details of group entities.: MOSL: SEBI Registration: INZ000158836 (BSE/NSE/MCX/NCDEX); CDSL: IN-DP-16-2015; NSDL: IN-DP-NSDL-152-2000; Research Analyst: INH000000412. AMFI: ARN 17397. Investment Adviser:
INA000007100.IRDA Corporate Agent-CA0541. Motilal Oswal Asset Management Company Ltd. (MOAMC): PMS (Registration No.: INP000000670) offers PMS and Mutual Funds products. Motilal Oswal Wealth Management Ltd. (MOWML): PMS
(Registration No.: INP000004409) offers wealth management solutions. *Motilal Oswal Securities Ltd. is a distributor of Mutual Funds, PMS, Fixed Deposit, Bond, NCDs, Insurance and IPO products. * Motilal Oswal Commodities Broker Pvt. Ltd. offers
Commodities Products. * Motilal Oswal Real Estate Investment Advisors II Pvt. Ltd. offers Real Estate products. * Motilal Oswal Private Equity Investment Advisors Pvt. Ltd. offers Private Equity products
23 May 2018
4