11 June 2018
Motilal Oswal values your support in the
Asiamoney Brokers Poll 2018 for India
Research, Sales and Trading team.
We
request your ballot.
Today’s top research theme
Consumer: Consumption demand set to pick up in FY19
HUVR, TTAN, BRIT, PAG remain our top picks
4QFY18 results for Consumer/retail companies under coverage were largely in
line with expectations. The outstanding performers for the quarter were HUVR,
PAGE, TITAN and UBBL. Visibility on growth is also high for these companies
going forward.
Disappointment (albeit marginal) on earnings in 4QFY18 came from Marico,
Emami (HMN), Future Consumer (FCL) and P&GHH. BRIT reported in line
numbers and outlook remains robust. Two themes are emerging in the
Consumer space (a) outlook on rural is improving quarter after quarter which
augurs very well for companies with high rural exposure or incrementally high
rural growth and (b) Titan and Pidilite are emerging as early and likely
significant beneficiaries of GST implementation.
Our top picks taking all of these factors into account are HUVR, Titan, BRIT and
PAGE.
Market snapshot
Equities - India
Close
Chg .%
Sensex
35,444
-0.1
Nifty-50
10,768
0.0
Nifty-M 100
18,831
0.5
Equities-Global
Close
Chg .%
S&P 500
2,779
0.3
Nasdaq
7,646
0.1
FTSE 100
7,681
-0.3
DAX
12,767
-0.3
Hang Seng
12,166
-2.0
Nikkei 225
22,695
-0.6
Commodities
Close
Chg .%
Brent (US$/Bbl)
76
-1.3
Gold ($/OZ)
1,299
0.2
Cu (US$/MT)
7,324
-0.1
Almn (US$/MT)
2,296
-0.3
Currency
Close
Chg .%
USD/INR
67.5
0.6
USD/EUR
1.2
-0.3
USD/JPY
109.6
-0.2
YIELD (%)
Close
1MChg
10 Yrs G-Sec
7.9
-0.05
10 Yrs AAA Corp
8.8
-0.05
Flows (USD b)
8-Jun
MTD
FIIs
0.0
0.4
DIIs
0.1
0.4
Volumes (INRb)
8-Jun
MTD*
Cash
315
320
F&O
4,894
8,183
Note: YTD is calendar year, *Avg
YTD.%
4.1
2.3
-10.9
YTD.%
3.9
10.8
-0.1
-1.2
3.9
-0.3
YTD.%
13.4
-0.3
1.6
1.8
YTD.%
5.7
-2.0
-2.8
YTDchg
0.6
0.9
YTD
0.2
7.7
YTD*
368
8,199
Research covered
Cos/Sector
Consumer
Sun Pharma
Tata Motors
Fuel Or Engines
Key Highlights
Consumption demand set to pick up in FY19
Halol resolution in sight; status changed to VAI
JLR’s May 2018 wholesales in-line at 48.8k units
GDP growth to remain sub-7% in FY19
Piping hot news
6 more state-run banks may come under PCA
Six more state-run banks are at risk of entering the Reserve Bank of India’s
prompt corrective action (PCA) framework, officials said. These include Punjab
National Bank, Union Bank of India and Syndicate Bank, they said, adding that
this may reduce the chances of the finance ministry’s plans to sell the good
loans of weak banks to stronger lenders coming to fruition.
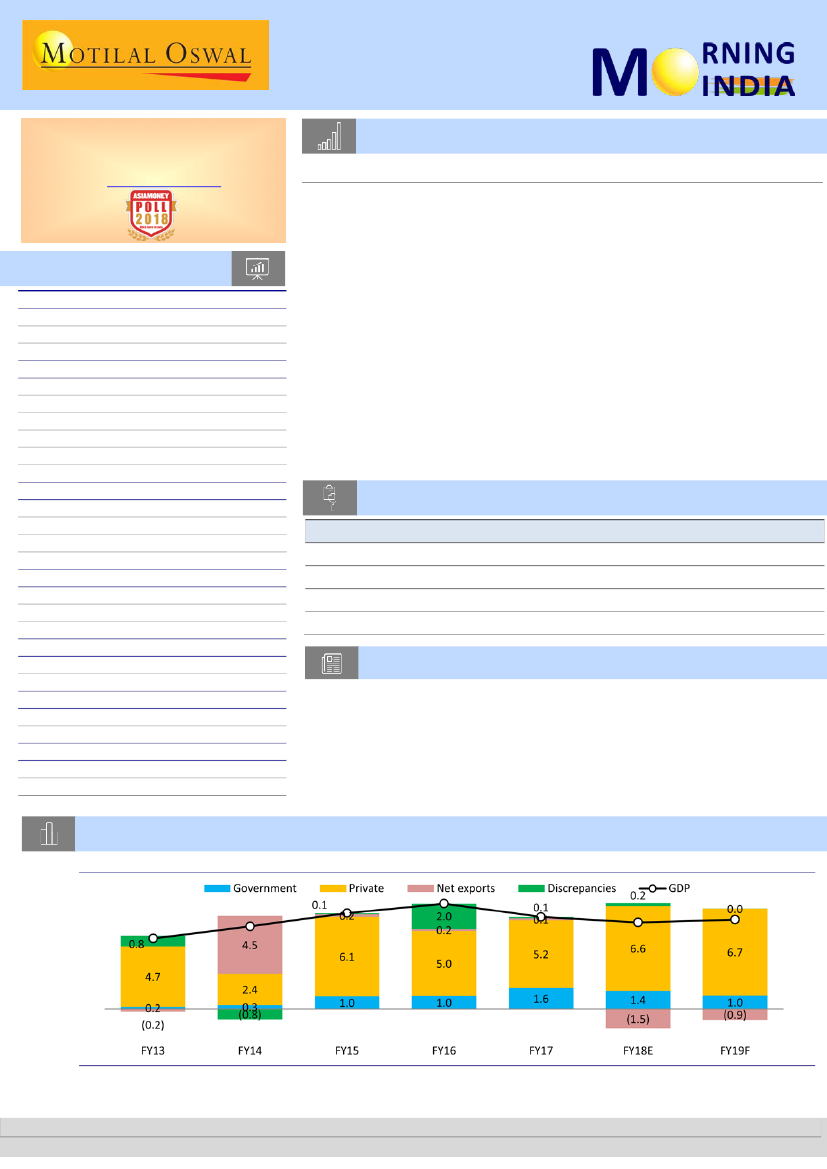
Chart of the Day:
Fuel Or Engines (Economy): GDP growth to remain sub-7% in FY19
Key drivers of GDP growth since FY13 (percentage points)
Spending = consumption + investment
F = Forecasts
E = Sectoral break-up not yet available for FY18, thus our estimates
Source: Central Statistics Office (CSO), RBI, CEIC, MOSL
Research Team (Gautam.Duggad@MotilalOswal.com)
Motilal Oswal research is available on www.motilaloswal.com/Institutional-Equities, Bloomberg, Thomson Reuters, Factset and S&P Capital.
Investors are advised to refer through important disclosures made at the last page of the Research Report.

In the news today
Kindly click on textbox for the detailed news link
1
As multi-agency probe continues
in India into alleged lapses
involving ICICI Bank's chief Chanda
Kochhar and her family members,
the matter has also come under
the scanner of the US markets
regulator SEC…
2
Carlyle to sell its 33% holding in PNB Housing Finance
Buyout firm Carlyle is looking to sell its entire stake in PNB Housing
Finance in a deal that would yield a return that’s several times the money
it invested three years ago, said two people aware of the development.
PNB Housing Finance, which listed in Mumbai in November 2016 after a Rs
3,000-crore initial public offer, has seen its market value almost double
since then. Carlyle had invested Rs 1,600 crore in February 2015 for a 49%
stake in the then unlisted company…
ICICI Bank, Chanda Kochhar face
US regulatory probe; Indian
agencies may seek foreign help
3
Tata Motors open to stake sale
in finance arm TMFL, aims
Rs50,000 crore AUM by 2020
Tata Motors is open to divesting
stake in its financing arm, Tata
Motors Finance, which is expected
to have Rs50,000 crore of assets
under management by 2020,
according to company officials…
4
NBFC must implement Ind AS
from April 1: Govt
The Centre has rejected Non-
Banking Finance Companies
(NBFC)s’ request to defer Ind AS
implementation by one year as
has been done for banks.
Confirming this decision, a
Government official said that
NBFCs will have to implement Ind
AS from April 1 this year…
5
PNB expects Rs 8,000 cr
recovery from NPAs this
month
Enthused by the successful
resolution of Bhushan Steel,
Nirav Modi fraud-hit Punjab
National Bank (PNB) is hopeful of
Rs 8,000 crore recovery from bad
loans in the first quarter of the
current fiscal…
6
Shree Cement plans to close
United Cement deal by July
Shree Cement Ltd, one of India’s
top three cement makers, has
budgeted for a capital
expenditure of ₹3,500 crore in
the current financial year, which
includes ₹2,000 crore to be
spent to conclude the acquisition
of a United Arab Emirates-based
(UAE) firm…
7
Indian Hotels, Sarovar, The
Byke in race to acquire The
Connaught
Indian Hotels Co. Ltd (IHCL),
which runs the Taj chain of
hotels, and Sarovar Hotels Ltd
are among the three hotel chains
vying for New Delhi’s The
Connaught, an 85-room premium
hotel, which was shut down two
years ago…
11 June 2018
2

Sector Update | 8 June 2018
Consumer
Motilal Oswal values your support
in the Asiamoney Brokers Poll
2018 for India Research, Sales and
Trading team.
We
request your ballot.
Consumption demand set to pick up in FY19
HUVR, TTAN, BRIT, PAG remain our top picks
Sales largely in line for our coverage universe
Fourth quarter revenue growth of 7.5% YoY for our consumer coverage universe
was largely in line with our estimate of 8.3% YoY growth, mainly driven by an uptick
in volumes. Around 75% of our consumer universe reported EBITDA that was either
in line or above our estimates. Aggregate EBITDA margin for our coverage
companies expanded 160bp YoY (our estimate: +60bp YoY). It was a decent overall
performance by our coverage universe – some companies impressed with stellar
results and some delivered in-line performance. A few names did disappoint, but
there were no big misses.
Our coverage companies that delivered standout results for 4QFY18
Hindustan Unilever (HUVR; with 7% EBITDA beat), Page Industries (PAG; 17.5%
EBITDA beat), Titan (TTAN; 19.9% EBITDA beat) and United Breweries (UBBL;
15.9% EBITDA beat) delivered the best performance within our consumer
coverage universe in 4QFY17. These four companies exceeded our expectations
on all fronts, i.e. sales, EBITDA and PAT.
Even on a full-year basis, these companies delivered impressive results. The
outlook for FY19, too, appears extremely upbeat. We have a Buy rating on all
the four stocks, given their (i) sustained strong performance in a period when
have peers struggled, (ii) higher visibility on medium-term growth and (iii)
structurally strong longer-term growth stories.
A few consumer companies delivered subdued fourth quarter results, but we
note that their numbers were not very poor.
Although Marico (MRCO - 9% EBITDA miss), Procter & Gamble Hygiene &
Healthcare (PGHH - 19.8% EBITDA miss – the only big miss), Emami (HMN - 8%
EBITDA miss) and Future Consumer (FCL - 14.7% EBITDA miss, but the margins
tend to be volatile in early stage of growth; had some impact of mix change;
sales, though, were better than expectations) disappointed, we note that their
4QFY18 performance does not really reflect the business quality from a
medium- to long-term perspective.
HMN is likely to perform extremely well over the next two years once the GST
impact on the wholesale channel abates. We are also bullish on the longer-term
prospects of FCL. We have a Buy rating on both HMN and FCL. On the other
hand, we have a Neutral rating on MRCO and PGHH because of their fair
valuations and poor visibility on their near-term earnings growth.
Our coverage companies that underperformed in 4QFY18
11 June 2018
3

We highlight below two key themes to watch out for in FY19 and even beyond:
1. Rural momentum coming back
Rural growth has been outpacing urban growth over the last three quarters. This
trend is likely to accelerate in FY19, benefiting companies with a higher rural
sales mix.
Forecast of a normal monsoon in FY19, the likely absence of disruptive events
(like demonetization or GST), higher minimum support price for Kharif crops, a
robust new launch pipeline and distribution expansion (undertaken by most
companies in the last 3-4 years) lend confidence about a further recovery in
rural growth.
Stocks in focus:
HUVR, Britannia (BRIT), HMN, Colgate-Palmolive India (CLGT)
and Dabur. These are our preferred names to play the rural recovery theme.
The GST did cause short-term challenges in trade channel, but is expected to be
a game-changer for categories with a higher unorganized sector share.
TTAN has already been a key beneficiary of value migration unfolding in the
Indian jewelry retailing space. On the consumption side, we believe PIDI will
incrementally benefit from the shift from unorganized to organized trade for
adhesives.
Stocks in focus:
TTAN and PIDI.
HUVR:
Hindustan Unilever will be a key beneficiary of the confluence of positive
factors likely to drive rural volumes and the strong premiumization trend.
Maintain Buy.
TTAN:
Recent developments in the sector are only strengthening the case for
further rapid growth of the Tanishq business. Management’s optimism about
the Jewelry business is being reflected in its revised strong guidance of 20%
CAGR for the next five years, sharply increased store expansion target of 40 in
FY19, and commentary about further margin expansion led by operating
leverage. Maintain Buy.
BRIT:
Given (a) continuing investment in R&D and own manufacturing facilities,
and (b) leveraging of its enviable and consistently improving distribution,
Britannia will keep finding additional growth levers. Maintain Buy.
PAG:
Page offers a compelling, capital-efficient long-term lifestyle play on the
growing and premiumizing innerwear category. Maintain Buy.
HMN:
We believe that Emami remains a credible long-term play due to (a) likely
healthy growth in existing product categories, where it has a dominant market
share, (b) best-of-breed R&D and A&P spend resulting innovative products, as
well as ability to back up innovation with strong marketing and (c) much-needed
efforts on improving its direct distribution reach. Maintain Buy.
UBBL:
Long-term volume and earnings growth opportunity (FY18 PAT at
USD58m) is immense for India’s largest beer player, with strong barriers to entry
in the form of distribution, brewery reach, scale and brands. Operating
environment appears to be improving, indicating continuing strong pace of
earnings growth going forward. Maintain Buy.
2. One year into GST – which companies are the beneficiaries?
Valuation and view
11 June 2018
4

11 June
2018
Sun Pharma
BSE SENSEX
35,444
S&P CNX
10,768
Update
| Sector:
Healthcare
CMP: INR528
TP: INR610 (+16%)
Buy
Motilal Oswal values your support in
the Asiamoney Brokers Poll 2018 for
India Research, Sales and Trading
team. We
request your ballot.
Halol resolution in sight; status changed to VAI
Raising target price; maintain Buy
US FDA today changed the status of Sun Pharma’s (SUNP) Halol facility to voluntary
action indicated (VAI). After its inspection in February 2018, this plant had received three
483 observations. Though this does not mean that the warning letter has been lifted, it
provides comfort around the management’s guidance of a resolution for the Halol facility
by mid-FY19.
Stock Info
Bloomberg
Equity Shares (m)
52-Week Range (INR)
1, 6, 12 Rel. Per (%)
M.Cap. (INR b)
M.Cap. (USD b)
Avg Val, INRm
Free float (%)
SUNP IN
2,399.3
609 / 433
3/-5/-14
1,266.8
18.7
3157.0
45.6
Financials Snapshot (INR b)
2018 2019E 2020E
Y/E Mar
Net Sales
260.7 302.6 351.8
EBITDA
51.8
69.9
88.6
Rep. PAT
21.6
46.6
61.1
Rep. EPS (INR)
9.0
19.4
25.4
Gr. (%)
-69.0 115.8
31.1
BV/Sh (INR)
158.4 170.7 189.2
RoE (%)
9.0
11.8
14.8
RoCE (%)
8.1
11.5
14.4
P/E (x)
37.6
27.2
20.7
P/BV (x)
3.3
3.1
2.8
Shareholding pattern (%)
As On
Mar-18 Dec-17 Mar-17
Promoter
54.4
54.4
54.4
DII
16.2
14.9
12.2
FII
16.3
17.2
21.3
Others
13.1
13.5
12.1
FII Includes depository receipts
Stock Performance (1-year)
Sun Pharma.Inds.
Sensex - Rebased
650
570
490
410
Background:
The Halol facility received 23 483 observations post US FDA
inspection in September 2014. Later, in December 2015, US FDA had issued a
warning letter for the facility. In November/December 2016, US FDA re-
inspected the facility and issued nine 483 observations and maintained OAI
status. OAI is given when objectionable conditions are found and regulatory
action should be recommended. In February 2018, US FDA re-inspected the
facility, and this time, issued three 483 observations, with no data integrity
issue and no repeat observation, following which it received VAI status today
(Link). VAI status is given when objectionable conditions are found and
documented, but the agency is not prepared to take or recommend regulatory
action.
Key product approvals linked to Halol facility:
Halol is SUNP’s largest facility
supplying to the US market. SUNP’s US business has been under pressure since
the warning letter, as it has not received any product approval from this facility
in three and a half years. The facility contributes 8-10% of US sales for SUNP,
currently – down from >15% at the time of warning letter. Resolution of the
Halol issue is critical for the company, as it would provide visibility on key
approvals including Xelpros, Elepsia, Vagifem, etc. (It has initiated the process
of site transfer of key products including Xelpros and Elepsia). We expect
incremental sales of ~USD100m from this facility post resolution.
Expect specialty business commercialization from FY19; operating breakeven
in FY20:
We expect pick-up in US sales from FY19, driven by launch of Yonsa in
1QFY19, and commercialization of Ildrakuzumab in the US by 3QFY19 (received
approval in March 2018) and Seciera in FY19. SUNP is currently spending ~4.5%
of sales on specialty business R&D, which is not fetching any returns. The
management expects to achieve EBITDA breakeven in the specialty business by
FY20 (which would mean contribution of USD225m-250m at the EBITDA level).
We expect revenue of USD400m-450m over the next 4-5 years from new
launches in SUNP’s specialty business, more than double any other Indian
peer’s.
Specialty products to drive growth; Halol resolution key catalyst ahead:
Ramp-up of specialty products and resolution of the Halol plant will be the key
growth drivers for SUNP. We maintain Buy, with a revised TP of INR610 (24x
FY20E EPS). Our earlier TP was INR560 (22x FY20E EPS). We have increased our
target multiple, given enhanced visibility of Halol resolution by 2HFY19.
5
11 June 2018

Tata Motors
BSE SENSEX
35,444
S&P CNX
10,768
8 May 2018
Update
| Sector:
Automobiles
CMP: INR310
TP: INR471(+52%)
Buy
Motilal Oswal values your support in
the Asiamoney Brokers Poll 2018 for
India Research, Sales and Trading
team. We
request your ballot.
JLR’s May 2018 wholesales in-line at 48.8k units
Jaguar volumes up 21% YoY; Land Rover dispatches down 2.9% YoY
Stock Info
Bloomberg
Equity Shares (m)
52-Week Range (INR)
1, 6, 12 Rel. Per (%)
M.Cap. (INR b)
M.Cap. (USD b)
Avg Val, INRm
Free float (%)
TTMT IN
3,396.6
471 / 282
-7/-31/-46
972.9
15.4
3731.0
63.6
2020E
3,738
537.0
179.6
52.9
22.5
379.6
15.0
8.1
5.9
0.8
Financials Snapshot (INR b)
Y/E March
2018 2019E
Net Sales
2,946 3,386
EBITDA
369.7 468.2
NP
77.8 146.6
Adj. EPS (INR)
22.9
43.2
EPS Gr. (%)
15.7
88.4
BV/Sh. (INR)
281.0 325.4
RoE (%)
10.1
14.2
RoCE (%)
6.4
7.4
P/E (x)
13.5
7.2
P/BV (x)
1.1
1.0
Shareholding pattern (%)
As On
Mar-18 Dec-17 Mar-17
Promoter
36.4
36.4
34.7
DII
17.7
17.1
15.5
FII
20.3
21.4
23.2
Others
25.7
25.1
26.6
FII Includes depository receipts
Stock Performance (1-year)
Tata Motors
Sensex - Rebased
570
490
410
330
250
JLR’s wholesale volumes grew 3.5% YoY (16.4% MoM) to 48.8k units
(including China JV’s 7k units) in May 2018.
Jaguar volumes grew 21.1% YoY to 15.3k units (in-line) while Land Rover
volumes declined 2.9% YoY to 33.5k units (in-line).
JLR’s retail volumes increased 6.1% YoY (6.9% MoM) to 48.3k units, as Jaguar
retails grew 6.6% YoY (9.2% MoM) to 14.5k units, while LR retails increased
6% YoY (5.9% MoM) to 33.8k units.
The growth in Jaguar volumes was led by E-pace (3.7k units). Volumes of
other models like XF declined 24.6% YoY, F-Pace declined 23.1% YoY, and XE
declined 5.6% YoY.
Land Rover’s retail volumes increased 6% YoY to 33.8k, led by Discovery
(+13.9% YoY), RR Sport (+0.7% YoY), and Velar (5.4k units).
Region-wise, UK sales grew 20.9% and US sales grew 16.7%. Sales declined
8.1% in China and 8.7% in Europe.
Mr Felix Brautigam, Jaguar Land Rover Chief Commercial Officer said,
“Strong
demand for Land Rover vehicles drove our performance in May,
particularly in the US and UK. The new, award winning Range Rover Velar
was an important contributor. Also, our latest Range Rover and Range
Rover Sport models, including plug-in hybrid options, have been performing
particularly well in key markets.”
On decline in retail sales in China, he said,
“China is a key market for us and
we welcome the reduction in import tariffs announced in May. Although
there has been an initial drop in sales, as customers weigh up what it means
for them, all indications are that this will be temporary and the move mid-
term will further strengthen demand.”
The stock trades at 7.2/5.9x FY19E/20E consolidated EPS. Maintain
Buy
with a
target price of INR471 (March 2020E SOTP-based).
11 June 2018
6

F
UEL
GDP growth to remain sub-7% in FY19
Faster growth in consumption to offset weakness in other components
R
E
NGINES
8 June 2018
F
RIEND
O
F
T
HE
E
CONOMY
India’s real GDP is forecast* to grow 7.3-7.4% in FY19, up from 6.7% in FY18. In its monetary policy this week, while the
Reserve Bank of India (RBI) highlighted higher crude oil prices as an upside risk to inflation, it maintained the real GDP growth
forecast at 7.4% for FY19. Our recent study of the 2018-19 budgets of 20 major states reveals that real fiscal spending
(excluding interest payments) is budgeted to grow 6.6% in FY19 – the slowest pace in four years. Further, a sharp revival in
private investments in FY18 – grew 9.8% versus ~4% in FY17 – is attributable to ‘valuables’ and ‘household investments’. With
the base effect fading, household investments are unlikely to grow as fast and valuables are also likely to decline.
Consequently, private investments are expected to also grow slowly at 8.3% in FY19. Higher crude oil prices will also drive
current account deficit at ~2.5% of GDP, which will continue to act as a drag. It implies that the burden of pushing GDP
growth higher lies with private consumption. If real GDP has to post 7.4% growth, real PCE must grow 8.5% in FY19, as against
6.6% in FY18. Overall, while we expect private consumption to grow faster (at 7.5%) and drag from the external sector to be
lower in FY19, slower growth in fiscal spending and private investments is likely to keep real GDP growth at sub-7% for the
second consecutive year in FY19. Further, crude oil poses a downside risk to even 7% GDP growth in FY19.
Motilal Oswal values your support in
the Asiamoney Brokers Poll 2018 for
India Research, Sales and Trading
team. We
request your ballot.
Almost every market
participant is working with a
growth forecast of ~7.4%
for FY19, similar to RBI’s
expectations
India’s real GDP clocked a growth of above 7% every year between FY15 and FY17
and averaged 7.6% before easing to 6.7% in FY18. With the beginning of the new
financial year, almost every market participant is working with a growth forecast of
~7.4% for FY19, similar to that of Reserve Bank of India’s (RBI) expectation. This is
not surprising. At the beginning of the last year also, real GDP was expected to
grow ~7.5% in FY18 (versus an unrevised 7.1% in FY17). We, however, were not so
optimistic last year and pegged FY18 growth at 6.8% (see
here
or
here).
Of course,
the market participants revised down their growth forecasts in the middle of FY18 to
sub-7%, which actually turned out to be 6.7%. Two key reasons that had prompted
us to forecast sub-7% growth in FY18 were: (a) limited ability of fiscal spending to
support economic activity, and (b) trend reversal in net exports of goods & services,
which was expected to act as a drag on FY18 GDP growth in contrast to a boost to
GDP growth during the previous four years
(Exhibit 1).
We believe that real GDP
could grow at sub-7% for the second consecutive year in FY19.
Private
0.1
0.2
6.1
Net exports
2.0
0.2
5.0
1.0
Discrepancies
0.1
0.1
5.2
1.6
GDP
0.0
6.7
Exhibit 1:
Key drivers of GDP growth since FY13 (percentage points)
Government
0.2
0.8
4.7
0.2
(0.2)
FY13
4.5
6.6
2.4
0.3
(0.8)
FY14
1.0
1.4
(1.5)
1.0
(0.9)
FY19F
FY15
FY16
FY17
FY18E
Spending = consumption + investment
F = Forecasts
E = Sectoral break-up not yet available for FY18, thus our estimates
Source: Central Statistics Office (CSO), RBI, CEIC, MOSL
* The Reserve Bank of India (RBI), Survey of Professional Forecasters (SPF) released by RBI and the International Monetary Fund (IMF) forecast
7.4% growth in FY19 and the World Bank and Asian Development Bank puts it at 7.3%.
11 June 2018
7

In conversation
1. BANK OF BARODA : RBI move won't have material impact on
bank lending rates; PS Jayakumar, MD & CEO
Lending rate depends on the cost of funds and there has been a reasonable
increase in deposit rates in the last few months, a part of which has been passed
on through an increase in MCLR of banks. A part of the increase will be passed
on in the coming months. RBI's rate hike will not have a material impact on bank
lending rates. It will have a bigger impact on NBFCs and the bond market.
For 2017-18, bank’s corporate loans grew 17 per cent, while retail was up 42 per
cent. The share of retail loan book to total loan book increased from 20 per cent
to 23 per cent.
During the year, bank moved to a target market approach for growth in
corporate lending. However, in view of higher profitability on a risk adjusted
basis, granular nature of risk in portfolio, increasing consumer spending and
bank’s low share in retail lending, bank focused to increase the proportion of
retail loan book.
Would like to look at corporate exposure of 35-40 per cent. But that may take
18-24 months. Bank’s corporate loan growth has been higher than the average
industry credit growth. Lately, there has been increase in capacity utilization in
the private sector. Macro-economic indicators point to a pick-up in private
investment. Deleveraging of balance sheets of corporates is also happening.
The NCLT process being new, is taking some time to stabilize. NPAs have also
increased after revised RBI guidelines on resolution of stressed assets in
February 2018, dismantling the earlier mechanisms to deal with stress. What
these guidelines have effectively done is that they have front-ended the
recognition of stress, which would have been otherwise recognized over a
period of time. However, this marks the final stage of multi-year initiatives to
recognize NPAs.
2. TCS: WE WILL BE ENTERPRISE-AGILE BY 2020; Krishnan
Ramanujam, President
As a concept, being agile been around for decades. But now because of the
combination of collaboration and communication technologies, it is possible for
enterprises to adopt agile to deliver enterprise-class projects.
Doing things sequentially is called the waterfall model and that waterfall way of
working has been the bane of large programs. In effect, the company that is
putting its money at risk is taking a leap of faith that the returns will come five
years later, seven years later. Agile, on the other hand, gives the ability to break
up that big piece of work with a concept called minimum viable product. Do a
small thing, prove the benefits, and keep moving on. So the business benefits
are upfront. It eliminates a lot of work– which is just overhead–management
communication, handoffs, all that is not required today.
Company will be enterprise-agile by 2020 and have to go through a massive
internal transformation. Have to do it in four parts—agile-ready workforce,
agile-ready workplace, agile-ready offerings, and agile-ready partnerships (with
customers). By the end of this year, company will have over 600 agile-ready
workspaces with roughly between 100 and 150 people per workspace.
Even when customers signed large contracts, they gave a broad range. That
doesn’t change. The manner in which that range is consumed has changed. So
8
11 June 2018

company’s ability to plan, whether it is infrastructure or hiring will not
completely go for a toss. Company can make those changes in bits.
3. MINDA INDUSTRIES : Margin will be maintained at 12.5% in
FY19; Sudhir Jain, CFO
Will maintain same strong pace of growth in FY19 as capacity utilisation is
increasing & productivity is improving.
In the last 2-3 years, company has been growing its topline at 20-25%. Target to
maintain a similar growth in terms of topline, turnover and bottomline.
Margin will be maintained at 12.5% in FY19.
Expect growth of 4-wheeler switches to improve substantially.
Electric vehicles is a big opportunity. Have already mapped existing components
that will go into EVs and identified new opportunities.
Looking at an investment of INR 150 crores into a new R&D center in Pune and
1/3rd of it has already been made. Enough internal accruals so not planning to
borrow or raise funds.
Company has merged 14 joint venture companies into itself during a long
consolidation process.
4. BLUE STAR: Anticipate margin hit on delayed price hike;
B Thiagarajan, MD
Since there is an excess inventory of two to three months, price hike may be
shifted to August. Expect a hit on margin in the first quarter due to a delay in
increasing the price of air conditioners.
South and East sales were down due to rains. West and North did reasonably
well in May and North should do better in June.
April-June is not going to be good but for the rest of the year, market will grow.
Expect the room air-conditioner market to grow 10 percent by the end of the
year, as penetration of the industry is relatively low in India and there are many
first-time buyers.
11 June 2018
9

From the think tank
1. Is the Indian Economy on an upswing now?
The Indian economy has shown a strong V-shaped recovery driven largely by
domestic growth impulses. If one considers nine consecutive quarters since the
fourth quarter of 2015-16, Gross Domestic Product (GDP) growth fell quarter after
quarter from a peak of 9% to a trough of 5.6% in the first quarter of 2017-18. As is
widely recognised, this was due to demonetisation and the transitory adverse
effects of the goods and services tax implementation. These eventually subsided
and for the last three quarters, growth steadily recovered to 6.3%, 7.0% and 7.7%
in the second, third and fourth quarters of 2017-18, respectively. This sharp
recovery is based entirely on domestic factors as the contribution of net export
growth to GDP has been zero or negative since the third quarter of 2016-17. From
the demand side, two segments which have supported growth, particularly in the
fourth quarter of 2017-18, are government consumption and overall investment
demand. The growth in gross fixed capital formation was as high as 14.4% in the
fourth quarter of 2017-18. The real investment rate has also increased to 34.6% in
the fourth quarter of 2017-18, although paradoxically, the nominal investment
rate during this period remained below 31%. This difference is explained by
relatively lower implicit price deflator of investment goods when compared to
that for consumption goods.
2. Informal enterprises should be encouraged
There is a school of thought that is concerned about the extremes of capitalism
that have given rise to morally reprehensible practices by large enterprises.
These range from predatory lending and market manipulation in the financial
sector to tech companies’ abuse of personal data and emissions cheating in the
automobile industry. They threaten trust and cooperation, which is the
foundation of well-being and productivity. An alternative to these extremes is to
expand and embrace the broad base provided by small enterprises, which is the
biggest segment. This will not only provide a foundation to their well-being, but
also increase productivity and jobs. There is another school of thought that
small is not beautiful. Small enterprises are not productive, create bad jobs, and
are not connected with the rapidly changing forces of urbanization,
globalization, and technology. Which of these two schools of thought will better
shape India’s future? Are small and large enterprises friends or foes?
3. Pulses: Focus on expanding demand
The government seems to be at its wit’s end in addressing the issues confronting
the pulses market. New Delhi finds itself in an awkward position of having to face
growers’ ire despite a spate of policy interventions that have had little impact on
farm-gate prices. Pulse growers continue to suffer low prices for the second year
in a row. This is sure to impact planting intentions for the upcoming kharif crop.
Without exception prices of all major pulses — chana, tur/arhar, urad, moong —
are well below the specified minimum support price. Restrictions imposed on
imports including quantitative ceiling and customs duties have failed to exert any
meaningful impact on the domestic market. The government’s response to the
pulses market over the last three years has left much to be desired. In 2015-16, it
failed to read advance signals of an impending supply crisis and responded to
escalating market prices, especially at the retail level, through administrative
10
11 June 2018

action including imposition of stock limits, seizure of cargo and so on which left
the distributive trade utterly demoralised and wary.
International
4. The Italian economy’s moment of truth
Italy and Europe are at an inflection point. After an election in March in which
the anti-establishment Five Star Movement (M5S) and the far-right League party
captured a combined parliamentary majority, followed by months of
uncertainty, Italy has become the first major EU member state to be governed
by a populist coalition. M5S and the League both openly question the benefits of
eurozone membership, though neither party made leaving the euro a specific
commitment of their governing program in the election campaign, a failure that
Italian President Sergio Mattarella seized upon in vetoing key cabinet pick. They
also disdain globalization more generally. The League, in particular, is obsessed
with cracking down on immigration. On the domestic front, both parties have
promised to tackle corruption and topple what they see as a self-serving political
establishment, while introducing radical policies to reduce unemployment and
redistribute incomes.
11 June 2018
11

Click excel icon
for detailed
valuation guide
Valuation snapshot
Company
Automobiles
Amara Raja
Ashok Ley.
Bajaj Auto
Bharat Forge
Bosch
CEAT
Eicher Mot.
Endurance Tech.
Escorts
Exide Ind
Hero Moto
M&M
Mahindra CIE
Maruti Suzuki
Motherson Sumi
Tata Motors
TVS Motor
Aggregate
Banks - Private
Axis Bank
DCB Bank
Equitas Hold.
Federal Bank
HDFC Bank
ICICI Bank
IDFC Bank
IndusInd
J&K Bank
Kotak Mah. Bk
RBL Bank
South Indian
Yes Bank
Aggregate
Banks - PSU
BOB
BOI
Canara
Indian Bk
PNB
SBI
Union Bk
Aggregate
NBFCs
Aditya Birla Cap
Bajaj Fin.
Capital First
Cholaman.Inv.&F
n
Dewan Hsg.
GRUH Fin.
HDFC
HDFC Stand. Life
Indiabulls Hsg
L&T Fin Holdings
Reco
Buy
Buy
Buy
Buy
Neutral
Buy
Buy
Buy
Neutral
Buy
Neutral
Buy
Buy
Buy
Buy
Buy
Neutral
CMP TP % Upside
EPS (INR)
EPS Gr. YoY (%)
P/E (x)
P/B (x)
ROE (%)
(INR) (INR) Downside FY18 FY19E FY20E FY18 FY19E FY20E FY18 FY19E FY18 FY19E FY18 FY19E
786
145
2875
653
18421
1361
29560
1270
919
258
3634
911
250
8946
310
310
580
952
181
3450
806
19291
1845
35572
1530
982
301
4052
1026
274
10468
423
471
635
21
25
20
24
5
36
20
20
7
17
11
13
9
17
37
52
9
27.6
5.4
151.3
17.7
480.6
64.0
799.6
29.1
39.5
8.2
185.1
40.2
9.6
266.7
8.2
22.9
13.9
31.5
7.3
167.2
25.4
578.6
84.9
1,050.3
38.4
52.4
10.1
201.2
49.3
13.7
349.9
12.0
43.2
19.7
38.1
9.1
191.7
32.2
714.5
115.3
1,347.1
51.0
65.5
12.8
229.1
54.0
16.6
444.8
16.9
52.9
28.8
-1.5
23.9
7.3
37.9
1.6
-31.5
27.0
23.8
88.0
0.4
9.5
46.9
107.8
7.3
5.9
15.7
18.7
15.5
-92.8
13.8
-82.3
-1.3
19.4
-31.0
0.3
25.2
LP
21.3
27.3
-25.5
26.3
4.0
14.2
34.9
10.5
43.5
20.4
32.8
31.3
32.0
32.5
23.5
8.6
22.6
43.1
31.2
47.3
88.3
41.5
37.7
1,648
22.4
710.5
21.3
16.9
68.7
7.2
37.9
13.5
24.5
46.1
77.8
31.7
44.7
20.8
25.6
14.7
27.1
23.5
35.8
28.3
32.9
25.0
26.1
13.9
9.5
20.5
27.1
41.0
22.5
46.1
22.7
84.1
17.9
58.1
42.4
19.3
35.2
19.2
25.8
43.6
23.6
33.6
38.8
32.3
33.1
28.5
27.0
19.0
36.9
38.3
21.3
37.0
43.7
23.2
31.5
19.6
22.6
26.1
33.5
38.0
13.5
41.6
25.9
482.7
22.9
166.6
18.2
30.2
27.3
13.9
31.4
6.7
40.5
35.2
13.2
18.3
32.6
NM
NM
NM
14.0
NM
NM
NM
0.0
37.5
47.4
16.7
25.2
16.6
73.1
43.9
85.6
13.4
24.8
24.9
20.0
17.2
25.7
31.8
16.0
28.1
33.1
17.5
25.5
18.1
18.5
18.2
25.6
25.8
7.2
29.4
18.8
27.6
18.7
20.6
15.0
25.9
16.2
13.0
22.8
5.9
32.5
24.1
7.4
13.9
22.5
29.8
79.5
33.1
9.8
NM
14.4
NM
20.3
26.5
35.4
12.8
20.9
12.0
62.7
37.8
71.1
11.1
18.1
4.6
5.9
4.4
6.5
5.6
2.1
11.5
8.2
3.7
4.1
6.2
3.6
2.5
6.5
7.0
1.1
9.6
4.0
2.2
2.2
2.3
1.4
5.0
1.8
0.9
4.8
0.6
5.0
3.3
0.9
3.0
3.3
0.8
0.5
0.6
1.0
0.6
1.1
0.5
0.9
3.6
7.8
2.2
4.8
4.0
5.0
3.9
5.5
5.1
1.9
8.6
6.9
3.1
3.7
5.5
3.2
2.2
5.6
5.9
1.0
7.7
3.4
2.0
2.0
2.1
1.3
3.9
1.7
0.9
4.2
0.6
4.6
3.1
0.8
2.5
2.8
0.8
0.5
0.6
1.0
0.7
1.1
0.4
0.8
2.8
6.5
1.9
4.0
17.0
23.7
24.2
18.8
15.6
10.3
35.2
21.0
18.3
12.9
33.8
14.2
10.4
18.5
19.5
10.1
25.1
15.4
0.5
10.9
1.4
8.3
17.9
6.7
6.8
16.5
9.1
10.9
11.6
6.6
17.7
10.2
17.1
27.1
24.0
23.2
16.8
12.5
35.0
22.6
19.3
14.4
32.1
14.8
13.1
21.4
24.8
14.2
29.0
18.3
7.4
11.1
10.7
9.0
16.9
10.8
6.9
19.6
9.9
12.0
13.3
11.0
19.9
12.6
Buy
Neutral
Buy
Buy
Buy
Buy
Neutral
Buy
Buy
Buy
Buy
Buy
Buy
536 600
182 198
154 185
86
127
2050 2400
288 380
42
65
1890 2150
59
100
1319 1400
532 650
25
34
338 444
12
9
20
47
17
32
55
14
70
6
22
38
32
1.1
8.0
0.9
4.8
67.8
10.6
3.0
60.2
8.8
32.5
15.1
1.9
18.4
19.4
9.7
7.5
5.8
79.3
17.8
3.2
83.0
10.0
40.5
22.1
3.3
24.3
35.8
11.5
11.9
8.2
94.5
24.1
3.8
104.4
14.4
50.1
29.5
4.6
32.1
Buy
Neutral
Neutral
Buy
Neutral
Buy
Neutral
133
101
276
366
90
273
95
163
112
266
371
85
365
97
23
11
-4
1
-6
34
2
-9.8
-43.2
-63.5
26.2
-50.3
-5.4
-56.5
4.4
1.3
8.3
37.3
-9.6
19.0
-1.5
14.1
4.2
39.9
45.6
8.0
35.2
5.7
PL
LP 218.0
Loss
LP 230.0
PL
LP 378.2
-10.4 42.5 22.1
PL
Loss
LP
PL
LP
85.6
PL
Loss
LP
PL
LP 145.2
NA
45.6
38.9
35.5
26.2
21.9
5.3
23.5
31.5
29.5
41.5
33.9
30.2
20.4
38.4
16.6
16.1
20.4
20.6
37.4
42.1
33.4
27.5
19.1
22.8
20.4
18.9
25.8
20.9
49.3
-5.8 2.7
-17.8 0.6
-12.2 1.8
8.3 11.0
-29.6 -6.8
-3.8 7.6
-23.8 -0.7
-8.0 4.1
12.4 12.1
20.7 20.1
13.7 15.6
20.6 20.7
Buy
Buy
Buy
Buy
Buy
Neutral
Buy
Buy
Buy
Buy
141 215
2205 2450
571 960
1568 1930
621 765
363 300
1840 2225
472 475
1205 1650
168 240
53
11
68
23
23
-17
21
1
37
43
3.8
46.5
34.2
62.3
37.4
5.0
42.0
5.5
90.2
6.8
5.3
62.3
44.6
75.0
51.7
5.8
48.7
6.6
108.8
9.3
7.5
83.1
56.8
89.3
63.5
7.0
57.9
8.4
131.5
13.9
2.2 2.0 14.1 17.4
21.5 17.8 32.6 31.0
4.9 4.3 18.4 17.5
3.1 2.6 21.7 21.7
4.0 3.4 30.7 33.2
2.7 2.4 13.4 14.1
11 June 2018
12

Click excel icon
for detailed
valuation guide
CMP TP % Upside
(INR) (INR) Downside
495 610
23
599 750
25
488 600
23
392 470
20
1135 1750
54
556 710
28
22
35
EPS (INR)
FY19E FY20E
45.0
53.5
31.1
38.9
20.7
26.5
44.8
48.9
65.7
87.3
37.7
44.3
175.9
141.5
Valuation snapshot
ROE (%)
FY18 FY19E
17.0 17.2
21.3 17.8
10.5 13.1
24.1 21.4
14.3 16.5
16.9 16.7
12.7 16.3
13.1 19.5
14.6 15.9
Company
Reco
LIC Hsg Fin
Neutral
MAS Financial
Buy
M&M Fin.
Buy
Muthoot Fin
Neutral
PNB Housing
Buy
Repco Home
Buy
Shriram City
Buy
2298 2800
Union
Shriram Trans. Buy
1446 1950
Aggregate
Capital Goods
ABB
Sell
1239 1060
Bharat Elec.
Buy
119 150
BHEL
Sell
77
70
Blue Star
Neutral
675 790
CG Cons. Elec.
Buy
226 270
CG Power & Indu. Neutral
60
63
Cummins
Buy
691 850
Engineers India Buy
133 180
GE T&D
Neutral
301 305
Havells
Buy
552 640
K E C Intl
Neutral
357 410
L&T
Buy
1344 1650
Siemens
Neutral
1009 1185
Solar Ind
Neutral
1150 1100
Thermax
Buy
1159 1370
Va Tech Wab.
Buy
418 575
Voltas
Neutral
531 620
Aggregate
Cement
Ambuja Cem.
Neutral
206 255
ACC
Neutral
1315 1747
Birla Corp.
Buy
702 1020
Dalmia Bharat
Buy
2575 3403
Grasim Inds.
Neutral
1031 1122
India Cem
Neutral
119 145
JK Lakshmi Ce
Buy
332 451
Ramco Cem
Buy
748 918
Orient Cem
Buy
113 170
Prism Johnson Buy
109 137
Sagar Cements Not Rated 819
-
Sanghi Inds.
Buy
86
134
Shree Cem
Buy
16151 19731
Ultratech
Buy
3713 4818
Aggregate
Consumer
Asian Paints
Neutral
1277 1280
Britannia
Buy
5918 6870
Colgate
Buy
1229 1420
Dabur
Buy
382 435
Emami
Buy
1065 1380
Future Consumer Buy
54
75
Godrej Cons.
Neutral
1165 1155
GSK Cons.
Neutral
6452 6255
HUL
Buy
1595 1840
FY18
39.4
24.4
14.5
43.0
49.9
32.9
EPS Gr. YoY (%)
P/E (x)
P/B (x)
FY18 FY19E FY20E FY18 FY19E FY18 FY19E
3.0 14.3 18.7 12.6
11.0 2.0 1.8
62.2 27.5 25.2 24.6
19.3 3.7 3.2
104.9 42.9 27.9 33.6
23.5 3.2 2.9
45.6 4.1
9.2
9.1
8.7
2.0 1.7
57.7 31.8 32.9 22.8
17.3 3.1 2.7
13.1 14.3 17.5 16.9
14.8 2.7 2.3
19.5
24.7
27.2
8.1
-8.8
64.1
17.0
14.3
-29.8
-11.2
14.8
30.8
17.4
51.1
22.4
10.9
18.2
-1.2
27.6
11.9
15.2
29.5
31.3
-30.5
109.9
-15.3
-38.1
5.8
-12.3
LP
288.2
LP
29.5
1.1
-12.3
-0.4
1.9
13.5
18.0
7.2
-8.5
Loss
11.7
6.6
24.7
44.8
71.0
27.1
37.7
13.5
29.5
41.4
19.5
4.4
18.5
2.6
40.8
27.4
9.2
15.2
36.2
18.6
63.0
38.8
17.9
19.3
34.9
28.1
102.8
20.5
98.7
75.5
72.3
25.7
148.6
367.3
101.0
96.7
30.3
43.8
56.3
20.6
19.8
24.3
17.7
12.6
30.8
29.4
22.0
14.4
19.9
20.3
16.0
19.3
30.6
23.1
18.8
27.4
27.7
14.5
11.2
21.5
31.9
31.0
26.0
48.3
25.3
64.2
71.6
24.0
62.2
41.3
39.7
33.8
35.1
41.3
33.4
22.8
20.9
31.4
62.5
20.7
35.2
44.8
43.8
20.8
29.4
21.2
40.2
49.2
20.0
25.9
51.1
47.2
56.5
17.4
30.7
30.8
34.1
27.7
35.4
42.8
17.9
34.1
45.1
31.4
52.5
103.2
32.5
23.0
41.6
44.1
35.4
60.4
70.7
49.1
49.2
43.9
NM
55.2
38.8
65.1
15.7
12.2
24.7
45.4
18.2
27.2
31.7
36.7
19.9
24.8
20.7
28.6
38.6
18.3
22.5
37.5
39.8
34.6
12.5
26.0
25.8
25.3
21.7
17.5
35.5
9.0
19.4
26.2
24.9
21.1
22.1
16.2
11.7
31.9
30.6
22.7
49.9
55.1
42.1
42.4
36.0
190.0
48.0
34.3
55.1
2.8
2.6
4.6
2.4
2.2
3.9
100.8 145.9
69.1
118.2
-14
26
-10
17
19
5
23
36
1
16
15
23
17
-4
18
37
17
19.8
5.7
2.2
15.1
5.2
2.9
23.5
6.3
7.5
11.2
17.9
51.8
19.8
24.4
20.5
24.1
17.3
27.3
6.5
2.8
21.3
6.2
3.0
27.9
6.4
10.5
14.3
19.6
59.7
26.9
28.9
33.4
33.4
20.4
32.1
7.3
3.7
27.6
7.5
3.4
33.4
7.7
12.2
17.1
25.5
73.4
31.9
36.8
42.7
38.2
22.7
7.3 6.5 11.6 14.3
3.7 3.3 18.0 18.2
0.9 0.9 2.5 3.2
7.8 7.0 18.1 23.2
18.0 14.4 48.7 43.5
1.0 0.9 4.5 4.8
4.8 4.4 18.3 18.6
3.9 3.6 15.7 17.1
6.5 5.7 17.3 21.2
9.2 8.1 18.7 21.0
4.6 3.8 23.1 20.8
3.4 3.1 13.7 14.3
4.7 4.3 9.1 11.5
9.6 8.0 21.9 22.0
4.8 4.3 8.8 13.2
2.0 1.8 12.4 15.2
4.5 4.0 15.9 16.3
3.4 3.1 11.0 12.1
2.0
2.7
1.6
4.2
1.5
0.7
2.7
4.2
2.3
5.6
2.1
1.2
6.3
3.9
3.1
14.6
20.9
21.9
11.8
12.0
8.9
12.7
7.8
48.8
1.9
2.6
1.5
3.8
1.3
0.7
2.5
3.7
2.1
4.6
1.8
1.1
5.4
3.6
2.8
13.3
18.4
20.7
10.7
10.6
8.5
9.9
7.0
46.5
6.1
10.1
4.6
10.3
8.6
2.1
6.1
14.2
4.4
5.5
6.5
6.9
16.3
9.3
8.6
25.3
32.9
48.7
25.9
29.2
-2.8
24.9
21.2
78.1
7.8
12.4
8.9
11.2
15.9
3.6
9.8
15.7
10.3
22.8
12.0
10.8
18.2
12.2
12.2
27.9
35.5
50.5
26.5
31.3
4.6
23.2
21.4
86.4
24
33
45
32
9
22
36
23
50
25
57
22
30
6.0
8.1
47.4 60.7
19.8 40.2
60.2 72.6
57.4 114.1
3.5
6.1
7.4
12.7
23.9 30.0
2.2
5.4
1.1
5.0
25.2 50.6
3.7
7.3
388.5 506.3
84.3 121.2
10.7
79.6
50.6
107.6
143.0
10.0
21.8
37.2
8.7
7.0
70.6
9.8
683.8
171.3
0
16
16
14
30
40
-1
-3
15
21.1 25.6
83.6 107.4
25.0 29.2
7.8
9.0
24.3 29.6
-0.2
0.3
21.1 24.3
166.5 187.8
24.5 28.9
30.5
133.2
34.6
10.4
35.6
1.1
28.1
215.6
35.2
21.1 19.0
28.4 24.0
16.5 18.5
16.0 15.5
21.9 20.4
LP 284.7
14.9 15.9
12.8 14.8
18.1 21.8
11 June 2018
13

Click excel icon
for detailed
valuation guide
CMP
Reco
(INR)
Neutral
268
Neutral
426
Neutral
342
Neutral
9889
Buy
24643
Buy
1070
Neutral
9382
Not Rated 162
Buy
1231
Neutral
3351
TP % Upside
(INR) Downside
295
10
425
0
360
5
9535
-4
29440
19
1330
24
9390
0
-
1555
26
3435
2
EPS (INR)
FY19E FY20E
10.0
11.3
10.9
13.0
7.6
9.0
189.3 209.0
423.2 564.5
20.8
23.7
162.1 187.8
6.4
9.7
18.8
23.9
55.4
72.0
Valuation snapshot
P/B (x)
FY18 FY19E
6.4 6.0
6.8 6.6
17.3 15.1
27.9 24.8
32.4 25.4
15.2 12.3
37.7 31.8
2.2 2.1
12.2 10.5
19.4 12.8
13.4 12.1
ROE (%)
FY18 FY19E
22.3 23.0
13.4 17.1
34.0 35.8
40.3 50.2
41.0 43.6
26.1 26.4
57.0 59.7
4.9 8.5
15.8 17.2
19.6 21.2
26.5 28.4
Company
ITC
Jyothy Lab
Marico
Nestle
Page Inds
Pidilite Ind.
P&G Hygiene
Prabhat Dairy
United Brew
United Spirits
Aggregate
Healthcare
Alembic Phar
Alkem Lab
Ajanta Pharma
Aurobindo
Biocon
Cadila
Cipla
Divis Lab
Dr Reddy’s
Fortis Health
Glenmark
Granules
GSK Pharma
IPCA Labs
Jubilant Life
Laurus Labs
Lupin
Sanofi India
Shilpa Medicare
Strides Shasun
Sun Pharma
Torrent Pharma
Aggregate
Infrastructure
Ashoka Buildcon
IRB Infra
KNR
Constructions
Sadbhav
Engineering
Aggregate
Logistics
Allcargo Logistics
Concor
Gateway
Distriparks
Aggregate
Media
Dish TV
D B Corp
Den Net.
Ent.Network
Hathway Cable
FY18
9.2
8.2
6.4
140.0
311.1
18.1
131.3
3.5
14.9
33.7
EPS Gr. YoY (%)
P/E (x)
FY18 FY19E FY20E FY18 FY19E
9.5
8.8 13.4 29.1
26.8
-26.7 32.7 19.4 51.7
39.0
2.0 18.3 18.2 53.3
45.1
13.2 35.2 10.4 70.6
52.3
30.3 36.0 33.4 79.2
58.2
8.1 14.8 14.3 59.2
51.5
-1.2 23.4 15.8 71.4
57.9
-2.0 83.8 52.1 46.7
25.4
71.7 25.8 27.2 82.5
65.6
26.1 64.3 29.9 99.4
60.5
10.4 18.7 17.6 50.4
42.5
2.5
-21.1
-7.5
8.7
-39.2
19.1
28.8
-17.3
-13.3
-85.8
-27.5
-21.8
14.4
18.1
23.3
-10.9
-17.4
9.8
-0.7
-65.1
-46.5
-2.6
-17.4
Loss
17.5
14.9 12.0
29.3 31.4
-2.6 25.9
9.4
7.1
73.9 83.3
7.4 14.7
25.0 20.3
33.0 19.7
41.4 23.5
87.8 164.5
3.4 20.9
17.8 30.8
44.9 9.3
57.9 31.3
37.3 15.9
72.1 25.8
-22.5 32.5
14.2 15.5
79.6 23.4
42.6 75.0
38.5 31.1
-6.8 34.0
19.6 25.2
LP
9.0
231.0
1.9
32.6
3.7
19.9
33.2
18.5
13.4
98.1
21.5
28.0
31.8
32.8
99.5
19.5
13.9
66.7
36.2
16.4
30.4
17.3
36.7
31.3
31.8
37.7
26.3
26.9
NM
9.9
14.6
25.1
18.4
17.3
25.7
18.9
12.2
56.4
20.1
22.4
23.9
23.2
53.0
18.9
11.8
46.1
22.9
12.0
17.7
22.4
32.1
17.4
22.3
27.2
28.2
22.5
Neutral
Buy
Buy
Buy
Neutral
Buy
Neutral
Neutral
Neutral
Buy
Neutral
Buy
Neutral
Buy
Buy
Buy
Buy
Buy
Buy
Buy
Buy
Neutral
435
1953
978
572
609
364
558
1051
2063
146
557
79
2622
686
748
482
811
5200
402
358
528
1411
500
2400
1560
750
600
460
540
1200
2000
185
535
130
2500
785
1110
586
865
5600
593
481
610
1350
15
23
60
31
-1
26
-3
14
-3
27
-4
65
-5
14
48
21
7
8
48
34
16
-4
21.9 25.2
58.9 76.1
53.0 51.6
42.7 46.7
6.2
10.8
16.9 18.2
20.0 24.9
33.0 43.9
62.9 89.0
1.5
2.8
28.5 29.4
5.7
6.7
39.3 56.9
19.0 30.0
45.6 62.6
15.8 27.3
46.8 36.2
141.7 161.8
12.8 23.1
11.3 16.1
14.0 19.4
53.7 50.1
28.2
100.0
65.0
50.0
19.8
20.8
30.0
52.6
109.9
7.3
35.6
8.7
62.3
39.3
72.5
34.3
48.0
186.9
28.5
28.1
25.4
67.1
3.7 3.2 19.6 19.4
4.8 4.2 15.1 17.4
4.2 3.6 26.0 20.4
2.9 2.3 23.8 21.1
7.0 6.5 7.2 11.5
4.5 3.8 22.7 20.5
3.2 2.9 11.3 12.9
4.7 4.5 15.5 19.3
2.7 2.5 8.5 11.1
1.2 1.1 1.2 2.2
3.0 2.7 15.6 14.1
1.5 1.4 12.2 12.5
13.3 15.0 19.9 32.7
3.2 2.9 9.3 13.3
2.9 2.3 18.9 21.5
3.4 2.9 11.9 17.8
2.8 2.5 15.8 11.8
5.9 5.4 16.1 16.8
3.0 2.6 10.3 15.6
1.3 1.2 3.9 5.7
3.3 3.2 9.0 11.9
5.2 4.4 20.3 16.8
3.4 3.1 12.6 13.7
Buy
Neutral
Buy
Buy
240
238
282
323
290
290
375
450
21
22
33
39
-6.3
23.9
19.4
12.9
1.2
26.0
13.8
16.8
3.9
26.5
18.3
17.4
202.0 14.2 10.1 -30.2 5.8
9.1
1.4 1.2 14.6 14.1
20.5
19.2
15.7
12.7
25.4
17.8
23.1
3.4
3.0
2.4
1.4
3.5
1.9
3.0
3.0
2.6
2.1
1.3
3.3
1.8
2.8
1.9
2.2
2.1
3.4
2.0
26.5 15.5
12.5 14.4
12.8 13.2
9.5
9.4
5.0
8.8
10.8
13.4
10.1
12.3
61.8 -28.7
17.5
30.5
Buy
Buy
Buy
114 163
1358 1553
175
199
43
14
14
7.3
35.1
4.7
8.9
53.4
9.8
11.7
64.6
11.2
-23.1 23.2
12.5 52.1
30.5
21.0
15.7
38.7
37.3
34.7
-32.1 109.0 14.4
1.6
50.1
21.8
Buy
Buy
Neutral
Buy
Buy
74
260
92
684
29
95
324
90
770
47
29
25
-2
13
60
-0.4
17.6
-2.9
6.8
-0.2
2.9
20.5
0.1
14.9
0.8
4.3
24.9
4.0
22.0
2.0
PL
LP
46.4
NM
25.1 2.0
-13.8 16.4 21.6 14.8
12.7 2.5
Loss
LP 5,545 NM 1,296.3 2.1
-40.6 119.5 47.3 100.7 45.9 3.7
Loss
LP 161.9 NM
38.7 2.1
-2.1 7.7
18.4 18.2
-6.3 0.2
3.7 7.7
-1.2 5.2
11 June 2018
14

Click excel icon
for detailed
valuation guide
CMP TP % Upside
(INR) (INR) Downside
212 237
12
81
92
14
158 215
36
329 469
43
1409 1760
25
85
130
53
12
27
118
924 1200
30
557 690
24
EPS (INR)
FY19E FY20E
23.9
26.3
10.5
11.5
12.6
15.3
13.2
17.3
38.0
51.2
6.5
8.6
0.1
0.6
35.0
40.6
16.5
19.7
Valuation snapshot
ROE (%)
FY18 FY19E
14.0 12.4
12.8 9.1
14.3 18.4
9.0 11.8
12.2 15.3
-9.3 24.2
-15.8 2.4
25.2 28.4
19.6 19.4
11.0 14.7
12.8
26.7
-2.7
22.5
9.1
17.7
0.3
22.9
13.3
17.8
11.7
19.4
29.0
11.8
16.7
14.4
28.7
21.0
20.8
26.2
21.3
9.4
8.9
23.3
13.0
13.6
15.5
28.6
2.1
23.9
16.2
17.3
9.0
26.3
17.1
17.4
15.0
23.0
20.8
12.8
22.7
13.2
19.6
14.0
20.8
20.8
16.8
13.7
14.8
23.8
13.2
13.9
Company
Hind. Media
HT Media
Jagran Prak.
Music Broadcast
PVR
Prime Focus
Siti Net.
Sun TV
Zee Ent.
Aggregate
Metals
Hindalco
Hind. Zinc
JSPL
JSW Steel
Nalco
NMDC
SAIL
Rain Industries
Vedanta
Tata Steel
Aggregate
Oil & Gas
Aegis Logistics
BPCL
GAIL
Gujarat Gas
Gujarat St. Pet.
HPCL
IOC
IGL
Mahanagar Gas
MRPL
Oil India
ONGC
PLNG
Reliance Ind.
Aggregate
Retail
Jubilant Food
Titan Co.
Aggregate
Technology
Cyient
HCL Tech.
Hexaware
Infosys
KPIT Tech
L&T Infotech
Mindtree
Mphasis
NIIT Tech
Persistent Sys
Tata Elxsi
Reco
Neutral
Neutral
Buy
Buy
Buy
Buy
Neutral
Buy
Buy
FY18
23.9
13.2
9.6
9.1
26.7
-1.8
-0.9
27.7
14.5
EPS Gr. YoY (%)
P/E (x)
P/B (x)
FY18 FY19E FY20E FY18 FY19E FY18 FY19E
-7.5 0.1 10.2
8.9
8.9
1.2 1.0
78.9 -20.8 10.4
6.1
7.7
0.7 0.7
-9.5 31.0 21.6 16.4
12.5 2.4 2.3
41.1 45.1 31.8 36.3
25.0 3.1 2.8
29.9 42.4 34.7 52.8
37.1 6.1 5.3
PL
LP
30.7
NM
13.0 4.3 2.5
Loss
LP 411.6 NM
97.9 2.4 2.3
11.6 26.2 15.9 33.3
26.4 7.9 7.2
8.4 14.1 19.0 38.4
33.6 7.1 6.1
10.7 49.7 26.7 36.7
24.5 4.0 3.6
120.5
7.2
Loss
57.5
35.3
31.5
LP
238.1
40.7
76.5
74.8
64.5
3.0
20.5
32.0
38.5
2.4
11.0
16.5
31.0
-13.3
-1.2
-4.8
21.8
20.7
9.2
38.2
26.8
LP
30.2
98.0
6.4
3,179
48.5
33.0
25.2
43.2
53.5
-16.1
16.6
58.1
2.5
-21.0
-26.1
13.3
-10.3
-12.0
49.8
72.6
21.6
15.0
12.6
12.1 12.8
14.2 14.0
62.3
NM
0.2
14.7
3.2
14.5
4.7
9.0
-16.3 325.1
13.2
9.8
24.7 11.6
-25.1 8.3
4.3
13.6
27.9
15.0
9.4
24.2
7.5
14.9
23.0
12.9
0.0
9.1
6.1
7.7
16.8
6.8
10.6
31.4
26.1
26.9
11.8
8.0
11.0
10.5
10.9
13.0
23.9
9.6
19.4
21.7
18.6
41.4
8.2
16.8
39.2
15.6
7.5
7.4
27.7
16.3
7.4
9.9
11.1
16.3
16.1
11.9
90.0
71.1
73.3
19.0
14.8
26.1
19.5
21.5
25.1
29.9
25.3
23.5
19.0
31.8
9.3
11.1
37.7
11.3
7.3
8.5
9.9
6.6
8.7
6.7
9.5
27.0
9.8
14.4
24.8
15.3
9.5
10.0
24.5
18.1
8.5
6.6
6.4
13.4
14.0
10.6
64.7
55.2
56.2
17.2
13.9
22.8
16.9
18.1
20.3
23.6
20.4
19.2
16.3
27.4
1.5
3.5
0.8
3.0
1.3
1.5
0.9
2.0
1.6
1.3
1.6
6.8
2.2
1.9
6.2
2.1
2.0
1.5
5.6
4.0
1.5
0.9
1.0
3.5
2.0
1.6
1.4
2.9
0.8
2.4
1.1
1.4
0.9
1.6
1.4
1.1
1.4
5.7
1.9
1.7
5.1
1.9
1.7
1.3
4.7
3.6
1.3
0.9
0.9
2.9
1.7
1.5
Buy
Neutral
Buy
Buy
Buy
Buy
Neutral
Buy
Buy
Neutral
242
296
241
343
73
118
84
233
246
600
371
336
349
394
128
178
85
426
345
705
53
13
45
15
75
51
2
83
40
18
18.9
21.1
-8.5
23.3
5.0
13.1
0.3
23.7
21.3
71.9
26.1
26.8
6.4
30.4
10.0
13.9
8.4
35.2
28.3
90.0
29.3
30.6
10.4
30.5
10.3
14.6
7.1
39.8
35.3
67.4
Buy
Buy
Neutral
Buy
Neutral
Buy
Buy
Buy
Buy
Neutral
Buy
Buy
Buy
Buy
245
409
342
829
191
311
177
279
849
95
219
174
226
983
318
568
303
1122
187
507
263
384
936
120
297
218
320
1150
30
39
-11
35
-2
63
49
38
10
26
36
26
42
17
5.9
49.8
20.4
21.2
12.2
41.7
23.9
10.1
52.2
12.8
22.2
15.6
13.9
60.9
9.1
41.7
23.8
33.5
12.5
32.9
17.6
11.4
46.8
11.3
33.2
27.0
16.8
70.1
11.6
48.0
26.0
41.6
13.4
37.9
21.7
12.9
46.8
12.3
35.3
29.1
19.7
74.9
Neutral
Buy
2676 2450
896 1130
-8
26
29.7
12.6
41.4
16.2
54.4
20.5
180.6 39.1
39.5 28.8
50.9 30.3
24.8
4.5
21.2
3.1
6.4
19.6
38.0
13.2
19.8
7.2
37.7
10.3
6.9
14.2
15.1
18.3
24.0
26.7
23.9
22.3
16.4
16.2
18.2 15.7 20.3 24.3
15.6 14.0 23.9 26.7
15.9 14.2 21.7 25.2
3.4
3.5
6.6
4.4
3.3
7.6
6.2
3.9
3.7
3.0
10.6
3.1
3.2
5.6
3.9
2.8
5.9
5.3
3.6
3.3
2.9
8.4
18.1
25.0
26.9
24.1
18.1
24.0
26.4
24.2
Neutral
Neutral
Sell
Buy
Under
Review
Neutral
Buy
Neutral
Neutral
Buy
Buy
727 800
928 1050
432 390
1260 1400
272
1666
1028
1113
1070
768
1233
-
1700
1000
960
1100
860
1400
10
13
-10
11
38.2
62.6
16.6
64.8
12.7
42.2
66.9
18.9
74.5
15.0
82.3
43.5
54.6
55.7
47.0
45.0
47.1
72.2
21.0
82.3
16.6
92.9
53.9
59.8
66.6
57.2
53.4
15.4 16.7
33.1
18.8
14.6
16.2
16.7
37.6
32.7
24.3
18.3
18.2
18.7
34.3
2
-3
-14
3
12
14
66.3
34.4
44.0
45.6
40.4
38.7
11 June 2018
15

Click excel icon
for detailed
valuation guide
CMP TP % Upside
(INR) (INR) Downside
1748 1500
-14
706 810
15
264 300
14
1202 1400
16
Valuation snapshot
ROE (%)
FY18 FY19E
29.4 33.7
21.5 20.8
17.0 16.4
15.3 17.1
24.2 24.4
Company
Reco
TCS
Neutral
Tech Mah
Buy
Wipro
Neutral
Zensar Tech
Buy
Aggregate
Telecom
Bharti Airtel
Buy
Bharti Infratel
Neutral
Idea Cellular
Buy
Tata Comm
Buy
Aggregate
Utiltites
Coal India
Buy
CESC
Buy
JSW Energy
Sell
NHPC
Buy
NTPC
Buy
Power Grid
Buy
Tata Power
Neutral
Aggregate
Others
Arvind
Neutral
Avenue
Sell
Supermarts
BSE
Buy
Castrol India
Buy
Coromandel Intl Buy
Delta Corp
Buy
Interglobe
Neutral
Indo Count
Neutral
Info Edge
Buy
Kaveri Seed
Buy
MCX
Buy
Navneet
Neutral
Education
Oberoi Realty
Buy
Phoenix Mills
Buy
Quess Corp
Buy
PI Inds.
Buy
Piramal Enterp. Buy
SRF
Buy
S H Kelkar
Buy
Tata Chemicals Buy
Team Lease Serv. Buy
Trident
Buy
TTK Prestige
Neutral
UPL
Buy
V-Guard
Neutral
FY18
66.0
42.6
18.9
52.8
EPS (INR)
EPS Gr. YoY (%)
P/E (x)
P/B (x)
FY19E FY20E FY18 FY19E FY20E FY18 FY19E FY18 FY19E
75.6
81.4 -1.0 14.4 7.7
26.5
23.1 7.7 7.9
47.6
53.9 38.1 11.7 13.1 16.5
14.8 3.3 2.8
19.2
21.7 11.8 1.3 13.0 13.9
13.8 2.5 2.1
67.0
85.2
1.3 27.0 27.2 22.8
17.9 3.3 2.9
5.3
7.8
9.3
20.9
19.4 5.1 4.7
1.9
13.7
-12.3
7.5
5.6 -63.3 -53.8 197.1 92.4
14.2 -8.1 0.4
3.6
21.8
-10.5 Loss Loss Loss
NM
21.1 -67.2 115.3 182.9 174.0
-98.8 PL
LP 2,983.6
30.6 28.3 37.1
106.7 45.5 29.1
4.8 -21.2 37.9
3.2 -17.3 20.1
16.6
8.1 13.8
21.9 10.1 34.4
7.8
3.5 18.7
12.4 27.7
20.3
22.5
57.2
7.1
27.9
10.2
94.1
8.7
31.8
42.2
33.7
8.3
48.6
26.6
39.8
39.9
150.3
129.8
11.7
54.8
98.6
8.3
203.2
55.6
6.7
-1.4
68.4
6.0
2.9
38.8
89.8
35.1
-46.0
31.3
67.8
-14.6
21.6
31.9
9.0
-2.8
3.7
24.5
20.4
17.1
11.0
14.3
36.5
16.7
9.5
16.1
8.1
9.2
6.0
22.7
11.2
36.5
32.0
20.9
4.0
18.4
41.4
34.1
16.6
27.6
15.4
16.6
11.3
-3.4
30.9
38.3
18.5
26.1
30.2
38.5
19.5
45.8
18.7
15.4
19.2
12.1
15.1
13.3
24.7
10.9
12.1
12.9
14.6
13.5
33.4
123.3
19.1
24.9
19.9
39.2
20.3
11.1
53.4
16.5
39.1
23.5
37.9
40.5
53.2
30.7
30.9
23.5
32.7
15.3
65.6
11.0
43.8
16.1
46.4
377
297
64
603
581
346
85
730
54
16
33
21
4.1
13.6
-9.6
3.5
200.2 2.2 2.2 2.4 1.1
21.7 3.2 3.4 15.6 15.2
NM
1.0 1.3 -16.0 -21.9
80.8 34.4 24.1 9.4 35.1
-131 2.2 2.3 0.1 -1.7
11.0
10.3
17.9
9.0
10.6
9.6
12.3
10.6
27.5
93.5
17.6
25.6
19.2
31.5
16.8
9.5
48.1
14.4
28.7
17.1
10.2
31.5
40.4
24.3
20.2
18.9
27.5
16.1
41.8
8.3
34.3
15.3
34.9
9.3
1.2
1.1
0.9
1.3
1.8
1.4
2.0
2.8
8.6
1.1
1.1
0.9
1.2
1.6
1.2
1.9
2.6
36.5
9.2
4.6
8.5
10.9
15.2
10.7
15.1
8.6
78.0
11.0
6.1
9.8
11.6
17.8
10.3
17.7
9.8
290 394
1002 1407
75
61
27
36
162 215
199 287
78
77
36
40
-18
36
33
45
-1
19.2
75.5
3.0
2.4
13.4
15.4
5.3
26.3
97.5
4.2
2.9
15.2
20.7
6.3
408
1593
832
174
451
227
1183
71
1199
526
830
127
513
641
1161
819
2406
1888
232
739
2825
58
6041
712
208
460
900
1000
248
557
327
1318
95
1550
591
1050
149
654
737
1350
958
3300
2206
303
941
3400
83
5281
945
167
13
-44
20
43
24
44
11
35
29
12
27
17
27
15
16
17
37
17
31
27
20
43
-13
33
-20
12.2
12.9
43.5
7.0
22.7
5.8
58.3
6.3
22.5
32.0
21.2
5.4
14.8
17.0
47.4
6.8
23.5
7.2
70.2
7.4
24.9
36.6
28.9
7.5
21.3 18.4 18.9 21.1
1.4 1.2 7.6 6.8
16.9 15.8 69.1 63.8
4.2 3.7 22.1 20.6
3.8 3.5 12.3 11.5
6.4 6.0 41.3 37.0
1.5 1.2 13.9 14.1
6.9 6.3 13.4 13.7
3.4 3.1 20.9 22.7
3.1 2.9 7.9 10.4
3.9
2.9
3.4
5.3
5.9
1.8
3.1
3.9
1.7
10.6
1.0
7.5
3.9
11.3
3.5
2.3
2.7
4.6
5.0
1.7
2.7
3.5
1.6
8.5
0.9
6.7
3.3
9.0
17.4 21.8
7.8
9.6
18.8
20.7
7.5
13.7
12.3
24.9
17.6
9.2
18.0
26.9
26.9
25.1
9.6
15.3
22.1
8.7
15.4
13.5
10.2
22.6
11.4
20.7
23.3
28.8
-26.1 38.0
21.4
44.2
115.7
-20.2
7.2
-10.3
-2.2
39.7
28.0
-21.8
4.4
5.9
25.3
271.7
28.4
31.8
26.3
53.2
23.9
18.7
-4.8
57.1
32.7
27.8
5.6
32.9
13.5 50.3
15.8 20.3
21.8 28.8
26.7 33.7
77.8 119.2
80.4 99.6
7.1
8.4
48.2 45.9
43.0 67.6
5.3
7.0
137.8 176.1
44.2 46.7
4.5
6.0
11 June 2018
16

MOSL Universe stock performance
Company
Automobiles
Amara Raja
Ashok Ley.
Bajaj Auto
Bharat Forge
Bosch
CEAT
Eicher Mot.
Endurance Tech.
Escorts
Exide Ind
Hero Moto
M&M
Mahindra CIE
Maruti Suzuki
Motherson Sumi
Tata Motors
TVS Motor
Banks - Private
Axis Bank
DCB Bank
Equitas Hold.
Federal Bank
HDFC Bank
ICICI Bank
IDFC Bank
IndusInd
J&K Bank
Kotak Mah. Bk
RBL Bank
South Indian
Yes Bank
Banks - PSU
BOB
BOI
Canara
Indian Bk
PNB
SBI
Union Bk
NBFCs
Aditya Birla Cap
Bajaj Fin.
Capital First
Cholaman.Inv.&Fn
Dewan Hsg.
GRUH Fin.
HDFC
HDFC Stand. Life
Indiabulls Hsg
L&T Fin.Holdings
LIC Hsg Fin
M&M Fin.
Muthoot Fin
1 Day (%)
0.8
-1.9
-0.5
-0.4
-0.9
-0.4
-0.4
2.0
0.4
0.5
-0.6
-0.9
2.2
0.3
-1.1
1.6
0.8
-1.1
0.1
-1.7
0.4
-0.7
-0.9
-0.4
-0.8
2.3
0.8
1.1
-0.8
-0.6
0.6
2.2
1.5
4.4
5.1
1.3
2.8
-0.5
1.6
-0.5
-0.5
0.8
1.2
-1.4
0.2
-0.3
0.9
0.5
0.4
1.7
1M (%)
-9.5
-12.3
-0.6
-11.8
-3.2
-8.6
-2.9
6.0
-5.9
-3.7
-0.6
5.2
4.7
1.9
-8.6
-6.6
-7.2
-0.9
-8.2
-8.2
-16.5
4.2
-6.8
-8.0
1.2
9.0
6.2
2.6
-9.1
-1.7
-8.8
-3.9
5.5
7.5
-2.4
9.1
1.5
-12.2
17.9
-6.9
-5.6
-0.3
2.6
-3.4
-7.3
-2.4
-6.7
-3.2
-3.3
-11.3
12M (%)
-9.3
53.0
0.2
10.1
-22.8
-28.0
-0.2
44.4
22.7
15.2
-4.0
28.5
2.1
23.7
1.1
-32.7
6.7
4.2
-10.3
-1.8
-25.7
24.6
-0.9
-28.8
24.0
-29.7
34.7
-2.4
-12.5
14.2
-24.3
-29.9
-23.2
18.7
-40.3
-5.6
-39.5
Company
MAS Financial Serv.
PNB Housing
Repco Home
Shriram City Union
Shriram Trans.
Capital Goods
ABB
Bharat Elec.
BHEL
Blue Star
CG Cons. Elec.
CG Power & Inds Sol.
Cummins
Engineers India
GE T&D
Havells
K E C Intl
L&T
Siemens
Solar Ind
Thermax
Va Tech Wab.
Voltas
Cement
Ambuja Cem.
ACC
Birla Corp.
Dalmia Bharat
Grasim Inds.
India Cem
JK Lakshmi Ce
Ramco Cem
Orient Cem
Prism Johnson
Sagar Cements
Sanghi Inds.
Shree Cem
Ultratech
Consumer
Asian Paints
Britannia
Colgate
Dabur
Emami
Future Consumer
Godrej Cons.
GSK Cons.
HUL
ITC
Jyothy Lab
Marico
Nestle
Page Inds
Pidilite Ind.
1 Day (%)
-0.1
-1.3
1.2
-1.1
-1.1
-1.5
-2.4
1.3
0.6
0.4
3.4
1.5
-1.0
2.3
0.8
-0.3
-0.8
1.0
-1.3
0.4
2.5
1.4
-0.1
0.0
1.6
-2.9
-1.0
-0.4
-2.4
-0.6
1.6
0.4
-0.1
-2.6
-1.0
-0.1
-0.8
-0.9
-0.6
-0.5
3.1
-0.1
0.3
0.3
-0.4
-1.0
2.0
2.4
1.0
-0.6
-1.6
1M (%)
-3.1
-10.3
-5.4
-3.3
-6.3
-3.3
-10.0
-7.1
-14.6
-9.1
-27.0
-9.2
-14.1
-21.1
0.8
-12.9
-1.6
-3.2
8.6
1.7
-15.6
-14.2
-10.6
-13.5
-5.2
-10.1
-5.8
-14.1
-18.6
-10.2
-11.7
-8.1
-17.5
-19.9
-2.2
-8.6
6.0
8.6
12.0
3.2
4.9
-5.8
3.7
9.9
6.7
-5.1
13.9
7.3
8.5
1.3
-3.2
12M (%)
-26.1
-28.5
-7.0
44.6
-15.9
-23.0
-16.1
6.6
-4.7
-29.3
-25.0
-13.9
-11.5
9.8
37.4
13.6
-24.4
38.1
20.9
-37.8
8.9
-12.5
-18.6
-22.7
6.7
9.7
-43.3
-31.5
5.5
-30.5
-5.0
-2.0
6.9
-10.2
-9.9
11.7
63.1
14.2
35.5
-5.4
65.6
23.8
20.5
45.9
-14.0
12.1
7.1
48.1
57.5
34.4
62.4
-19.5
51.5
43.0
77.3
12.6
5.2
28.8
-33.1
35.5
-9.9
11 June 2018
17

MOSL Universe stock performance
Company
P&G Hygiene
Prabhat Dairy
United Brew
United Spirits
Healthcare
Alembic Phar
Alkem Lab
Ajanta Pharma
Aurobindo
Biocon
Cadila
Cipla
Divis Lab
Dr Reddy’s
Fortis Health
Glenmark
Granules
GSK Pharma
IPCA Labs
Jubilant Life
Lupin
Laurus Labs
Sanofi India
Shilpa Medicare
Strides Shasun
Sun Pharma
Torrent Pharma
Infrastructure
Ashoka Buildcon
IRB Infra.Devl.
KNR Construct.
Sadbhav Engg.
Logistics
Allcargo Logistics
Concor
Gateway Distriparks
Media
Dish TV
D B Corp
Den Net.
Ent.Network
Hathway Cab.
Hind. Media
HT Media
Jagran Prak.
Music Broadcast
PVR
Prime Focus
Siti Net.
Sun TV
Zee Ent.
Metals
Hindalco
Hind. Zinc
JSPL
1 Day (%)
0.0
1.1
0.3
0.1
2.9
-0.5
5.4
4.4
0.3
2.5
3.3
-0.6
4.9
0.3
3.8
0.5
1.3
3.2
2.0
5.7
3.2
0.0
2.1
2.4
8.1
1.4
1.7
-0.2
-1.3
0.6
0.5
0.7
-3.2
-0.3
0.2
1.0
-0.1
3.0
3.7
1.4
-1.9
-0.7
6.0
-0.1
5.5
-0.5
1.3
-2.5
-0.6
-1.5
1M (%)
-4.0
-7.3
8.7
-0.2
-13.7
-2.9
-15.6
-7.5
-2.4
-7.4
-5.5
-12.9
-0.4
-4.4
6.3
-20.6
11.7
-5.8
-9.8
4.6
-4.2
6.6
-13.5
-35.2
3.3
3.8
-14.7
-9.2
-12.5
-13.5
-14.4
-2.8
2.6
-2.1
-11.2
-10.0
1.4
-13.5
-0.3
-3.2
-5.7
-9.8
-1.3
-7.7
-24.9
5.8
-6.4
1.2
-1.8
-6.5
12M (%)
19.2
41.0
50.0
40.8
-21.4
2.8
-37.6
-5.4
78.8
-32.6
1.7
61.4
-21.8
-24.3
-14.8
-43.8
6.2
36.2
0.4
-30.6
-22.2
28.4
-39.8
-60.9
0.0
15.8
29.2
3.6
32.5
3.9
-33.4
16.2
-30.6
-12.7
-29.2
9.6
-25.7
-24.4
-23.8
-1.4
-16.5
-3.8
-3.3
-23.1
-56.3
12.9
6.8
22.0
24.8
97.7
Company
JSW Steel
Nalco
NMDC
Rain Industries
SAIL
Vedanta
Tata Steel
Oil & Gas
Aegis Logistics
BPCL
GAIL
Gujarat Gas
Gujarat St. Pet.
HPCL
IOC
IGL
Mahanagar Gas
MRPL
Oil India
ONGC
PLNG
Reliance Ind.
Retail
Jubilant Food
Titan Co.
Technology
Cyient
HCL Tech.
Hexaware
Infosys
KPIT Tech
L&T Infotech
Mindtree
Mphasis
NIIT Tech
Persistent Sys
Tata Elxsi
TCS
Tech Mah
Wipro
Zensar Tech
Telecom
Bharti Airtel
Bharti Infratel
Idea Cellular
Tata Comm
Utiltites
Coal India
CESC
JSW Energy
NHPC Ltd
NTPC
Power Grid
Tata Power
1 Day (%)
-0.1
-0.4
1.8
5.0
1.5
-0.3
-0.3
3.5
-1.6
1.8
-0.2
5.3
-1.2
0.9
6.0
2.7
1.5
-1.4
0.5
3.1
1.2
1.0
0.8
1.3
0.7
0.4
0.7
1.8
-0.9
1.6
4.7
0.4
0.0
2.0
0.8
0.6
-0.3
-0.1
-0.8
1.0
4.0
-0.9
0.3
-1.0
0.5
0.0
-0.5
-2.1
-0.7
1M (%)
5.9
-7.2
-1.4
-26.6
9.5
-13.0
0.6
-17.1
4.2
0.1
-2.1
5.1
1.4
5.9
3.7
-2.9
-10.3
-3.6
-5.2
3.6
1.6
4.5
-7.5
-10.9
0.8
7.8
8.1
4.5
10.5
-0.2
14.9
1.1
-0.4
5.0
1.6
8.0
-3.1
-1.5
-6.0
-7.5
4.4
-1.8
8.0
-5.6
3.7
-5.9
-5.7
-6.4
-7.4
12M (%)
72.4
10.3
2.5
137.2
45.2
5.2
27.5
17.7
-13.3
17.3
5.1
9.9
-13.3
-15.7
27.4
-14.0
-26.2
12.2
1.8
6.2
47.9
178.4
69.3
38.0
7.1
77.6
31.7
135.2
109.4
89.4
76.7
90.1
20.8
61.9
38.7
77.6
-3.3
37.6
2.3
-21.6
-19.5
-18.4
10.4
10.6
15.5
-15.9
2.2
-4.0
-1.3
11 June 2018
18

MOSL Universe stock performance
Company
Others
Arvind
Avenue Super.
BSE
Castrol India
Coromandel Intl
Delta Corp
Interglobe
Indo Count
Info Edge
Kaveri Seed
MCX
Navneet Educat.
Oberoi Realty
Phoenix Mills
PI Inds.
Piramal Enterp.
Quess Corp
SRF
S H Kelkar
Tata Chemicals
Team Lease Serv.
Trident
UPL
V-Guard
1 Day (%)
0.9
2.5
0.4
-4.6
1.0
0.4
1.0
-3.8
-0.8
0.2
0.7
2.9
0.0
-1.0
0.3
0.0
2.4
-0.6
0.1
-0.1
0.2
0.9
1.4
1.2
1M (%)
-2.8
8.9
1.1
-4.6
1.6
-8.5
-1.1
-17.3
-1.1
3.4
8.5
-11.2
-0.3
2.9
-6.6
-3.9
-5.8
-21.3
-6.7
-3.5
-4.6
-9.2
-1.2
-14.0
12M (%)
8.3
102.1
-23.8
-15.8
6.0
49.0
3.6
-61.2
15.4
-21.4
-18.6
-31.7
34.5
50.4
-0.9
-13.7
29.1
11.8
-19.9
20.1
124.1
-28.9
-17.6
9.6
11 June 2018
19

NOTES
11 June 2018
20

THEMATIC/STRATEGY RESEARCH GALLERY

REPORT GALLERY
RECENT INITIATING COVERAGE REPORTS
.
Rs

DIFFERENTIATED PRODUCT GALLERY

Explanation of Investment Rating
Investment Rating
BUY
SELL
NEUTRAL
UNDER REVIEW
NOT RATED
Expected return (over 12-month)
>=15%
< - 10%
> - 10 % to 15%
Rating may undergo a change
We have forward looking estimates for the stock but we refrain from assigning recommendation
*In case the recommendation given by the Research Analyst becomes inconsistent with the investment rating legend, the Research Analyst shall within 28 days of the inconsistency, take appropriate measures to make the recommendation consistent with the investment rating legend.
Disclosures:
The following Disclosures are being made in compliance with the SEBI Research Analyst Regulations 2014 (herein after referred to as the Regulations).
Motilal Oswal Securities Ltd. (MOSL) is a SEBI Registered Research Analyst having registration no. INH000000412. MOSL, the Research Entity (RE) as defined in the Regulations, is engaged in the business of providing Stock broking services,
Investment Advisory Services, Depository participant services & distribution of various financial products. MOSL is a subsidiary company of Motilal Oswal Financial Service Ltd. (MOFSL). MOFSL is a listed public company, the details in respect of
which are available on
www.motilaloswal.com.
MOSL is registered with the Securities & Exchange Board of India (SEBI) and is a registered Trading Member with National Stock Exchange of India Ltd. (NSE) and Bombay Stock Exchange Limited
(BSE), Multi Commodity Exchange of India Limited(MCX) and National Commodity & Derivatives Exchange Limited(NCDEX) for its stock broking activities & is Depository participant with Central Depository Services Limited (CDSL) & National
Securities Depository Limited (NSDL) and is member of Association of Mutual Funds of India (AMFI) for distribution of financial products and Insurance Regulatory & Development Authority of India (IRDA) as Corporate Agent for insurance products
.Details
of associate entities of Motilal Oswal Securities Limited are available on the website at
http://onlinereports.motilaloswal.com/Dormant/documents/Associate%20Details.pdf
MOSL, it’s associates, Research Analyst or their relative may have any financial interest in the subject company. MOSL and/or its associates and/or Research Analyst may have beneficial ownership of 1% or more securities in the subject company at
the end of the month immediately preceding the date of publication of the Research Report.
MOSL and its associate company(ies), their directors and Research Analyst and their relatives may; (a) from time to time, have a long or short position in, act
as principal in, and buy or sell the securities or derivatives thereof of companies mentioned herein. (b) be engaged in any other transaction involving such securities and earn brokerage or other compensation or act as a market maker in the financial
instruments of the company(ies) discussed herein or act as an advisor or lender/borrower to such company(ies) or may have any other potential conflict of interests with respect to any recommendation and other related information and opinions.;
however the same shall have no bearing whatsoever on the specific recommendations made by the analyst(s), as the recommendations made by the analyst(s) are completely independent of the views of the associates of MOSL even though there
might exist an inherent conflict of interest in some of the stocks mentioned in the research report.
Research Analyst may have served as director/officer, etc. in the subject company in the last 12 month period. MOSL and/or its associates may have
received any compensation from the subject company in the past 12 months.
In the last 12 months period ending on the last day of the month immediately preceding the date of publication of this research report, MOSL or any of its associates may have:
a)
managed or co-managed public offering of securities from subject company of this research report,
b)
received compensation for investment banking or merchant banking or brokerage services from subject company of this research report,
c)
received compensation for products or services other than investment banking or merchant banking or brokerage services from the subject company of this research report.
d)
Subject Company may have been a client of MOSL or its associates during twelve months preceding the date of distribution of the research report.
MOSL and it’s associates have not received any compensation or other benefits from the subject company or third party in connection with the research report. To enhance transparency, MOSL has incorporated a Disclosure of Interest Statement in
this document. This should, however, not be treated as endorsement of the views expressed in the report. MOSL and / or its affiliates do and seek to do business including investment banking with companies covered in its research reports. As a result,
the recipients of this report should be aware that MOSL may have a potential conflict of interest that may affect the objectivity of this report. Compensation of Research Analysts is not based on any specific merchant banking, investment banking or
brokerage service transactions.
Terms & Conditions:
This report has been prepared by MOSL and is meant for sole use by the recipient and not for circulation. The report and information contained herein is strictly confidential and may not be altered in any way, transmitted to, copied or distributed, in part
or in whole, to any other person or to the media or reproduced in any form, without prior written consent of MOSL. The report is based on the facts, figures and information that are considered true, correct, reliable and accurate. The intent of this report
is not recommendatory in nature. The information is obtained from publicly available media or other sources believed to be reliable. Such information has not been independently verified and no guaranty, representation of warranty, express or implied,
is made as to its accuracy, completeness or correctness. All such information and opinions are subject to change without notice. The report is prepared solely for informational purpose and does not constitute an offer document or solicitation of offer to
buy or sell or subscribe for securities or other financial instruments for the clients. Though disseminated to all the customers simultaneously, not all customers may receive this report at the same time. MOSL will not treat recipients as customers by
virtue of their receiving this report.
Analyst Certification
The views expressed in this research report accurately reflect the personal views of the analyst(s) about the subject securities or issues, and no part of the compensation of the research analyst(s) was, is, or will be directly or indirectly related to the
specific recommendations and views expressed by research analyst(s) in this report.
Disclosure of Interest Statement
Analyst ownership of the stock
Companies where there is interest
No
A graph of daily closing prices of securities is available at
www.nseindia.com, www.bseindia.com.
Research Analyst views on Subject Company may vary based on Fundamental research and Technical Research. Proprietary trading desk of MOSL or
its associates maintains arm’s length distance with Research Team as all the activities are segregated from MOSL research activity and therefore it can have an independent view with regards to subject company for which Research Team have
expressed their views.
Regional Disclosures (outside India)
This report is not directed or intended for distribution to or use by any person or entity resident in a state, country or any jurisdiction, where such distribution, publication, availability or use would be contrary to law, regulation or which would subject
MOSL & its group companies to registration or licensing requirements within such jurisdictions.
For Hong Kong:
This report is distributed in Hong Kong by Motilal Oswal capital Markets (Hong Kong) Private Limited, a licensed corporation (CE AYY-301) licensed and regulated by the Hong Kong Securities and Futures Commission (SFC) pursuant to the Securities
and Futures Ordinance (Chapter 571 of the Laws of Hong Kong) “SFO”. As per SEBI (Research Analyst Regulations) 2014 Motilal Oswal Securities (SEBI Reg No. INH000000412) has an agreement with Motilal Oswal capital Markets (Hong Kong)
Private Limited for distribution of research report in Hong Kong. This report is intended for distribution only to “Professional Investors” as defined in Part I of Schedule 1 to SFO. Any investment or investment activity to which this document relates is only
available to professional investor and will be engaged only with professional investors.” Nothing here is an offer or solicitation of these securities, products and services in any jurisdiction where their offer or sale is not qualified or exempt from
registration. The Indian Analyst(s) who compile this report is/are not located in Hong Kong & are not conducting Research Analysis in Hong Kong.
For U.S.
Motilal Oswal Securities Limited (MOSL) is not a registered broker - dealer under the U.S. Securities Exchange Act of 1934, as amended (the"1934 act") and under applicable state laws in the United States. In addition MOSL is not a registered
investment adviser under the U.S. Investment Advisers Act of 1940, as amended (the "Advisers Act" and together with the 1934 Act, the "Acts), and under applicable state laws in the United States. Accordingly, in the absence of specific exemption
under the Acts, any brokerage and investment services provided by MOSL, including the products and services described herein are not available to or intended for U.S. persons. This report is intended for distribution only to "Major Institutional
Investors" as defined by Rule 15a-6(b)(4) of the Exchange Act and interpretations thereof by SEC (henceforth referred to as "major institutional investors"). This document must not be acted on or relied on by persons who are not major institutional
investors. Any investment or investment activity to which this document relates is only available to major institutional investors and will be engaged in only with major institutional investors. In reliance on the exemption from registration provided by Rule
15a-6 of the U.S. Securities Exchange Act of 1934, as amended (the "Exchange Act") and interpretations thereof by the U.S. Securities and Exchange Commission ("SEC") in order to conduct business with Institutional Investors based in the U.S.,
MOSL has entered into a chaperoning agreement with a U.S. registered broker-dealer, Motilal Oswal Securities International Private Limited. ("MOSIPL"). Any business interaction pursuant to this report will have to be executed within the provisions of
this chaperoning agreement.
The Research Analysts contributing to the report may not be registered /qualified as research analyst with FINRA. Such research analyst may not be associated persons of the U.S. registered broker-dealer, MOSIPL, and therefore, may not be subject
to NASD rule 2711 and NYSE Rule 472 restrictions on communication with a subject company, public appearances and trading securities held by a research analyst account.
For Singapore
Motilal Oswal Capital Markets Singapore Pte Limited is acting as an exempt financial advisor under section 23(1)(f) of the Financial Advisers Act(FAA) read with regulation 17(1)(d) of the Financial Advisors Regulations and is a subsidiary of Motilal
Oswal Securities Limited in India. This research is distributed in Singapore by Motilal Oswal Capital Markets Singapore Pte Limited and it is only directed in Singapore to accredited investors, as defined in the Financial Advisers Regulations and the
Securities and Futures Act (Chapter 289), as amended from time to time. In respect of any matter arising from or in connection with the research you could contact the following representatives of Motilal Oswal Capital Markets Singapore Pte Limited:
Disclaimer:
The report and information contained herein is strictly confidential and meant solely for the selected recipient and may not be altered in any way, transmitted to, copied or distributed, in part or in whole, to any other person or to the media or reproduced
in any form, without prior written consent. This report and information herein is solely for informational purpose and may not be used or considered as an offer document or solicitation of offer to buy or sell or subscribe for securities or other financial
instruments. Nothing in this report constitutes investment, legal, accounting and tax advice or a representation that any investment or strategy is suitable or appropriate to your specific circumstances. The securities discussed and opinions expressed in
this report may not be suitable for all investors, who must make their own investment decisions, based on their own investment objectives, financial positions and needs of specific recipient. This may not be taken in substitution for the exercise of
independent judgment by any recipient. Each recipient of this document should make such investigations as it deems necessary to arrive at an independent evaluation of an investment in the securities of companies referred to in this document
(including the merits and risks involved), and should consult its own advisors to determine the merits and risks of such an investment. The investment discussed or views expressed may not be suitable for all investors. Certain transactions -including
those involving futures, options, another derivative products as well as non-investment grade securities - involve substantial risk and are not suitable for all investors. No representation or warranty, express or implied, is made as to the accuracy,
completeness or fairness of the information and opinions contained in this document. The Disclosures of Interest Statement incorporated in this document is provided solely to enhance the transparency and should not be treated as endorsement of the
views expressed in the report. This information is subject to change without any prior notice. The Company reserves the right to make modifications and alternations to this statement as may be required from time to time without any prior approval.
MOSL, its associates, their directors and the employees may from time to time, effect or have effected an own account transaction in, or deal as principal or agent in or for the securities mentioned in this document. They may perform or seek to perform
investment banking or other services for, or solicit investment banking or other business from, any company referred to in this report. Each of these entities functions as a separate, distinct and independent of each other. The recipient should take this
into account before interpreting the document. This report has been prepared on the basis of information that is already available in publicly accessible media or developed through analysis of MOSL. The views expressed are those of the analyst, and
the Company may or may not subscribe to all the views expressed therein. This document is being supplied to you solely for your information and may not be reproduced, redistributed or passed on, directly or indirectly, to any other person or
published, copied, in whole or in part, for any purpose. This report is not directed or intended for distribution to, or use by, any person or entity who is a citizen or resident of or located in any locality, state, country or other jurisdiction, where such
distribution, publication, availability or use would be contrary to law, regulation or which would subject MOSL to any registration or licensing requirement within such jurisdiction. The securities described herein may or may not be eligible for sale in all
jurisdictions or to certain category of investors. Persons in whose possession this document may come are required to inform themselves of and to observe such restriction. Neither the Firm, not its directors, employees, agents or representatives shall
be liable for any damages whether direct or indirect, incidental, special or consequential including lost revenue or lost profits that may arise from or in connection with the use of the information.
The person accessing this information specifically agrees
to exempt MOSL or any of its affiliates or employees from, any and all responsibility/liability arising from such misuse and agrees not to hold MOSL or any of its affiliates or employees responsible for any such misuse and further agrees to hold MOSL
or any of its affiliates or employees free and harmless from all losses, costs, damages, expenses that may be suffered by the person accessing this information due to any errors and delays.
Registered Office Address: Motilal Oswal Tower, Rahimtullah Sayani Road, Opposite Parel ST Depot, Prabhadevi, Mumbai-400025; Tel No.: 022-3980 4263; www.motilaloswal.com. Correspondence Address: Palm Spring Centre, 2nd Floor, Palm
Court Complex, New Link Road, Malad (West), Mumbai- 400 064. Tel No: 022 3080 1000. Compliance Officer: Neeraj Agarwal, Email Id:
na@motilaloswal.com,
Contact No.:022-38281085.
Registration details of group entities.: MOSL: SEBI Registration: INZ000158836 (BSE/NSE/MCX/NCDEX); CDSL: IN-DP-16-2015; NSDL: IN-DP-NSDL-152-2000; Research Analyst: INH000000412. AMFI: ARN 17397. Investment Adviser:
INA000007100.IRDA Corporate Agent-CA0541. Motilal Oswal Asset Management Company Ltd. (MOAMC): PMS (Registration No.: INP000000670) offers PMS and Mutual Funds products. Motilal Oswal Wealth Management Ltd. (MOWML): PMS
(Registration No.: INP000004409) offers wealth management solutions. *Motilal Oswal Securities Ltd. is a distributor of Mutual Funds, PMS, Fixed Deposit, Bond, NCDs, Insurance and IPO products. * Motilal Oswal Commodities Broker Pvt. Ltd. offers
Commodities Products. * Motilal Oswal Real Estate Investment Advisors II Pvt. Ltd. offers Real Estate products. * Motilal Oswal Private Equity Investment Advisors Pvt. Ltd. offers Private Equity products
11 June 2018
21