28 August 2018
Market snapshot
Equities - India
Sensex
Nifty-50
Nifty-M 100
Equities-Global
S&P 500
Nasdaq
FTSE 100
DAX
Hang Seng
Nikkei 225
Commodities
Brent (US$/Bbl)
Gold ($/OZ)
Cu (US$/MT)
Almn (US$/MT)
Currency
USD/INR
USD/EUR
USD/JPY
YIELD (%)
10 Yrs G-Sec
10 Yrs AAA Corp
Flows (USD b)
FIIs
DIIs
Volumes (INRb)
Cash
F&O
Close
38,694
11,692
19,774
Close
2,897
8,018
7,577
12,488
11,049
22,800
Close
75
1,211
6,092
2,073
Close
70.2
1.2
111.1
Close
7.9
8.7
27-Aug
0.04
0.16
27-Aug
330
7,831
Chg .%
1.2
1.2
1.2
Chg .%
0.8
0.9
0.0
0.8
2.5
0.9
Chg .%
0.5
0.5
0.0
0.0
Chg .%
0.4
0.6
-0.2
1MChg
0.27
0.03
MTD
0.2
0.6
MTD*
359
9,109
YTD.%
13.6
11.0
-6.4
YTD.%
8.3
16.1
-1.4
-3.3
-5.6
0.2
YTD.%
12.8
-7.0
-15.5
-8.1
YTD.%
9.8
-2.6
-1.5
YTDchg
0.6
0.8
YTD
-0.3
10.5
YTD*
357
8,418
Today’s top research Theme
SBI: Asset quality reboot done – the way forward!
We hosted Mr. Rajnish Kumar, Chairman of State Bank of India at our conference.
Key takeaways are:
IBC will take a few more months to give a sense on the recovery value. ARCs
have a poor recovery record.
Choices for NPA: a) resolution plan with the promoter; b) change of
management with the corporation and with the promoter; c) sale to ARC; and
d) NCLT.
As per management, OTS schemes with existing promoters or orderly change of
promoters leads to better recovery.
SASHAKT program is not bypassing or diluting any of the existing frameworks;
absence of strong AMC is being felt. Resolution and recovery can be better if
they are referred earlier in the IBC process by all the lenders in the ICA.
Research covered
Key Highlights
SBI | Jubilant Foodworks | Niti Aayog | Shell India | Hindalco |
United Breweries | Dalmia Bharat | Hindalco
Automobiles | Capital Goods and Electricals | Consumer | Financilas
AGIC:
– Banks; Life Insurance; NBFC | Healthcare | Media | Metals | Oil &
Management Says
Gas | Real Estate | Retail | Technology | Utilities | Midcaps/Others
Cos/Sector
AGIC: CEO Track
Takeaways
Piping hot news
FMCG consumption down, but branded item sales on the rise
FMCG consumption down, but branded item sales on the rise The country’s fast moving
consumer goods market fell 3% by volumes in the quarter ended June even as branded
products continued to grow, according to data from Kantar Worldpanel, a global consumer
research firm owned by communications and advertising giant WPP…
Note: YTD is calendar year, *Avg
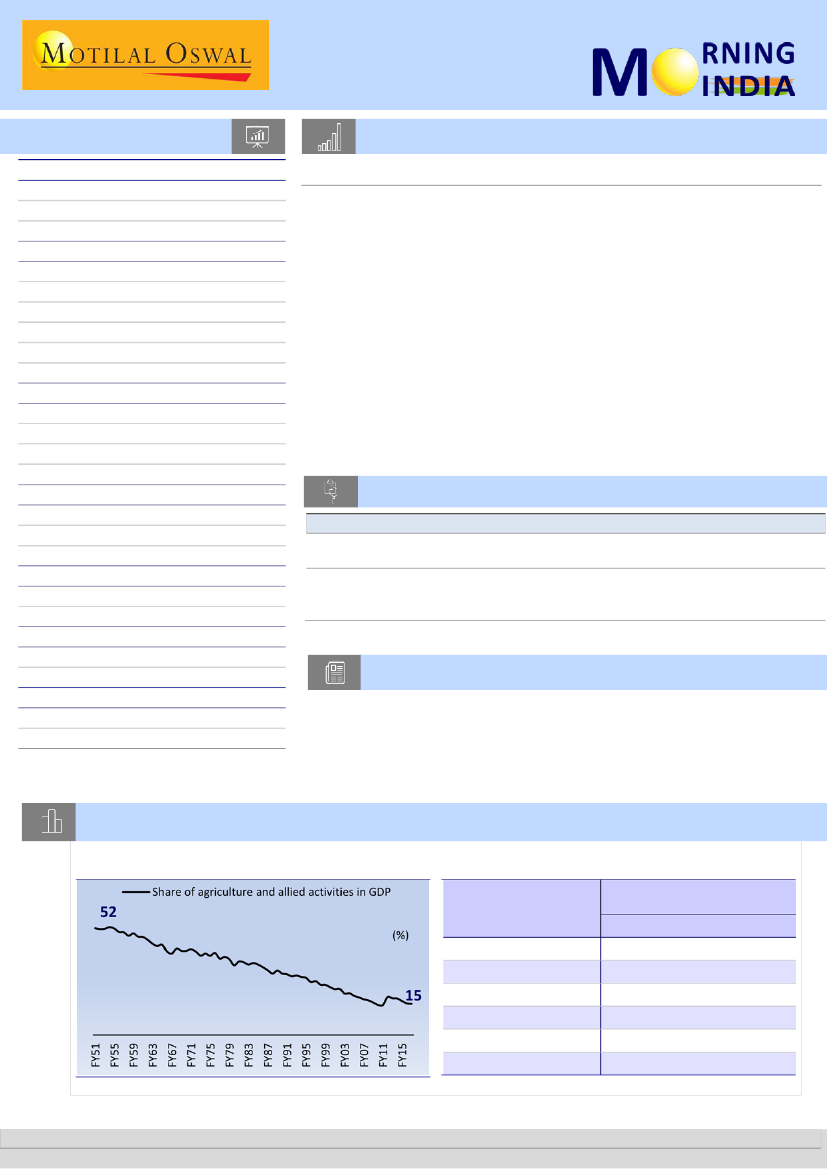
Chart of the Day: EcoKnowLedge – Will India have two budgets in 2018?
Share of agriculture in GDP has declined over the years
Share of agriculture in employment has also declined
continuously
NSS Survey period
January-December 1983
January-December 1992
January-December 1997
January-December 2003
July 2007-June 2008
July 2011-June 2012
%age employed in the primary
sector in rural areas
Male
Female
77.5
75.7
75.8
70.8
66.5
59.4
87.5
86.2
88.5
85.2
83.5
74.9
Source: State budget documents, MOSL
Research Team (Gautam.Duggad@MotilalOswal.com)
Motilal Oswal research is available on www.motilaloswal.com/Institutional-Equities, Bloomberg, Thomson Reuters, Factset and S&P Capital.
Investors are advised to refer through important disclosures made at the last page of the Research Report.
 Motilal Oswal Financial Services
In the news today
Kindly click on textbox for the detailed news link
1
FMCG consumption down, but
branded item sales on the rise
FMCG consumption down, but
branded item sales on the rise
The country’s fast moving
consumer goods market fell 3%
by volumes in the quarter ended
June even as branded products
continued to grow, according to
data from Kantar Worldpanel, a
global consumer research firm…
2
Zee Entertainment to convert free channels into pay Subhash
Chandra-promoted Zee EntertainmentNSE 0.17 % Enterprises has
decided to turn all its free-to-air (FTA) channels into pay channels.
Once effective, channels like Zee Anmol, Zee Anmol Cinema, Zee
News, Big Magic, Big Ganga and Zee Hindustan will not be available in
any of the FTA bouquets of cable or private DTH operators. The move
is in line with the fast approaching August 31 deadline for announcing
the MRP for television channels under the Telecom Regulatory
Authority of India’s new tariff order…
Zee Entertainment to convert free channels into pay
3
Power companies facing
insolvency get no interim
relief from High Court
Power Cos Facing Insolvency Get
No Interim Relief from HC The
Allahabad High Court declined to
give private power companies
any interim relief on the Reserve
Bank of India (RBI) circular that
tightened bad loan norms on
Monday, the deadline for
finalising resolution plans for the
stressed assets…
4
Ecommerce companies may
deliver a record this festive
season
Ecommerce companies may
deliver a record this festive
season As American retail giants
Amazon and Walmart prepare to
slug it out in their first festive
season faceoff in India, industry
experts anticipate ecommerce
shipments to hit record levels
during the peak sales period that
begins in October…
5
Sale of 5% stake: Government
readies ONGC OFS
Sale of 5% stake: Government
readies ONGC OFS The Centre will
likely sell a 5% stake in the
country’s largest oil explorer
ONGC in what could be one of its
largest disinvestment exercises in
the current fiscal. At current
prices (the ONGC stock closed Rs
176.20 on Monday), the stake
sale may fetch the exchequer Rs
11,300 crore. The department of
investment and public asset
management (DIPAM) held
roadshows in the US last week to
reach out to potential investors
for the proposed offer for sale
(OFS) of the government’s stake
in ONGC…
6
Boeing to return $200 million to
debt-ridden Jet Airways To help
crisis-ridden Jet Airways, US
aircraft manufacturer Boeing is
understood to be returning a
portion of the amount paid by the
carrier to procure 75 Boeing 737
Max. Sources said Boeing is likely
to return around $200 million to
Jet…
7
From supplier to consumer,
RIL may change India's
petcoke dynamics
From supplier to consumer, RIL
may change India's petcoke
dynamics As part of a larger
strategy, RIL has set up a petcoke
gasification project where it is
likely to use its own petcoke
production and also buy more
from other producers. Industry
analysts peg the incremental buy
at about four million tonnes…
Boeing to return $200 million
to debt-ridden Jet Airways
28 August 2018
2
 Motilal Oswal Financial Services
CEO Track
State Bank of India
Mr Rajnish Kumar
Chairman
Asset quality reboot done- the way forward
We hosted Mr. Rajnish Kumar, Chairman of State Bank of India, as part of CEO Track at our
conference. Following are the key takeaways from his session:
SBI affirmed that NPL cycle has peaked and the new NPL formation is likely to come
down in the coming quarters. However, earnings recovery through P&L will take few
more quarters.
SBI affirmed its fresh slippage guidance of <2%. Credit cost is expected to be lower
than 2% and for FY20 it should be around 1.3%. It will also depend on how fast SBI can
get resolution in NCLT as it carries ~79% coverage on NCLT-2.
SBI’s PCR is aligned with the LGD. SBI’s LGD is 54% and therefore the future earnings
should not have a provisioning overhang.
Banks have been fortunate to witness healthy recoveries in the steel sector; going
forward cement sector is expected to do well on higher government infra spending
and focus on affordable housing.
Management is seeing a credit growth revival in Auto, LCV, Renewable energy, Roads,
Oil & Gas, and Auto components.
IBC has turned out to be a very effective NPA resolution mechanism. However, it will
still take more times to get a sense of the recovery value. ARC’s have historically
shown a very poor recovery record. As per management, one time settlement
schemes or resolution with existing promoters or orderly change of promoters leads to
a better recovery.
While certain amendments have been made in the IBC process to speed-up NPL
resolution, certain sections on eligibility of bidders are being misused and causing
unnecessary delays.
To solve the stressed assets within 180 days, banks will have to adopt a coordinated
approach and will need to focus on one of the four choices: a) resolution plan with
existing promoter; b) orderly change of management; c) sale to ARC; and d) taking it
under IBC.
Sashakt program:
-
It is not bypassing or diluting any of the existing frameworks. IBC will still remain
the resolution approach for large cases or where no solution is reached by the
existing lenders.
-
Absence of strong AMC is being felt. The same is now covered under Sashakt.
-
If the inter-creditor agreement is in place and if lenders sit and decide in a
coordinated approach, there will be consolidation of stressed assets rather than
fragmentation. Currently lack of coordination among lenders is leading to a
different approach.
-
31 banks have already signed the inter-creditor agreement, more will follow.
Lenders need to decide quickly which option out of the four is to be used.
Resolution and recovery can be better if its referred earlier in the IBC process.
28 August 2018
3
 Motilal Oswal Financial Services
Jubilant Foodworks
Mr Pratik Pota
CEO and Wholetime Director
Managing disruptions in the QSR segment
Poised to gain as a result of favorable positioning and high adaptability
We hosted Mr. Pratik Pota, CEO of Jubilant FoodWorks, as part of CEO Track at our
conference. Following are the key takeaways from his presentation.
Changes in the sector are arising due to a need for convenience, growing sensitivity for
food safety and quality, willingness to experiment and an increasing use of social
media. Jubilant is a beneficiary of these trends as they are early adapters of
technology, their innovation, improvement in product quality and taking advantage of
being the pioneers in food delivery. Delivery proportion for most restaurant
businesses accounts for anywhere between 15-60% of sales now, with share of
delivery in incremental sales growth being anywhere from 70-120%.
QSR and casual dining players are in the most favorable quadrant in the value/
experience matrix of providing both high value and high experience.
Challenges for aggregators and delivery players is the risk of anonymizing customers
as they lose personal connect, undifferentiated experience due to nature of delivery
experience and eventual margin pressure for restaurants due to dependence on
aggregators. The responses of players should be high focus on quality with audits,
delivering greater food everyday with the consistency being more important, more
focus on upgrading own platform, improving user interface to reduce dependence on
aggregators and upgrading the customer to such an extent that impulse turns into
habit thereby reducing cyclicality.
Jubilant’s key strengths to cope with the key disruptions in the sector is an ideal mix of
~50:50 in delivery and dine-in to take advantage of prevailing scenarios in the QSR
space, its high quality products particularly after the ‘ All new Domino’s’ initiative,
change in VFM focus from BOGO (Buy One Get One) to Every Day Value (habit versus
impulse as indicated above), its strong digital play (digital team has 45 members
compared to two a few years ago with some pioneering work on data analytics-
results of which will be witnessed in a few quarters) , its ability to redefine its delivery
strength and the strength of the brand. Many of these strengths are being augmented
by useful inputs from Domino’s Inc. on strategy.
28 August 2018
4
 Motilal Oswal Financial Services
Thematic
Presentation
Sri Rajiv Kumar – Niti Aayog
Vice Chairman
Niti Aayog: India’s development model
Will services supplant manufacturing as a growth engine?
Mr Kumar divided his talk into three parts:
Role of NITI Aayog
Mr Kumar said that NITI Aayog cannot be compared to the erstwhile Planning
Commission. He further said that NITI Aayog is not the government’s ‘think tank’ but
an ‘action tank’. The government doesn’t want to remain knowledge-proof, but wants
Sri Rajiv Kumar – Niti Aayog
to hear from everyone in the academia, private industry, etc. and this is exactly what
Vice Chairman
NITI Aayog tries to accomplish. Also, NITI Aayog does not need to go through any of
the ministries or government departments. It has direct access to the Prime Minister’s
ears, and thus, is among the most effective.
Current state of Indian economy
There are at least five reasons why Mr Kumar believes the economy is at the cusp of a
major transformation.
The past four years have seen the maximum number of reforms, more than in any
four-year period. The same was also reflected by a recent paper by Brookings
Institution, which argues that the poverty rate in the country has declined to 5-6%
from 20-25% a few years ago. If so, the discourse needs to shift from poverty
reduction to achieving prosperity.
Public spending is the only engine firing the economy at this point in time, which
was provided with ammunition through the crash in oil prices.
However, private investments are yet to pick up. Within private investments, the
corporate sector has done well, but household investments (or real estate) have
fallen sharply.
The government has initiated a number of reforms ranging from Goods & services
tax (GST), Insolvency and bankruptcy code (IBC), RERA, JAM, abolition of FIPB
(foreign investment promotion board), 100% FDI (foreign direct investment) in
many sectors, etc.
Sri Rajiv Kumar – Niti Aayog
Finally, the zero-tolerance policy for corruption has helped the economy. The late
Vice Chairman
Mr. Rajiv Gandhi lamented decades ago that if the total allocation is INR1, then
only 15p from that allocation is passed on to the poor. The number must have
increased to 85p, if not more now.
Mr. Kumar also believes that real GDP growth could be 7.70-7.75% in 1QFY19.
Five concerns/challenges highlighted by Mr. Kumar
Mr. Kumar strongly believes that the negative narrative about the economy has
continued for no good reason. In fact, foreigners seem more positive than
domestic investors.
28 August 2018
5
 Motilal Oswal Financial Services
Trade balance is a serious challenge. The fact that India has been a net importer
almost every year since independence is unacceptable. In particular, Mr Kumar
seems worried with the fact that the share of India’s exports has not increased.
Third, the extent of malnutrition is a serious challenge for the economy. As per
Sri are Kumar – Niti Aayog
data, 38% of childrenRajivunder-nourished and about 50% mothers are anemic.
Vice Chairman
Such an extent of malnutrition encapsulates the human development issue, which
may then translate into lack of skills and talent.
Fourth, the economy needs to have better water management. Linking rivers,
which Late Prime Minister Atal Bihari Vajpayee talked about, could be a solution.
Finally, as per data available recently, less than 5% (or 2.7m out of about 58m) of
small and medium enterprises (SMEs) have access to bank credit. The government
is taking measures to increase bank credit to SMEs as much as possible through
schemes such as Atal Innovation Mission (AIM).
Lastly, Mr. Kumar clarified that he is not worried about the recent weakness in the Indian
Rupee (INR).
Thematic
Presentation
Mr Nitin Prasad
Chairman
Shell India
Energy Systems in Transition - The India Perspective
We hosted Shell India head Mr. Nitin Prasad for CEO track in our conference. Key
takeaways of the same:
Since the Paris convention, there has been an increased focus globally at reducing
greenhouse gases. There is a mosaic of alternates that would play an important role
including electrical vehicles, hydrogen and renewables.
While no one can dispute the power of disruptive forces, the current knowledge
shows that fossil fuels would remain in vogue for another 2-3 decades. Oil
consumption is expected to peak in 2030s while gas consumption would take another
2-3 decades to peak out. The biggest growth would be from renewables. Although
hydrogen technology is still two decades from commercialization, it has a very high
energy density and would be the best alternative to fossil fuels for transportation.
Per capital consumption of energy in India is still a fraction of the consumption in the
developed world. Shell has been present in India since the last ~25 years through its
investments in exploration and production, fuel retailing, lubricants, and LNG imports
to name a few. It is growing stronger by the day and India is a key market for future
investments.
28 August 2018
6
 Motilal Oswal Financial Services
Thematic
Presentation
Mr Satish Pai
Managing Director
Hindalco
Leading sustainably, with balance!
Building a sustainable growth model
Hindalco is focusing on a long-term sustainable growth model. At Novelis, recycling of
metal has increased from 30% about a decade ago to 57% in FY18. Recycling of metal
consumes 95% less energy. In India, 17-18 captive bauxite mines meet its entire
requirements. A diversified mix of coal supply from captive mines and linkages from
Coal India meet its entire energy requirement. Captive mines come handy when Coal
India supply falls short. Hindalco continues to invest for reducing environmental
impact. Its captive power plants will meet SOx and NOx norms before the deadline.
Hindalco is already reusing 70-80% of fly ash that it produces and is targeting to reach
100% reuse. It is setting up 30MW solar plant and a hydro unit to meet RPO
obligations.
Novelis’ transformation through strategic shift; Aleris is a strategic fit
Novelis has increased its EBITDA from less than USD500m in FY09 to USD1.2b in FY18
through transformation of its business by (1) exiting low margin businesses; (2)
increasing recycling capacity; and by (3) capitalizing on the exponential growth in the
new high- margin auto business. Acquisition of Aleris will consolidate its market share
in the auto business, drive synergy from Aleris’ hot mill in China and open
opportunities in aerospace.
Hindalco is focusing on the following areas for capital allocation to capitalize on:
High growth potential in Auto FRP – expect demand to increase 50% over CY17 to
CY20 – adding auto line in the US and China.
Large under penetrated VAP at just 23% in India v/s 64% in the world – investing
INR60-70b and plans to bring 67% of primary metal production to end user directly.
Huge potential in defence and aerospace.
Evaluating expansion of copper smelter and securing long-term concentrate supply.
Hindalco’s RoCE has increased to 9.7% and focus is to improve it further.
Identifying Growth Areas
1)
2)
3)
4)
Focus on improving RoCE
28 August 2018
7
 Motilal Oswal Financial Services
United Breweries
Mr Shekhar Ramamurthy
Managing Director
Industry prospects continue to recover
Strong moats and adaptability enabling them stay ahead of peers
We hosted Mr. Shekhar Ramamurthy, MD of United Breweries, as part of CEO Track at our
conference. Following are the key takeaways from his presentation.
Beer is growing faster in recent years owing to changing demographics and
perceptions with beer being seen as a good entry-point product, cooler to drink and
more desirable having lesser alcohol content.
Management is bullish on achieving higher than industry growth for the next 3-4 years
led by them remaining highly relevant from both the urban and affluent customer as
well as the mid-tier customer. The former will drive margins while the latter will
enable build on market leadership.
In premium, each of its brands is growing by at least 30% versus mid-single digit
industry volume growth. The company will introduce craft beer by the year-end,
having recently introduced draught beer under the Heineken brand as well. It is also
targeting the non-alcoholic drinks market with non- alcoholic and flavored beers and
has introduced a host of imported beers covering a multitude of flavors to the Indian
palate.
For the mid-tier customer, apart from retaining and buttressing the Kingfisher brand
experience through clever marketing and associations, it has also successfully
introduced Kingfisher storm, which has already achieved 3-5% market share in the 4-5
states in which it has been launched. It also recently launched the iconic Amstel brand
as a strong beer in India. The burgeoning repertoire of brands enables the company to
serve a host of emerging customer segments.
Sustainability is a huge part of its long-term business plan with targets of being 100%
water neutral by 2025. It also has a target of meeting 50% of its power requirements
by sustainable sources over the next three years from 15% currently.
28 August 2018
8
 Motilal Oswal Financial Services
Thematic
Presentation
Mr Puneet Dalmia
Managing Director
Dalmia Bharat
Indian Cement Sector – Best is yet to come
Takeaways from CEO track; Pace of demand growth will outpace supply
We hosted Mr. Puneet Dalmia, MD of Dalmia Bharat, as part of CEO Track at our
conference. Following are the key takeaways from his presentation.
The Indian Cement Industry witnessed a supply CAGR of 11% and demand CAGR of
only 6% during FY07-17. Price during the period increased at a CAGR of 5% while
EBITDA grew 8%.
This is expected to turn favorable as supply is expected to increase by only 4% over
FY18-23 driven by difficulty in limestone access and credit availability and more
stringent land acquisition laws. The quick insolvency processes will also lead to more
consolidation in the industry.
Demand is expected to grow at a CAGR of 8% over FY18-23 due to housing projects
like PMAY and various road projects.
As a result, utilization is expected to increase from 62% in FY18 to 79% in FY23 driven
by consolidation in the industry.
Dalmia Bharat plans to achieve profitability by focusing on being a premium brand and
adopting land cost control measures.
28 August 2018
9
 Motilal Oswal Financial Services
Thematic
Presentation
Sri Piyush Goyal
Minister of Railways & Coal, GoI
The Governance Transformation under NDA - 2
The government is highly focused on the synergy between roads, railways, aviation
and ports. A number of examples were provided on how the dedicated freight corridor
(DCF) was linked with ports and railways. The government is seriously trying to exploit
its potential through higher cooperation between different modes of transport,
according to Mr. Goyal.
As far as the GST collection is concerned, there is no need to worry at all. Mr. Goyal
seemed extremely confident of meeting the tax targets and fiscal deficit targets as
well. The Minister explained that the tax collection is usually lower in the first half of
the year, which picks up in the latter half in an approximate ratio of 44:56.
Trade balance (or current account deficit) is certainly a serious macro concern at this
point in time; however, rising oil prices and global environment is not very helpful, Mr.
Goyal said.
In the case of higher coal imports, the Minister agreed that coal imports are high. But,
he believes that it should remain high, as is the case in every growing economy. Since
thermal energy is the base of energy in the country, growing demand makes it almost
inevitable to have higher coal imports.
Finally, while Mr. Goyal approves of the benefits of linking property transactions with
Aadhar card, he clarified that the government is still awaiting the Supreme Court's
order on the mandatory nature of Aadhar card. The Minister, however, mentioned
several benefits of tracking property transactions, generating ideal stamp duty
collections, etc., if the Aadhar linking is permitted.
28 August 2018
10
 Motilal Oswal Financial Services
‘Management Says’
Key takeaways from Motilal Oswal Annual Global Investor Conference 2018
Company
Takeaway
Impact
Automobiles
A. Lightweighting trend to be a major revenue driver going ahead.
It has potential to reduce fuel consumption by 15-18%.
B. Expect revenue from aerospace to double in the next 3 years.
C. Domestic non-auto revenues are expected to be healthy led by increasing
contribution from defense and agriculture mechanization segment.
D. US CV growth to continue in CY19, post which growth could taper.
A. Expect to grow faster than industry, with traditional business (switch,
lights, horns) expected to grow at 15%, while new business like alloy wheel
to grow >30% over next two years.
B. 3-4 years vision: Expect revenue to double in 4 years, EBITDA margin at
12.5%, PAT to grow 2x in 3 years and ROCE >22%
C. Huge opportunity in alloy wheels, since penetration is low currently at
~25%. Increased premiumization would lead to increase in penetration.
A. Expect retails/ wholesales to be slow in Aug-18 impacted by west Bengal
and Kerala issue. Total impact of ~40-45k units
B. BS-6 to drive healthy growth in service and retail business. Giving training
to ~65k mechanics for BS6 related sales service.
C. Price increase expected in Sep-18 which will cover 1QFY19 inflation.
D. intensity of incentives/offers/schemes expected to go up during festivals.
+ ve
+ ve
+ ve
- ve
+ ve
+ ve
+ ve
- ve
+ ve
+ ve
- ve
Impact
Bharat Forge
Minda Industries
Hero
MotoCorp
Company
Takeaway
A. Premiumization trends continue across fans, lighting, and appliances.
Capital Goods and
B. Key segments witnessing strong growth in FY19 are Water, Roads, T&D,
Metros, household electrification and hydrocarbons.
Electricals
C. Orders from the Middle East are seeing a revival post the rise in crude
prices.
A. Intend to launch at least one new innovative product each year across the
categories they operate in. Aim is to be a No. 2/3 player across categories.
B. Market strategy roll-out to be completed in the next 12-18 months. Aim is
to increase sales via own distributors and have a “Distributor lead” model.
C. Consumer meaningful innovations over the last few years include: a) Anti-
Crompton Greaves
dust fans and Air 360 fans; b) 5-star LED bulbs; c) CREST mini pumps; and
Consumer Electricals
d) Air coolers with high cooling and energy efficiency.
D. Premiumization trend continues across fans, lighting, and appliances.
E. Crompton was historically strong in B2B lighting and over the past few
years, its focus on B2C lighting has led to strong market share gains in this
segment as well.
+ ve
+ ve
+ ve
+ ve
- ve
28 August 2018
11
 Motilal Oswal Financial Services
Company
L&T
Takeaway
A. Maintains order inflow guidance of 10-12% for FY19; key segments driving
growth are Water, Roads, T&D, Metros, household electrification and
hydrocarbons.
B. Orders from the Middle East are seeing a revival post the rise in crude
prices.
C. Expect five coal-fired power plants to be awarded in FY19 totaling 6GW.
D. Private capex is still muted. Can be divided into three buckets: a) Industrial
capex seeing some signs of a revival but elections could result in delays in
orders; b) Residential capex continues to be subdued and FY17 was the
trough; and c) Consumption capex picking up in some pockets.
E. Aim of the buyback is to improve ROE’s for the company and efficiently
utilize the excess cash on the books.
Impact
+ ve
+ ve
+ ve
-ve
+ve
Company
Takeaway
A. Demand recovering at healthy base but next quarter will be a test
A. No acquisitions on the plate with focus on ROCEs for the time being.
B. Target from the Indonesian version of Project Pi (their cost savings
program) is similar to India at 2% of sales over a 1-2 year period.
C. Technology in distribution and data analytics was a relatively weak area
earlier. The company carried out a benchmarking exercise with peers on
nine pillars and the finding was that it is among the top 3 in the sector.
D. Crème is doing well in hair color. In powder, it launched Nupur in the
Henna Segment. Going forward, more disruptions are expected.
E. Improving the reach in Indonesia, beyond Jakarta and surroundings with
forays into Sumatra and Java.
A. Combination of government initiatives including good sowing owns up
well for demand prospects.
B. Cost savings were 7% of sales last year and were maintained for FY19.
Cost savings are led by the CCBT (Country Category Business Teams). This
will be led by factors across cost items like logistics robotics on
warehousing, absence of cascading taxes on GST enabling rationalization
of depots by 30-40%, etc.
C. Premiumization is a trend across all categories. Even in categories like
laundry where premiumization pace is still healthy, 60% of the category is
still masses-driven.
D. Bargaining power vs suppliers is increasing as scale increases further.
E. Unorganized segment isn’t going away as expected
Impact
+ ve
+ ve
+ ve
+ ve
Consumer
Godrej Consumer
ve
+ ve
Hindustan Unilever
+ ve
+ ve
+ ve
- ve
28 August 2018
12
 Motilal Oswal Financial Services
Company
Banks
AU Bank
Yes Bank
IndusInd Bank
Takeaway
A. Corporate credit growth at the system level has picked up albeit at a slow
pace.
B. New NPL formation to moderate from FY19.
C. Margins in the life insurance business to be driven by protection business.
A. Existing three products will form 80% of the new disbursements balance,
20% will be from business banking and corporates.
B. SA rate has been increased to 6.75% for INR10 lac and above.
C. Company will need tier-2 capital and is open to foreign funding.
D. Company’s on-book yield is 14.5%, incremental yield is 13.5% and MSME
yield is 15%.
A. MCLR repricing to happen in 3-6 months, near-term to maintain status
quo on margins.
B. IBU book margins at 1.6-1.8%, which impacts the overall margins.
C. Capital-raise likely over the next 6-12 months.
D. Yield on retail assets not high, the bank will push retail products after
cycle softens and competition eases.
A. Pilots in place and running up for BHAFIN customers, 8-9m BHAFIN
customers expected to be IIB customers. Stage-1 would be to form a
liability franchise, and Stage-2 would be to cross-sell asset products.
B. Scaled up to 2,000 villages but will continue to do more for pilot to be
successful. Idea to use grocery shop owners as distributors for consumer
durables.
C. Great scope from reconstruction opportunities in Kerala.
D. Overloading only in selective CV’s; quite bullish on CV and vehicles.
E. Insurance, credit cards, mutual funds are healthily contributing to fee
income.
Takeaway
Impact
+ ve
+ ve
+ ve
+ ve
- ve
+ ve
+ ve
- ve
+ ve
- ve
+ ve
+ ve
+ ve
+ ve
Company
Impact
Life Insurance
A. Management not in a hurry to build protection just to boost margins; fully
focused on need-based selling.
B. All the ‘credit protect’ sold is with single premiums and not regular
premiums.
C. Company’s EV sensitivity to interest rates is the least as compared to
peers as company hedges large part of their protection book.
D. Company has very few competitors in annuity business. Company writes
annuity business only for age 45 and above.
A. Jan Dhan and associated insurance initiatives from government has
significantly increased protection awareness. Further rising consumer
income is also driving growth in protection business.
B. Mortgage business penetration varies from 20-90% in affordable housing
segment.
C. Margin improvement and VNB growth to be driven by overall growth, mix
and persistency. Expense ratio to be a limited driver.
D. Capital consumption is faster in the protection business; not looking to
raise equity capital and will look to reduce special dividend or to raise
subordinate debt.
+ ve
+ ve
+ ve
+ ve
+ ve
+ ve
+ ve
+ ve
HDFC Life
ICICI Prudential Life
Insurance Co. Ltd
28 August 2018
13
 Motilal Oswal Financial Services
Company
NBFC
IHFL
SHTF
MMFS
SCUF
CAFL
Takeaway
A. Home loan growth robust, especially in the affordable housing segment.
B. Spread compression possible in some cases.
C. New axle load norms to have a minor impact on CV demand.
A. ~20% positive impact on net worth due to transition to Ind-AS.
B. Loan yields have increased 30-50bp; should help to largely maintain
spreads.
C. Good traction in online home loans – 25% of incremental business.
A. Expect 18-20% AUM growth if monsoon is good.
B. Credit costs to decline to ~2.5% in FY19 as per IGAAP.
C. 4-5% impact on M&HCV demand due to new axle loading norms.
A. 100 new branches opened last year contributing to growth.
B. Targeting RoA at 2.7% for FY19.
C. Will focus on mid-sized and used CV segment.
A. Expect 50-60bp drop in yield from 20.1% in FY18.
B. Hopeful to exit RoE of 18-20% in FY18.
C. Average tenor of SME loans increased from 36 months to 48 months over
the past 1.5 years.
A. Expect to expand branch count to 600 branches over the next five years.
B. Will run down infra lending book to ~INR30b in the next five years.
C. RoE to improve to 12% over the next 4-5 years.
Takeaway
A. Despite price erosion in the base business, the US market remains an
interesting opportunity driven by complex launches and constancy in
compliance.
B. Companies continue to mitigate increased prices of key starting materials
used to make API, either by changing source or in-house manufacturing.
C. Domestic formulation market is expected to grow at 10-12%, adjusting for
the low base of last year.
A. Institutional business to reduce to INR1.3b in FY19 vs INR4b in FY18 with
two major countries – Nigeria and Kenya going out of the GF program.
B. Company to see high-single digit growth in Africa and mid-teens growth in
Asia. Domestic formulation to grow in high-single digits.
C. Margins to decline 26-27% for FY19 from 31% in FY18 levels due to two
newly commissioned facilities, revenues from which have not kicked in yet.
A. In terms of profitability, Chronic business in domestic formulation segment
is now EBITDA profit, albeit in single digit EBITDA margin. EBITDA margin
for Acute segment is about ~25%. (+ve)
B. MR productivity is higher in Acute business with INR6m/MR per year.
While for Chronic it is almost half. (-ve)
C. Company expects better performance in the domestic segment in 2QFY19
on the back of a better monsoon season. (+ve)
D. Even the US business is in single-digit margin, which is dragging overall
EBITDA margin for the company.
E. Alkem expects approvals in the US in the next 2-3 months for its Baddi and
Daman facility.
Impact
+ ve
+ ve
- ve
+ ve
+ ve
+ ve
+ ve
+ ve
- ve
+ ve
+ ve
+ ve
- ve
+ ve
+ ve
+ ve
+ ve
+ ve
Impact
+ ve
+ ve
+ ve
- ve
+ ve
- ve
+ ve
+ ve
+ ve
- ve
- ve
Company
Healthcare
Ajanta Pharma
Alkem
28 August 2018
14
 Motilal Oswal Financial Services
Company
Aurobindo
Biocon
Cipla
Dr. Reddy
GSK Pharma
Shilpa Medicare
Strides Shasun
Takeaway
A. Injectable business in the US would ramp up on expected lines. Production
stopped due to bag-line related issue, but is expected to re-start from
October 2018. Maintaining target of USD200m injectable business in FY19.
B. There has been some improvement in the US base business due to
product rationalization by competitors.
C. ARBP is on track to garner USD50-60m sales in OTC segment for FY19
compared to USD20m in FY18 on the back of new launches and increased
traction in existing products.
A. BIOS guided for strong growth in biologics in 2HFY19 than 1HFY19 on
launches in newer markets and better traction in existing market.
B. BIOS guided for mid-teens YoY growth in branded formulation, partly on
low base of last year.
C. Company has guided for capex of INR15b over next two years, mainly for
greenfield expansion.
D. Of the capex planned, one will be for an anti-bodies facility in Bangalore.
This will be completed in two phases in four years. First phase is expected
to be completed by 2020 and commercialization is to start from 2021.
A. Though 1QFY19 US sales were flat YoY, Cipla remains confident of better
traction going forward from recent as well as new product approvals.
B. Sales of a couple of US products were impacted due to supply side issues.
With it now being resolved, Cipla expects sales to pick up, aiding overall
sales growth in the US. Cipla guided for an exit run-rate of annualized
USD500m US business from 4QFY19 onwards.
C. YoY growth in Domestic Formulation has been lower-than-expected due to
seasonality in acute segment in the recent past and high base of past year.
However, it remains confident of healthy growth going forward.
A. DRRD is in the process of data investigation and analysis at Srikakulam API
site with respect to observations cited in USFDA warning letter in Nov-2015.
B. DRRD has potential launches in 2HFY19 with a market size of ~USD25-40m
per product.
C. Healthy growth in EM markets is expected on the back of new launches
and increased traction in existing products.
A. GSK is in the process of rationalizing its portfolio by hiving off low-margin
products.
B. To grow in line with Industry for next 1-2 years.
C. GSK has increased its MR count by 30% YoY to enhance focus in tier-3 and
tier-4 cities.
D. The company has guided for EBITDA margin in the 20-25% range for the
next 1-2 years.
A. Low volume API prices were impacted least due to pollution led slowdown
in manufacturing in China. SLPA being into such APIs had minimal impact
from the increased prices of key starting material imported from China.
B. With 34 pending approvals and compliance in place, SLPA is well placed to
see strong US growth.
C. Capex related to Biologics (~INR1.5b) and transdermal patches (~INR1.2b)
remain on track and are to be spent over the next 1-2 years.
A. To witness significant operating leverage, with the US business now
breaking even. Sales are expected to ramp up from recent and upcoming
approvals.
B. STR is in the process to increase growth as well as profitability in the
Australia market through increasing reach, enhancing portfolio and
Impact
+ ve
+ ve
+ ve
+ ve
+ ve
+ ve
+ve
+ ve
+ ve
+ ve
+ ve
+ ve
+ ve
+ ve
+ ve
+ ve
+ ve
+ ve
+ ve
+ ve
+ ve
15
28 August 2018
 Motilal Oswal Financial Services
increasing manufacturing from India facility.
C. STR guided for ~400bp EBITDA margin improvement over the next 2-3
years.
D. Expect 2H to be much better than 1H due to approvals for key products.
E. STR has about nine First to Files (FTFs).
Company
Takeaway
+ ve
+ ve
+ ve
Impact
Media
A. Digital business is expected to start contributing to FY19 ad revenue.
Likely to share key metrics from 2QFY19.
B. Maintained guidance of outperforming industry ad revenue growth. So if
the industry grows at 10-12%, Zee ad revenues can grow at over 15%.
C. Expect low-teen subscription growth in FY19 driven by phase III
monetization, HD penetration from current single digit, and 3-4%
continued TV penetration.
D. ZEE5 targets to become the no. 1 entertainment OTT app in India in the
next 18 months.
E. Expects new business (movies, music, digital and live-events) to contribute
~30% of the overall revenue in the near-term.
Takeaway
+ ve
+ ve
+ ve
+ ve
+ ve
Impact
ZEE Entertainment
Company
Metals
A. LME is lower despite the impact of increase in input prices partly due to
the play of currencies. USD has appreciated against most other currencies.
Thus, while LME is not higher, cost of production in USD terms has come
down.
B. Aleris EBITDA guidance does not consider any synergy benefits. It only
considers the EBITDA potential from the new US auto line, where visibility
is strong.
C. It expects the Supreme Court to relax the petcoke ban for the aluminum
industry, just like it did for cement and some other industries where
petcoke is used as feedstock.
A. Domestic demand remains strong. Infrastructure and auto sector
particularly driving demand.
B. Realisation is likely to be marginally lower QoQ in 2Q. Pricing is expected
to recover from Sep/Oct.
C. Coking coal cost will be marginally higher. INR depreciation could have
some impact on cost.
D. Bhushan Steel: Margin improvement will be driven by branding of Tata
Steel, iron ore integration, squeezing working capital, and operating
process optimisation. Ramp-up to 5mt likely in two years.
Hindalco
Tata Steel
28 August 2018
16
 Motilal Oswal Financial Services
Company
Takeaway
Impact
Oil & Gas
A. A. Gas consumption in the country likely to be driven by upcoming six
fertilizer plants, refineries and CGDs. Power sector can contribute only if
some reforms come up. Expect transmission volume to grow from the
current 107mmscmd to ~120-125mmscmd over the next 3-4 years.
Unbundling likely on the back burner, unified tariff imminent, but may
take more time to fructify.
B. B. With high crude oil prices, US contracts very profitable. In FY19, GAIL
expects to off take ~5.8mmtpa - placement of almost 90% of this has
been taken care of. Almost 60% of FY20 volumes have been placed.
Although, it has not signed any long term contracts, the company is
confident of placing volumes profitably in the current scenario.
C. C. Some teething issues exist, but the petrochem plant is broadly
stabilized. There are no further major expansions coming up in India for
another 3-4 years. The tender for Dabhol LNG terminal's breakwater
would be floated soon. A total expenditure of INR12b is expected,
including INR5b on utilities. Post the tender award it would take another
three years for completion.
A. We expect volume growth in CNG to continue in double digits led by
commercial vehicles, new geographies and inter-city travel. Restrictions
on diesel vehicles could see conversion in LMVs which could be a huge
potential for growth. Due to unequal VAT in Delhi & UP, prices in Delhi
are INR7/kg lower which has also been driving volume growth.
B. Bids for new Geographical Areas have been very aggressive as the recent
awards suggest. Many of these will face penalties, especially in household
segment. Many of these are likely to fail unless some other structural
change is brought in the future.
C. Do not expect any regulation to come up on pricing. CNG currently is
substantially cheaper than alternate transportation fuels.
A. Bidding in the 9th CGD round very aggressive. Most traditional players left
out, which means that bids were on very low IRRs. Only time will tell how
many of these would be successful.
B. Penetration in Mumbai and adjoining areas for CNG & PNG-dom tickets is
still low. Unlike Delhi, volume growth in Mumbai is primarily driven by
economics - there is a restriction on the number of CNG stations that can
be opened up in a busy city like Mumbai. Pollution would nonetheless
remain a concern. Expect volume growth of 5-7% over the next few years.
C. Expect more restrictions on polluting fuels like petcoke and fuel oil. Mumbai,
however, does not present much potential in the industrial segment. There is
a lot of potential though in the commercial segment, which is being tapped.
Do not expect any regulation to come up in pricing of CGDs.
GAIL
IGL
Mahanagar Gas
28 August 2018
17
 Motilal Oswal Financial Services
Company
Takeaway
Impact
Real Estate
A.
DLF has revised its strategy in residential development by adopting the
build/complete and sale model. It has INR150b worth of inventory, which is
largely complete and it expects to sell INR25b annually.
B.
60% of the inventory is premium and luxury. This includes projects like the Crest
(
INR50
-60m ticket size) and The Camelias (INR250-300m ticket size).
C.
The company has started seeing green shoots in terms of price increase in Delhi
and
Gurgaon
market.
D.
Under the new model, the company does not foresee any working capital issues
as the land is already paid for and construction can be funded through a bank
loan at 9%.
+ ve
+ ve
+ ve
+ ve
+ ve
+ ve
+ ve
DLF
E.
In DLF, the
company
plans to be fully debt free by end-FY19.
F.
In DLF, company has a potential of 180msf of residential development and 40msf
of
commercial
development. In DCCDL it has 19msf of potential commercial
development.
G.
Company
expects
rental income of INR25b annually to grow by 15% through mix
of volume and rental increase.
The Phoenix Mills
A. Ahmedabad JV with Safal Group is the only JV the company has entered
into till date. Safal Group was unwilling to part with the land but they
were willing to pay PHNX the required fees to develop the design and
manage the property development as per PHNX’s requirement, which is
what led to the joint venture.
B. PML has committed majority of equity infused by CPPIB and is not looking
to increase the exposure. Markets like Hyderabad, Chandigarh, and
Mumbai are on its radar. Going forward, PHNX will look to acquire ready
assets.
C. The company has INR5b cash on its balance sheet and debt of INR3b as of
August 2018.
D. Expect substantial free cash flows from residential projects - Selling prices
for the projects more than doubled in the last five years (CAGR of 18-20%
over the last five years), while constructions costs have increased by only
5-10%.
E. The company undertook residential development in Bangalore due to the
track record of such developments surrounding its own malls delivering
substantial returns. Bengaluru - Commenced handover of flats in OBW
Towers 1-5; Execution at OBW Tower 6 is progressing well. Chennai -
Construction completed in Tower A, B and C; Occupation Certificate for
the towers received.
F. PHNX will incur a cumulative capex of INR4.8b till FY23, of which the
company has already invested INR2.1b.
+ ve
+ ve
+ ve
+ ve
+ ve
+ ve
28 August 2018
18
 Motilal Oswal Financial Services
Company
Takeaway
Impact
Retail
A. Madura division to register high-single digit SSSG and add ~350 gross
EBOs.
B. Pantaloons is expected to add ~60 new stores and single digit SSG is
driving 18-20% revenue growth.
C. Expect ‘innerwear’ category to contribute INR2b revenue in FY19. Target
to reach INR5b in next three years led by an increase in distribution
channels.
D. Madura EBITDA margin to expand 100bp annually for next three years led
by healthy SSSG, network expansion and premiumization.
E. Pantaloons EBITDA margins would expand about 100bp led by SSG, uptick
in private labels contribution (expected to reach 70-75%) and scale
benefits.
A. Growth in July was good but August was relatively subdued meaning
growth could be at the lower-end of the 20-25% range for FY19.
B. Walk-ins continue at a healthy pace leading to healthy growth in the
exchange business, which is already 43% of procurement and could
exceed the 50% target for the next two years.
C. Target of 40 stores a year is likely to be maintained, almost all stores being
franchised.
D. Bigger stores have dedicated wedding collection, what they may lose out
on gross margins is recouped on operating leverage as fixed cost
absorption is better. Target of wedding jewelry and studded jewelry is on
track.
E. Watches business EBITDA margins likely to be around 12-15% for FY19
versus earlier statement of double digit margins.
+ ve
+ ve
+ ve
+ ve
Aditya Birla Fashion
and Retail
Marginally
-ve
+ ve
Titan
+ ve
28 August 2018
19
 Motilal Oswal Financial Services
Company
Takeaway
Impact
Technology
A. Naukri.com benefiting from B to B model as compared to peers, saw
improvement in IT traction going forward
B. 99 acres will be benefited in terms of margins from evolution of single
large brokerage houses like Anarock
C. Zomato will see explosive growth but also proportionate burn during the
year. FY18 cash burn should not be the benchmark
A. Deal sizes in digital are smaller, but deals are executing better margins on
standalone basis but higher investments for deal sourcing are taking
margins similar to company level
B. US have been showing much greater growth, although challenges persist
in Europe business. Overall, renewals-led pressure should be behind after
1HFY20
C. Both subcontracting and digital is taking into play to source deals in newer
technologies. Margin to be in the range of 19.5-20.5%
A. Persistent will deploy traditional dividend policy for its excess cash; will
hold on to buyback for potential future acquisitions.
B. Persistent has been late on its IOT front, it expects USD 3-5mn this year
from IOT, revenue will be generated from analytics which uses data from
machine interaction.
C. Persistent expects 100 bp increase in its operating margins going forward,
guiding a range of 16-16.5%, increase in margins would be a result of
better execution on reseller business.
A. Beyond BFSI and Retail company grew at 13.2% cc, better execution
promised in BFSI going ahead.
B. Digital is currently composed of hundreds of technologies, many of which
are subscale. These still need investments, and profitability is bound to
increase as technology matures.
C. Ramp up of large deals is staggered through the course of the year. Hence,
normal seasonality should manifest this year too.
Takeaway
+ ve
+ ve
-ve
+ ve
- ve
+ ve
+ ve
+ ve
+ ve
+ ve
+ ve
+ ve
Impact
Info Edge
HCL
Persistent
TCS
Company
Utilities
A. 50% of revenue and EBITDA is regulated, which had low volatility. While
higher coal prices impacted profits at Mundra, there is more than
corresponding benefit at coal mines. Hence, the volatile portion of
business is even lower.
B. Indonesia DMO will impact profits by USD10-15m. Indonesia is considering
a proposal to allow higher coal mining limit, with no DMO obligation on
incremental production. It could offset some portion of the impact DMO.
C. Non-core asset sale remains the focus. Tata Project is the key non-core
asset remaining to be sold.
Tata Power
28 August 2018
20
 Motilal Oswal Financial Services
Company
Takeaway
Impact
Midcaps/Others
A. MF platform is a significant opportunity. Revenues here have the potential
of doubling YoY for next few years. May do ~INR200m this year. (+Ve)
B. The change of pricing in equities cash from ad valorem to per-trade did
not succeed. Hence, have reverted to earlier pricing methodology (-ve)
C. Technology will be the differentiator in commodities segment. Have
recruited among the best personnel in the space. (+ve)
A. Delta has already acquired a 100 acre land for the purpose of setting up
an integrated resort. It is looking to purchase another 50 acre land parcel
for the same purpose.
B. The company is expecting an announcement of an official notification on
land-based casino policy soon. The broad contours of the policy have
already been announced by Mr. Manohar Parrikar, Chief Minister of Goa
in the recently assembly session.
C. Three licenses will be used to set up three land-based properties catering
to different segments, just like the floating boats.
D. Currently, about 6.5m tourists visit Goa, which is expected to grow at 7%.
E. Online business should continue to see 30-40% growth, however, margins
will remain under pressure due to increased competitive intensity and
increased promotion related spends.
A. Raw material supply disruption will take another 2-3 quarters to
normalize. Some products have seen inflation of 50-60%.
B. Orange oil, a key raw material, which was up 30% last year is expected to
increase 20% this year.
C. In the fine fragrances segment, fragrance accounts for 10% of the selling
price versus 2% for other products.
D. China-based Anhui Ruibang Aroma acquisition will provide access to
another Tonalid manufacturing facility - to enable SHKL to consolidate its
market leadership in the segment.
E. The company has already won new business of INR300m from its existing
clients.
F. The company will incur maintenance capex of INR200-250m in FY19.
G. Fragrances and Flavors’ segments are expected to grow at 20% CAGR in
FY19 despite a weak 1HFY19. However, margins will remain subdued.
A. Impact of GST and loss on one large customer on growth have bottomed
out and company can see better growth going ahead
B. Will be open to businesses with lesser Gross margins, if there is no
significant uptick in fixed costs. May imply lower margin but similar /
better absolute operating profit.
C. Increase in number of registered companies from 7.5m to 12m in the last
12 months since GST came into effect should positively impact the growth
rate.
+ ve
+ ve
+ ve
+ ve
+ ve
- ve
- ve
+ ve
+ ve
+ ve
+ ve
+ ve
+ ve
- ve
+ ve
Delta Corp
SHKL
Teamlease
28 August 2018
21
 Motilal Oswal Financial Services
In conversation
1. HDFC LTD : Open to acquisitions in both general & life
insurance segments; Keki Mistry, VC & CEO
General insurance business and education finance arm will be the next in line to
be listed in next few years.
HDFC Credila we put in money, it is education finance business. Then we said we
would look at the health insurance business. It would require capital whether it
is organic or inorganic, it would require capital. So that is a secondary approach.
Third is we talked about stressed real estate business so whilst it would be a
funds structure, some percentage of the money in that fund will have to be put
in by us to give confidence to ultimate investors, all of that will consume capital
over a period of time
2. SBI : Confident that peak of npa recognition has been reached;
Rajnish Kumar, Chairman
As far as the recognition of the non-performing assets (NPAs) is concerned,
March 31, 2018 the peak has been reached. If you look at the results of the
banks, in the first quarter, irrespective of their profit and loss (P&L) one trend is
clearly visible that the NPLs are coming down and going forward also they will
continue to come down
3. LIC HOSUING FINANCE : Pickup in realty sector should help lift
growth rates; Vinay Sah, MD & CEO
Last year our growth rates for the fiscal year 2017-2018 were in the range of 18-
19 percent. Because the loan book base is very high, we would try to reach that
number but it should be more than 15 percent by maybe a couple of
percentages. Loan book growth rate is also helped by whatever prepayments we
are able to stop. We have also done a lot of work on re-writing of the cases
whereby there is some sort of exit can happen and because these rewriting was
more than last year, prepayments were less than last year so that has also
contributed to better growth rate in the loan book.
28 August 2018
22
 Motilal Oswal Financial Services
From the think tank
1. Games Indian banks play in injury time
Corporate banking in India is one of those painful-to-watch soccer games
stretching goallessly into injury time. Neither the creditors nor the debtors have
the energy to carry on, yet they’re dreading the long whistle: that’s when both
sides lose. The match was supposed to end Monday, going by the 180-day
deadline the Indian banking referee gave lenders on 1 March to restructure
defaulted loans of a minimum size of around $300 million, failing which they
would have to send the non-performing borrowers to the insolvency tribunal.
2. MSP hike won’t help bulk of rural folk, govt advisors may
need to go backto the drawing board
Even as it remains to be seen whether the government will be able to
successfully implement its promise of buying all crops from farmers at a
minimum support price (MSP) equal to 1.5 times their A2+FL costs, or make
deficiency payments based on the MSP if they can’t procure the crop, the latest
report from Nabard—All India Rural Financial Inclusion Survey 2016-17—as well
as Price’s latest all-India survey add new perspective to the debate.
For one, of the 212 million rural households the Nabard survey talks of, just
around 100 million are considered to be ‘agricultural’, effectively implying that
the MSP-based policy will apply to just half of rural India. Indeed, the actual
impact will be far less since Nabard defines an ‘agricultural household’ as one
that earned at least Rs 5,000 from various crops in the last one year and has at
least one person employed in the sector, even if just for a temporary period in
the last year; so the benchmark for being ‘agricultural’ is very low.
28 August 2018
23
 Motilal Oswal Financial Services
Click excel icon
for detailed
valuation guide
Valuation snapshot
Company
Automobiles
Amara Raja
Ashok Ley.
Bajaj Auto
Bharat Forge
Bosch
CEAT
Eicher Mot.
Endurance Tech.
Escorts
Exide Ind
Hero Moto
M&M
Maruti Suzuki
Motherson Sumi
Tata Motors
TVS Motor
Aggregate
Banks - Private
AU Small Finance
Axis Bank
DCB Bank
Equitas Hold.
Federal Bank
HDFC Bank
ICICI Bank
IndusInd
J&K Bank
Kotak Mah. Bk
RBL Bank
South Indian
Yes Bank
Aggregate
Banks - PSU
BOB
BOI
Canara
Indian Bk
PNB
SBI
Union Bk
Aggregate
NBFCs
Aditya Birla Cap
Bajaj Fin.
Capital First
Cholaman.Inv.&F
n
GRUH Fin.
HDFC
HDFC Stand. Life
ICICI Pru Life
Indiabulls Hsg
L&T Fin Holdings
LIC Hsg Fin
Reco
Buy
Buy
Buy
Buy
Neutral
Buy
Buy
Buy
Neutral
Buy
Neutral
Buy
Buy
Buy
Buy
Neutral
CMP
TP % Upside
EPS (INR)
EPS Gr. YoY (%)
P/E (x)
P/B (x)
ROE (%)
(INR) (INR) Downside FY18 FY19E FY20E FY18 FY19E FY20E FY18 FY19E FY18 FY19E FY18 FY19E
876
133
2702
650
18746
1412
28912
1542
888
292
3224
978
9249
305
259
564
946
149
3223
747
19280
1588
34111
1691
988
314
3446
1084
10805
388
360
548
8
12
19
15
3
12
18
10
11
7
7
11
17
27
39
-3
27.6
5.4
151.3
17.7
469.8
64.0
799.6
29.1
39.5
8.2
185.1
41.0
266.7
8.2
22.9
13.9
29.3
6.6
153.9
23.5
584.2
76.1
966
37.1
52.5
10.6
193.4
48.3
311.2
10.2
30.1
15.6
36.3
8.7
174.6
29.3
712.6
99.2
1,238
49.1
65.9
12.8
219.0
55.5
409.2
14.6
38.2
22.8
-1.5
23.9
7.3
34.9
-0.7
-31.5
27.0
23.8
88.0
0.4
9.5
49.8
7.3
5.9
15.7
18.7
15.2
6.2
23.4
1.7
33.2
24.3
19.0
20.9
27.8
32.8
29.1
4.5
17.8
16.7
24.4
31.3
11.6
18.6
23.8
30.5
13.5
24.5
22.0
30.4
28.1
32.3
25.5
21.4
13.2
14.8
31.5
44.0
26.9
46.1
24.9
31.7
24.7
17.9
36.8
39.9
22.1
36.2
53.1
22.5
35.7
17.4
23.8
34.7
37.3
11.3
40.4
25.4
29.9
20.0
17.6
27.6
32.1
18.6
29.9
41.5
16.9
27.6
16.7
20.2
29.7
30.0
8.6
36.2
21.4
5.1
5.4
4.1
6.5
5.7
2.2
11.2
10.0
3.6
4.6
5.5
3.8
6.7
6.9
0.9
9.3
3.9
9.1
2.6
2.0
2.2
1.3
5.1
2.1
4.9
0.5
4.8
4.0
0.6
3.4
3.7
1.0
0.5
0.6
0.9
0.6
1.3
0.4
0.9
3.5
11.0
2.4
4.5
18.7
5.2
6.1
2.9
3.6
3.2
2.2
4.5
4.7
3.7
5.6
5.2
2.0
8.7
8.4
3.0
4.1
4.9
3.4
5.9
5.9
0.8
7.9
3.5
6.6
2.4
1.8
2.1
1.2
3.8
2.1
4.3
0.5
4.2
3.6
0.6
2.9
3.1
0.9
0.5
0.6
0.9
0.7
1.2
0.4
0.9
3.0
9.1
2.1
3.7
15.3
4.5
5.1
2.5
3.2
2.7
1.9
17.0
23.7
24.2
18.8
15.3
10.3
35.2
21.0
18.3
12.9
33.8
14.2
18.5
19.5
10.1
25.1
15.5
13.8
0.5
10.9
1.4
8.3
17.9
6.8
16.5
3.8
12.5
11.6
6.6
17.7
10.4
-5.8
-17.8
-12.2
8.3
-29.6
-3.5
-23.7
-8.0
12.4
20.4
13.4
20.9
31.8
18.6
25.8
16.1
27.9
14.2
17.0
15.9
25.1
22.1
21.7
17.0
11.2
32.7
22.0
19.3
14.9
31.1
14.5
19.5
21.2
10.1
23.6
16.3
14.9
7.8
10.8
7.1
9.1
16.6
6.2
19.4
6.7
11.8
12.3
5.7
19.5
11.6
6.9
2.5
3.9
9.4
-6.4
2.4
-2.1
2.5
10.9
21.1
15.7
21.0
31.8
17.5
26.0
16.8
28.3
19.3
17.2
Buy
Buy
Neutral
Buy
Buy
Buy
Buy
Buy
Buy
Neutral
Buy
Buy
Buy
721
650
173
145
80
2080
340
1948
54
1274
635
18
383
760
670
170
175
110
2400
355
2250
100
1400
700
26
444
5
3
-2
21
38
15
4
15
86
10
10
48
16
10.2
1.1
8.0
0.9
4.8
67.8
11.1
60.2
3.8
32.5
15.1
1.9
18.4
14.0
20.1
9.5
4.9
5.8
79.2
9.9
81.8
6.5
37.2
20.6
1.7
23.8
19.8
35.9
11.2
9.7
7.9
94.9
20.8
108.2
7.8
45.7
28.0
3.9
30.7
-79.5 37
40.8 70.3 51.4
-92.8 1,705 79.2 585.0 32.4
13.8 18.9 18.2 21.8 18.3
-82.3 427.2 99.5 156.6 29.7
-1.3 22.8 35.2 16.8 13.7
19.4 16.8 19.9 30.7 26.3
-34.3 -10.8 110.5 30.7 34.5
25.2 36.0 32.2 32.4 23.8
LP
74.1 19.7 14.3 8.2
21.3 14.2 22.9 39.2 34.3
27.3 36.3 35.6 42.0 30.8
-25.5 -9.7 134.2 9.5 10.5
26.3 29.0 29.2 20.8 16.1
-1.3 30.7 43.1 35.1 26.9
PL
Loss
PL
-10.4
PL
PL
PL
PL
NA
35.9
34.3
35.5
LP
LP
LP
22.7
Loss
LP
Loss
LP
22.4
44.5
33.4
20.8
25.5
10.1
22.6
2.4
18.0
74.7
14.3
67.9
62.7
129.2
66.1
LP
286.2
LP
291.2
34.8
32.2
26.0
18.9
13.1
19.4
22.5
8.4
19.0
17.4
18.7
NM
NM
NM
12.6
NM
NM
NM
0.0
37.1
68.0
19.2
23.4
66.6
45.5
83.4
34.0
14.2
26.7
13.4
12.9
18.6
14.8
10.2
NM
39.0
NM
36.4
30.3
47.1
14.4
19.3
53.0
41.3
68.1
33.2
12.0
15.3
11.7
Buy
Neutral
Neutral
Buy
Neutral
Buy
Neutral
150
95
285
330
85
308
90
175
90
278
430
85
360
97
17
-5
-2
31
0
17
8
-9.8
-43.2
-63.5
26.2
-50.3
-5.3
-56.5
11.7
5.1
19.3
32.2
-8.9
7.9
-4.3
19.6
8.3
44.2
53.4
8.0
30.5
3.5
Buy
Neutral
Buy
Buy
Neutral
Buy
Buy
Buy
Buy
Buy
Neutral
139
2952
637
1456
330
1924
461
384
1282
181
528
200
2500
960
1700
300
2335
525
450
1650
240
600
44
-15
51
17
-9
21
14
17
29
33
14
3.8
43.4
33.1
62.3
4.6
62.7
44.2
75.3
6.2
82.9
55.6
89.5
5.0
6.2
7.0 21.9
42.3 46.5 55.6 6.2
5.5
6.8
8.3 23.7
11.3 11.6 12.5 -3.8
90.2 106.4 126.6 31.5
6.8 11.8 13.9 29.5
39.4 45.0 53.5 3.0
28 August 2018
24
 Motilal Oswal Financial Services
Click excel icon
for detailed
valuation guide
CMP
TP % Upside
(INR) (INR) Downside
594
750
26
470
600
28
410
460
12
1410 1750
24
557
710
28
2005
1358
2500
1650
25
21
EPS (INR)
FY18 FY19E FY20E
19.2 24.5 30.7
17.4 20.3 24.2
43.0 44.8 48.9
49.9 63.0 78.4
32.9 40.9 45.9
Valuation snapshot
ROE (%)
FY18 FY19E
21.2 17.7
12.5 12.4
24.1 21.4
13.9 15.2
16.9 18.0
12.7
12.7
14.8
11.6
18.0
2.5
17.5
48.7
4.5
18.3
15.7
17.3
18.7
23.1
13.7
9.1
21.9
8.8
12.4
15.9
11.0
6.1
9.7
3.8
9.5
8.0
2.0
6.1
14.4
4.4
27.4
6.5
6.9
16.2
9.4
8.2
25.3
32.9
49.0
25.9
29.2
-3.3
24.9
21.2
78.1
22.3
15.4
16.9
15.7
13.3
17.2
3.6
21.8
44.8
6.9
17.7
16.8
23.4
20.4
21.3
14.3
10.8
22.4
12.3
12.9
15.1
12.0
7.8
14.0
6.6
11.1
12.6
3.5
9.1
14.1
9.9
22.7
12.0
8.1
15.5
10.5
10.8
25.7
32.6
48.3
23.4
30.2
1.2
24.8
22.5
86.9
22.9
Company
Reco
MAS Financial
Buy
M&M Fin.
Buy
Muthoot Fin
Neutral
PNB Housing
Buy
Repco Home
Buy
Shriram
City
Buy
Union
Shriram Trans.
Buy
Aggregate
Capital Goods
ABB
Sell
Bharat Elec.
Buy
BHEL
Sell
Blue Star
Neutral
CG Cons. Elec.
Buy
CG Power & Indu. Neutral
Cummins
Buy
Engineers India Buy
GE T&D
Neutral
Havells
Buy
K E C Intl
Neutral
L&T
Buy
Siemens
Neutral
Solar Ind
Neutral
Thermax
Buy
Va Tech Wab.
Buy
Voltas
Neutral
Aggregate
Cement
Ambuja Cem.
Neutral
ACC
Buy
Birla Corp.
Buy
Dalmia Bharat
Buy
Grasim Inds.
Neutral
India Cem
Neutral
JK Lakshmi Ce
Buy
Ramco Cem
Buy
Orient Cem
Buy
Prism Johnson
Buy
Sagar Cements Not Rated
Sanghi Inds.
Buy
Shree Cem
Buy
Ultratech
Buy
Aggregate
Consumer
Asian Paints
Neutral
Britannia
Buy
Colgate
Buy
Dabur
Neutral
Emami
Buy
Future Consumer Buy
Godrej Cons.
Neutral
GSK Cons.
Neutral
HUL
Buy
ITC
Neutral
EPS Gr. YoY (%)
P/E (x)
P/B (x)
FY18 FY19E FY20E FY18 FY19E FY18 FY19E
27.5 27.7 25.3 31.0 24.3 4.6
4.0
146.3 16.2 19.3 27.0 23.2 3.0
2.8
45.6 4.1
9.2
9.5
9.2
2.1
1.8
57.7 26.4 24.4 28.3 22.4 3.6
3.2
13.1 24.0 12.3 16.9 13.6 2.7
2.3
35.8
58.4
23.7
27.0
6.1
45.6
37.6
23.4
52.6
12.6
0.8
56.4
23.4
12.5
15.4
27.0
21.1
51.4
34.5
9.3
18.8
33.9
54.7
99.2
28.7
76.8
80.2
58.1
8.0
138.5
416.9
101.0
45.4
10.0
20.5
43.6
15.8
23.8
20.7
24.5
16.4
28.0
25.7
22.6
16.1
20.4
17.0
12.7
22.1
27.8
22.0
19.8
29.8
30.1
14.8
14.5
21.6
18.0
27.4
31.6
51.8
27.2
38.1
67.3
47.4
62.6
33.5
39.7
40.5
45.3
36.9
34.4
19.9
19.7
34.0
66.7
20.3
36.3
47.2
50.8
20.7
32.8
19.8
38.7
64.3
17.3
26.2
52.1
49.6
49.3
15.7
36.1
31.8
39.8
35.3
41.6
49.1
18.8
37.1
44.5
28.3
53.3
106.0
29.3
22.5
48.1
51.0
39.0
14.6
12.4
27.5
52.5
19.2
25.0
34.3
41.2
13.6
29.2
19.6
24.8
52.1
15.4
22.7
41.0
40.9
32.6
11.7
33.0
26.8
29.7
22.8
20.9
38.2
10.6
20.6
28.1
26.2
22.3
20.5
14.6
15.4
43.7
42.3
27.2
2.4
2.3
5.0
7.8
3.7
0.9
7.9
20.8
1.0
5.4
3.7
6.2
12.0
4.0
3.4
4.8
10.1
4.2
1.8
5.3
3.5
2.4
3.3
1.4
4.5
1.4
0.7
2.7
3.9
2.3
5.4
1.9
1.3
7.3
4.6
3.2
2.1
2.0
4.3
7.0
3.3
0.9
7.1
16.6
0.9
5.0
3.4
5.4
10.6
3.3
3.1
4.4
8.4
3.8
1.7
4.7
3.2
2.3
3.1
1.4
4.0
1.3
0.7
2.4
3.5
2.1
4.4
1.7
1.2
6.3
4.3
2.9
15.0
21.3
19.5
11.9
10.7
7.7
13.2
8.1
51.8
6.9
100.8 136.9 158.5 19.5
69.1 109.4 135.5 24.7
25.2
19.8
5.7
2.2
14.5
5.2
2.9
23.5
6.3
7.5
11.2
17.9
51.7
19.8
24.4
20.5
24.1
17.3
25.2
6.1
3.2
20.0
6.4
4.4
26.5
6.3
11.7
13.8
20.1
59.7
25.1
29.5
31.1
32.4
18.9
31.3
7.1
4.1
25.1
7.8
5.1
31.9
7.4
13.2
16.9
25.7
72.8
30.1
38.3
40.4
37.2
21.6
8.1
-8.8
64.1
12.7
14.3
-29.8
-11.2
14.8
30.8
17.4
51.1
22.4
10.9
18.2
-1.2
27.6
11.9
15.1
30.5
27.7
-35.6
106.8
-15.4
-42.0
5.8
-12.3
LP
288.2
LP
29.5
0.4
-10.9
-0.7
1322
117
80
684
263
60
772
124
290
721
310
1356
1030
1209
1013
379
624
950
145
60
695
305
60
800
155
330
645
360
1570
1070
1150
1295
450
590
-28
24
-25
2
16
0
4
25
14
-11
16
16
4
-5
28
19
-5
242
1655
787
2742
1079
121
328
675
115
112
737
84
18566
4373
231
1633
1030
3198
1084
120
384
802
139
136
-
130
19804
4536
-4
-1
31
17
0
-1
17
19
21
21
56
7
4
6.1
46.9
18.9
55.9
57.4
3.3
7.4
23.9
2.2
1.1
25.2
3.7
385.8
85.7
8.1
72.5
37.7
71.9
101.4
5.9
11.6
25.8
5.1
5.5
50.6
5.4
424.5
103.3
9.6
92.4
49.6
109.1
129.0
8.1
19.5
38.0
8.4
7.3
70.6
7.6
617.1
141.4
1400
6820
1158
482
548
47
1403
7529
1792
313
1405
7165
1360
440
665
69
1240
6710
2010
295
0
5
17
-9
21
47
-12
-11
12
-6
21.1
83.6
25.2
7.8
12.1
-0.2
21.1
166.5
24.5
8.9
23.3 28.3 1.9
98.6 124.9 13.5
27.8 32.5 18.6
8.5
10.1 7.2
14.4 17.2 -8.5
0.1
0.9 Loss
24.5 28.5 11.4
197.3 222.1 6.6
29.2 35.6 24.7
10.0 11.4 5.5
10.1 21.6 66.2 60.1 16.0
17.8 26.7 81.5 69.2 24.0
10.5 16.7 46.0 41.6 20.7
9.7
18.9 62.0 56.5 14.9
18.8 19.5 45.2 38.0 12.4
LP 1,080.9 NM 623.5 7.8
16.1 16.2 66.5 57.3 15.3
18.5 12.6 45.2 38.2 9.1
19.5 21.8 73.2 61.3 54.8
13.2 13.8 35.4 31.3 7.4
28 August 2018
25
 Motilal Oswal Financial Services
Click excel icon
for detailed
valuation guide
CMP
Company
Reco
(INR)
Jyothy Lab
Neutral
204
Marico
Neutral
377
Nestle
Neutral 11335
Page Inds
Neutral 35746
Parag Milk Foods Neutral
301
Pidilite Ind.
Buy
1161
P&G Hygiene
Neutral 10040
Prabhat Dairy
Not Rated 152
United Brew
Buy
1389
United Spirits
Neutral
633
Aggregate
Healthcare
Alembic Phar
Neutral
596
Alkem Lab
Buy
2031
Ajanta Pharma Buy
1232
Aurobindo
Buy
689
Biocon
Neutral
608
Cadila
Buy
396
Cipla
Neutral
659
Divis Lab
Neutral
1298
Dr Reddy’s
Neutral
2442
Fortis Health
Buy
149
Glenmark
Neutral
653
Granules
Buy
115
GSK Pharma
Neutral
3384
IPCA Labs
Buy
751
Jubilant Life
Buy
732
Laurus Labs
Buy
438
Lupin
Buy
908
Sanofi India
Buy
6175
Shilpa Medicare Buy
514
Strides Shasun
Buy
482
Sun Pharma
Buy
622
Torrent Pharma Neutral
1782
Aggregate
Infrastructure
Ashoka Buildcon Buy
141
IRB Infra
Neutral
196
KNR
Buy
233
Constructions
Sadbhav
Buy
265
Engineering
Aggregate
Logistics
Allcargo Logistics Buy
120
Concor
Buy
646
Aggregate
Media
Dish TV
Buy
72
D B Corp
Neutral
248
Ent.Network
Buy
697
Hathway Cable Buy
18
Hind. Media
Neutral
161
HT Media
Neutral
54
Jagran Prak.
Buy
121
TP % Upside
(INR) Downside
220
8
370
-2
10620
-6
31600
-12
314
4
1325
14
10250
2
-
1550
12
615
-3
EPS (INR)
FY18 FY19E FY20E
4.9
5.7
7.0
6.5
7.6
9.0
140.0 181.0 197.8
311.1 412.2 529.4
10.4 12.0 14.9
18.9 19.7 23.5
115.3 156.6 186.4
3.5
6.4
9.7
14.9 18.7 23.7
6.7
9.2
13.2
Valuation snapshot
P/B (x)
FY18 FY19E
6.5
6.0
19.1 16.6
32.0 29.0
47.1 37.8
3.5
3.1
16.5 14.5
35.0 30.3
2.1
2.0
13.8 11.9
18.4 13.5
15.1 13.6
4.4
4.4
4.5
2.9
6.5
4.0
3.3
5.4
2.9
1.7
3.1
2.1
15.2
3.2
2.3
2.7
2.8
6.4
3.3
1.7
3.7
5.5
3.7
ROE (%)
FY18 FY19E
16.0 17.3
34.2 35.8
40.3 48.5
41.0 43.6
13.0 13.2
27.3 26.2
46.3 50.8
4.9
8.5
15.8 17.2
19.6 19.6
26.4 27.7
19.6
15.1
26.0
23.8
7.2
22.1
11.5
15.5
8.6
-2.3
15.6
12.2
16.2
9.3
18.9
11.9
15.6
16.1
10.3
3.9
8.7
20.3
12.6
19.3
17.0
20.4
20.1
11.3
19.5
11.7
18.6
12.5
1.6
14.0
12.7
27.5
12.7
21.6
14.0
9.4
17.2
14.5
4.4
11.2
16.2
13.2
EPS Gr. YoY (%)
P/E (x)
FY18 FY19E FY20E FY18 FY19E
-12.4 14.9 24.5 41.5 36.1
-2.8 17.6 18.2 58.4 49.7
13.2 29.2
9.3
81.0 62.6
30.3 32.5 28.5 114.9 86.7
187.1 15.8 24.3 29.0 25.1
13.2 4.0
19.3 61.3 58.9
-13.4 35.9 19.0 87.1 64.1
-2.0 83.8 52.1 43.7 23.8
71.7 25.7 26.3 93.1 74.1
26.1 36.4 43.1 93.9 68.8
10.5 16.4 18.5 57.0 48.9
12.5
33.2
26.2
11.9
96.5
8.9
29.8
21.5
21.4
234.2
20.0
28.0
13.2
34.6
16.4
47.7
54.5
14.8
26.8
92.0
39.3
35.0
29.6
231.2
-1.2
22.3
11.3
540
2475
1560
750
625
440
620
1270
2170
171
550
130
2888
850
1020
552
950
6590
620
481
700
1430
-9
22
27
9
3
11
-6
-2
-11
14
-16
13
-15
13
39
26
5
7
21
0
13
-20
21.9
58.9
53.0
42.7
6.2
17.5
20.3
33.0
64.7
-2.3
28.5
5.7
39.3
19.0
45.6
15.8
46.8
141.7
12.8
11.3
13.5
53.7
25.0 28.2 2.5 14.3
74.0 98.6 -21.1 25.7
51.5 65.0 -7.5 -2.7
44.2 49.5 8.7
3.5
10.6 20.9 -39.2 71.1
18.0 19.6 20.6 2.5
23.2 30.2 31.2 14.3
43.3 52.6 -17.3 31.0
99.3 120.6 -10.9 53.6
1.4
4.8
PL
LP
29.7 35.6 -27.5 4.1
6.8
8.7 -21.8 20.2
61.3 69.4 14.4 56.0
28.4 38.3 18.1 49.8
63.0 73.3 23.3 38.2
21.1 31.2 -10.9 33.1
29.2 45.1 -17.4 -37.6
166.8 191.6 9.8 17.7
21.2 26.9 -0.7 65.4
12.2 23.4 -65.1 8.4
18.4 25.6 -48.5 36.7
48.1 65.0 -2.6 -10.4
-18.2 15.9
0.8
23.8
13.7
16.0
2.6
23.5
16.8
17.8
Loss
17.5
61.8
17.5
LP
-0.5
-29.1
24.7
27.2 23.8 5.1
34.5 27.4 5.0
23.2 23.9 5.3
16.1 15.6 3.5
98.0 57.2 7.0
22.6 22.1 4.6
32.4 28.4 3.7
39.3 30.0 5.8
37.8 24.6 3.2
NM 104.7 1.7
22.9 22.0 3.6
20.3 16.8 2.2
86.1 55.2 13.9
39.6 26.4 3.5
16.1 11.6 2.8
27.6 20.8 3.1
19.4 31.1 3.0
43.6 37.0 7.0
40.0 24.2 3.9
42.8 39.4 1.8
46.2 33.8 3.9
33.2 37.0 6.5
32.8 28.3 4.1
NM
8.2
12.0
20.6
15.2
178.5 12.6
8.2
1.1
17.0
16.5
13.9
14.2
25.0
23.4
2.8
2.4
2.0
1.5
3.4
3.0
2.0
2.4
3.8
1.8
0.9
0.5
1.8
195
225
315
385
38
15
35
46
-4.2
23.9
19.4
12.9
11.7 -30.2 6.8
1.0 14.6 12.9
2.4
2.1
1.7
1.4
3.1
2.8
1.9
2.5
3.5
2.0
0.8
0.5
1.8
26.5
12.5
12.8
9.5
9.1
8.9
-2.1
18.4
3.7
-8.7
14.0
12.6
14.3
15.5
13.8
12.5
10.0
12.9
12.0
4.9
17.0
6.9
-8.2
13.2
7.5
17.5
146
769
22
19
7.3
17.1
8.4
25.8
10.5
30.9
-23.1
13.4
4.7
16.3
51.2
45.1
24.3
19.7
20.4
16.5
37.8
34.0
100
300
851
47
237
59
156
39
21
22
166
47
9
29
-0.4
17.6
6.8
-0.9
23.9
13.0
9.6
1.8
18.4
13.2
-0.8
25.5
8.5
11.9
5.5
23.1
21.6
-0.6
28.0
9.9
14.9
PL
LP
-13.8 4.3
-40.5 93.7
Loss Loss
-7.5
6.9
75.6 -34.5
-9.5 23.8
201.8 NM 39.4
25.7 14.1 13.5
64.4 102.6 52.9
Loss
NM
NM
9.5
6.8
6.3
16.6
4.2
6.4
24.7 12.6 10.1
28 August 2018
26
 Motilal Oswal Financial Services
Click excel icon
for detailed
valuation guide
CMP
TP % Upside
(INR) (INR) Downside
337
455
35
1322 1565
18
771 1050
36
510
680
33
EPS (INR)
FY18 FY19E FY20E
9.1 13.0 17.1
26.7 34.3 44.8
27.7 36.5 41.9
14.6 16.1 19.5
Valuation snapshot
ROE (%)
FY18 FY19E
9.0 11.9
12.2 13.9
25.2 29.6
19.6 19.0
12.1 14.2
12.8
26.7
-2.7
22.2
9.1
17.7
0.3
22.9
12.2
17.8
11.5
19.4
29.0
11.8
16.7
14.0
31.0
21.0
20.8
24.3
21.2
9.4
13.0
23.3
13.0
14.9
20.3
24.0
21.8
18.3
25.0
26.9
24.1
15.4
18.8
14.6
16.2
16.7
37.6
29.4
21.5
17.0
15.3
24.1
2.4
14.2
24.2
0.6
25.5
14.8
17.1
9.5
24.5
12.2
16.5
13.5
20.7
24.4
14.2
22.3
13.0
27.8
14.5
21.0
22.5
15.0
13.7
16.9
24.6
14.3
15.3
24.2
28.2
27.4
16.7
25.3
26.4
25.0
16.1
25.7
20.9
19.5
18.3
35.8
34.9
19.3
15.7
18.1
25.0
-0.5
Company
Music Broadcast
PVR
Sun TV
Zee Ent.
Aggregate
Metals
Hindalco
Hind. Zinc
JSPL
JSW Steel
Nalco
NMDC
SAIL
Rain Industries
Vedanta
Tata Steel
Aggregate
Oil & Gas
Aegis Logistics
BPCL
GAIL
Gujarat Gas
Gujarat St. Pet.
HPCL
IOC
IGL
Mahanagar Gas
MRPL
Oil India
ONGC
PLNG
Reliance Ind.
Aggregate
Retail
Jubilant Food
Titan Co.
Aggregate
Technology
Cyient
HCL Tech.
Hexaware
Infosys
KPIT Tech
Mindtree
Mphasis
NIIT Tech
Persistent Sys
Tata Elxsi
TCS
Tech Mah
Wipro
Zensar Tech
Aggregate
Telecom
Bharti Airtel
Reco
Buy
Buy
Buy
Buy
EPS Gr. YoY (%)
P/E (x)
P/B (x)
FY18 FY19E FY20E FY18 FY19E FY18 FY19E
41.1 43.5 31.6 37.1 25.9 3.2
3.0
29.9 28.6 30.5 49.6 38.5 5.7
5.0
11.6 31.5 14.9 27.8 21.1 6.5
6.0
-7.0 10.6 21.3 35.0 31.7 6.5
5.6
0.1 26.3 33.9 31.6 25.0 3.8
3.6
1.4
3.5
0.7
3.1
1.3
1.4
0.9
1.7
1.3
1.2
1.5
6.4
1.9
2.1
5.8
2.1
1.6
1.3
5.7
4.0
1.3
0.9
1.1
3.6
2.6
1.9
21.1
15.6
16.6
3.5
3.9
6.5
4.9
3.2
6.3
4.5
4.6
3.3
12.3
9.0
3.5
2.8
4.3
5.7
2.2
1.3
3.1
0.7
2.4
1.1
1.3
0.8
1.4
1.2
1.1
1.3
5.5
1.7
1.9
4.8
1.8
1.3
1.2
4.8
3.5
1.2
0.8
1.0
3.1
2.2
1.7
17.1
15.5
16.0
3.1
3.4
5.4
4.8
2.7
5.4
5.1
4.2
3.2
9.6
8.7
3.0
2.4
3.7
5.4
2.2
Buy
Neutral
Buy
Buy
Buy
Buy
Neutral
Buy
Buy
Neutral
231
300
207
356
74
108
77
204
225
581
331
295
327
385
108
178
82
241
269
632
44
-2
58
8
46
65
6
18
19
9
18.9
21.1
-8.5
23.4
5.0
13.1
0.3
23.7
20.4
71.9
24.4
22.2
1.9
33.4
9.1
13.7
8.9
32.4
21.6
85.1
27.8 120.5 29.4 13.6 12.2 9.4
26.3 7.2
5.0
18.6 14.2 13.6
3.8 Loss
LP
101.2 NM 109.0
30.1 56.9 42.8
-9.8
15.2 10.6
8.2 35.3 80.7 -10.4 14.7 8.2
14.6 31.5 4.7
6.1
8.2
7.9
6.8
LP 3,359 -23.8 300.8 8.7
34.2 238.1 36.4
5.7
8.6
6.3
27.0 34.6 6.2
24.9 11.1 10.4
68.7 76.5 18.4 -19.3
8.1
6.8
73.3 31.2
2.2
12.7 9.7
11.0
48.9
32.5
40.7
12.2
51.8
18.8
12.8
54.8
11.9
35.1
31.5
19.3
94.9
64.5 36.9
3.0
-2.3
20.5 30.6
32.0 55.4
34.6 4.0
-12.4 6.7
11.0 -24.9
9.2 22.1
21.5 5.5
-13.6 -21.6
-1.2 49.3
-9.9 40.1
21.8 24.5
20.7 25.7
5.5 15.1
35.9
0.5
21.9
23.8
-1.0
2.4
4.7
11.5
7.3
19.0
5.8
11.3
11.9
23.9
13.9
24.8
26.5
26.2
18.2
13.1
17.3
18.0
18.0
39.0
9.5
18.4
28.0
16.8
14.1
21.6
14.2
34.0
14.7
LP
39.2
7.3
18.9
36.6
15.6
5.5
6.5
30.2
17.4
6.6
9.5
8.7
16.9
21.2
12.5
28.6
7.4
14.5
23.6
15.0
5.2
8.7
24.8
16.5
8.4
6.4
6.2
13.6
16.9
10.9
Buy
Buy
Neutral
Buy
Neutral
Buy
Buy
Buy
Buy
Neutral
Buy
Buy
Buy
Buy
232
361
385
775
185
262
156
285
841
84
211
176
234
1292
311
535
361
990
196
428
254
383
1097
88
296
219
312
1301
34
48
-6
28
6
63
63
34
30
4
40
24
33
1
5.9
49.8
20.4
21.2
11.9
47.4
23.9
9.4
48.4
12.8
22.2
20.2
13.9
60.9
8.1
48.6
26.6
32.9
12.3
50.6
17.9
11.5
51.1
10.0
33.1
28.3
17.2
76.6
Neutral
Buy
1550
893
1320
1130
-15
27
14.9
12.6
22.0
16.2
27.5 180.6 48.2
20.5 39.9 28.4
51.2 31.3
45.9
81.5
22.4
85.8
18.2
64.4
63.2
70.2
58.9
55.4
93.5
52.6
21.5
95.0
24.8
4.5
21.2
3.1
6.1
38.0
13.2
19.8
7.2
37.7
-1.0
33.6
7.7
1.3
5.0
-63.3
1.4
15.2
15.1
12.3
21.3
34.8
31.1
30.1
13.9
22.3
24.1
1.3
5.2
34.4
10.0
PL
104.2 70.4
70.7 55.1
76.5 58.2
19.0
16.6
25.7
21.9
22.9
30.5
28.8
29.4
21.0
36.8
31.1
17.3
16.6
29.8
23.6
92.8
18.8
14.4
22.3
19.5
18.9
22.6
21.9
22.6
18.4
30.1
25.0
17.1
15.8
22.2
21.4
NM
Neutral
Neutral
Sell
Buy
Neutral
Buy
Neutral
Neutral
Buy
Buy
Neutral
Buy
Neutral
Buy
728
1038
427
1415
291
1049
1266
1341
848
1426
2052
738
297
1571
780
1100
380
1600
320
1225
1100
1100
950
1700
1950
800
300
1500
7
6
-11
13
10
17
-13
-18
12
19
-5
8
1
-5
38.2
62.6
16.6
64.8
12.7
34.4
44.0
45.6
40.4
38.7
66.0
42.7
17.9
52.8
38.8
72.0
19.1
72.7
15.4
46.3
57.7
59.3
46.0
47.4
81.9
43.3
18.8
70.9
Buy
378
470
24
4.1
-0.8
1.2
28 August 2018
27
 Motilal Oswal Financial Services
Click excel icon
for detailed
valuation guide
CMP
TP % Upside
(INR) (INR) Downside
288
305
6
52
70
36
552
670
21
EPS (INR)
FY18 FY19E FY20E
13.6 13.5 13.8
-9.6 -15.2 -13.3
3.5
0.7
13.8
Valuation snapshot
P/E (x)
P/B (x)
FY18 FY19E FY18 FY19E
21.1 21.4 3.1
3.2
NM
NM
0.8
1.0
159.3 742.7 31.5 30.2
2,850 -53
2.1
2.2
15.3
13.2
22.6
10.3
12.6
12.0
14.2
13.1
31.8
11.2
10.4
19.5
9.3
10.8
10.6
12.2
10.8
27.6
9.4
1.2
1.0
0.9
1.3
1.8
1.3
2.0
2.8
21.2
1.3
15.5
4.0
4.1
5.7
1.6
9.1
4.2
3.1
4.1
2.8
3.2
5.0
5.5
2.3
3.2
3.9
1.7
10.1
1.1
3.6
8.7
1.1
1.0
0.8
1.2
1.6
1.2
1.9
2.6
17.3
1.1
14.6
3.5
4.0
5.5
1.4
8.3
3.8
3.0
3.6
2.1
2.6
4.4
4.8
2.2
2.9
3.6
1.6
8.2
1.0
3.0
ROE (%)
FY18 FY19E
15.6 14.9
-16.0 -26.5
9.4
4.2
0.1 -4.1
36.5
9.2
4.6
8.5
10.8
16.3
10.7
15.3
8.9
18.9
7.6
69.1
22.1
11.9
41.3
14.0
13.4
20.9
7.9
17.4
7.8
9.6
18.8
20.7
7.5
13.7
12.3
24.9
17.6
9.2
26.9
77.8
10.9
5.1
9.1
11.7
16.3
10.2
17.3
9.6
20.1
6.3
58.3
20.4
10.8
22.4
14.3
14.1
22.2
8.4
22.9
12.6
8.7
12.4
20.4
5.8
15.8
12.3
11.0
20.4
11.5
23.4
Company
Bharti Infratel
Idea Cellular
Tata Comm
Aggregate
Utiltites
Coal India
CESC
JSW Energy
NHPC
NTPC
Power Grid
Tata Power
Aggregate
Others
Arvind
Avenue
Supermarts
BSE
Castrol India
Coromandel Intl
Delta Corp
Interglobe
Indo Count
Info Edge
Kaveri Seed
MCX
Navneet
Education
Oberoi Realty
Phoenix Mills
Quess Corp
PI Inds.
Piramal Enterp.
SRF
S H Kelkar
Tata Chemicals
Team Lease Serv.
Trident
UPL
Reco
Neutral
Buy
Buy
EPS Gr. YoY (%)
FY18 FY19E FY20E
-8.1 -1.2
2.4
Loss Loss
Loss
-67.2 -78.5 1,752.3
-98.8 PL
Loss
28.3
45.5
-21.2
-17.3
6.8
16.1
3.5
13.4
0.1
68.4
36.6
27.4
15.5
11.4
16.0
12.5
16.0
22.0
15.4
29.3
16.7
9.6
36.5
11.3
6.4
10.7
26.9
12.1
36.5
33.7
25.9
0.7
19.1
36.3
52.7
13.8
23.9
22.3
46.7
12.8
46.3
42.4
52.1
20.6
69.2
27.5
34.6
18.5
56.9
16.5
8.3
Buy
Buy
Neutral
Buy
Buy
Buy
Neutral
293
1000
68
25
166
198
76
345
1292
75
34
194
253
75
18
29
10
35
17
28
-1
19.2
75.5
3.0
2.4
13.2
16.5
5.3
26.2
96.2
3.5
2.7
15.3
18.6
6.2
30.6
105.4
4.8
3.0
16.3
20.6
7.9
Neutral
Sell
Buy
Buy
Buy
Buy
Neutral
Neutral
Buy
Buy
Buy
Buy
Buy
Buy
Neutral
Buy
Buy
Buy
Buy
Buy
Buy
Buy
Buy
405
1585
750
159
423
260
1048
77
1576
640
842
131
469
596
1086
772
3062
1972
230
747
2686
63
659
454
1117
950
218
557
301
903
93
1550
741
1000
160
616
757
1100
889
3125
2225
257
957
3500
82
749
12
-30
27
37
32
16
-14
21
-2
16
19
22
31
27
1
15
2
13
12
28
30
30
14
12.7
12.9
43.5
7.0
22.7
5.8
58.3
6.4
22.5
32.0
21.2
5.4
14.7
16.7
44.3
6.2
23.4
6.9
42.1
7.4
25.7
35.7
23.0
7.9
20.0
22.3
55.8
6.2
27.9
9.4
64.3
8.4
31.8
43.6
33.7
8.9
122.7 94.9
17.3
22.8
18.6
45.0
18.0
12.1
70.2
20.0
39.7
24.2
37.1
37.7
49.8
29.0
39.4
24.5
32.4
15.5
62.4
11.9
14.9
16.9
25.7
18.1
37.9
24.9
10.4
61.3
17.9
36.6
16.6
19.1
32.5
47.3
25.1
38.9
19.2
30.1
15.0
44.5
9.0
14.1
6.0
1.9
2.9 -11.4
38.8 3.1
89.4 18.8
35.1 -27.8
-45.7 15.8
31.3 14.5
67.8 11.5
-14.6 8.4
-26.1
45.7
94.1
15.8
5.3
15.3
1.1
27.6
7.8
3.0
40.3
32.9
5.7
12.6 24.5 35.8 21.2
15.8 18.3 26.1 44.2
21.8 23.0 35.0 115.7
26.7 30.7 37.1 -20.2
77.8 78.6 133.1 7.2
80.4 102.6 130.9 -10.3
7.1
7.6
10.3 -2.2
48.2 49.7 58.8 39.7
43.0 60.4 94.8 28.0
5.3
7.0
8.2 -21.8
44.2 46.7 50.6 5.9
28 August 2018
28
 Motilal Oswal Financial Services
MOSL Universe stock performance
Company
Automobiles
Amara Raja
Ashok Ley.
Bajaj Auto
Bharat Forge
Bosch
CEAT
Eicher Mot.
Endurance Tech.
Escorts
Exide Ind
Hero Moto
M&M
Maruti Suzuki
Motherson Sumi
Tata Motors
TVS Motor
Banks - Private
AU Small Fin. Bank
Axis Bank
DCB Bank
Equitas Hold.
Federal Bank
HDFC Bank
ICICI Bank
IndusInd
Kotak Mah. Bk
RBL Bank
South Indian
Yes Bank
Banks - PSU
BOB
BOI
Canara
Indian Bk
PNB
SBI
Union Bk
NBFCs
Aditya Birla Cap
Bajaj Fin.
Capital First
Cholaman.Inv.&Fn
GRUH Fin.
HDFC
HDFC Stand. Life
Indiabulls Hsg
L&T Fin.Holdings
LIC Hsg Fin
M&M Fin.
Muthoot Fin
MAS Financial Serv.
ICICI Pru Life
PNB Housing
Repco Home
1 Day (%)
1.3
2.7
0.9
0.6
-0.3
1.1
0.4
-0.1
-0.3
-0.3
0.4
0.9
0.9
1.2
1.3
2.8
3.2
1.6
1.8
0.7
-2.1
0.4
3.0
1.1
1.6
4.1
0.3
2.3
1.8
1.9
3.1
0.4
-0.4
2.6
3.9
-0.5
1.4
1.1
-0.2
3.1
0.3
-0.3
1.2
0.1
-7.7
1.4
0.9
6.1
2.5
2.4
-3.0
1M (%)
10.6
17.7
0.9
3.1
0.6
1.5
-0.2
14.8
-3.5
6.9
0.9
7.5
-0.7
-4.1
-3.3
7.1
13.6
17.4
4.2
4.3
-11.8
-5.6
15.9
-1.4
-2.8
11.4
-2.8
3.6
8.7
-3.2
2.0
-6.8
4.1
7.6
5.5
-2.6
9.0
20.0
-0.5
1.9
-5.9
-9.3
-2.6
2.1
-1.6
-9.1
-0.9
4.4
-6.6
4.8
-9.8
12M (%)
12.5
29.1
-1.2
13.3
-13.5
-14.4
-6.2
60.6
45.0
44.4
-16.8
42.1
21.7
-1.8
-32.6
-5.0
35.5
28.6
-6.0
-7.9
-25.0
17.8
14.1
16.5
30.9
24.6
-36.7
11.3
5.0
-34.2
-16.5
11.5
-40.7
9.9
-34.1
Company
Shriram City Union
Shriram Trans.
Capital Goods
ABB
Bharat Elec.
BHEL
Blue Star
CG Cons. Elec.
CG Power & Inds Sol.
Cummins
Engineers India
GE T&D
Havells
K E C Intl
L&T
Siemens
Solar Ind
Thermax
Va Tech Wab.
Voltas
Cement
Ambuja Cem.
ACC
Birla Corp.
Dalmia Bharat
Grasim Inds.
India Cem
JK Lakshmi Ce
Ramco Cem
Orient Cem
Prism Johnson
Sagar Cements
Sanghi Inds.
Shree Cem
Ultratech
Consumer
Asian Paints
Britannia
Colgate
Dabur
Emami
Future Consumer
Godrej Cons.
GSK Cons.
HUL
ITC
Jyothy Lab
Marico
Nestle
Page Inds
Parag Milk
Pidilite Ind.
P&G Hygiene
Prabhat Dairy
United Brew
1 Day (%)
-0.1
4.3
0.3
-0.7
-0.4
0.0
-0.9
1.1
1.2
-0.5
1.5
3.0
-1.9
1.0
-0.6
1.4
2.0
-1.1
1.8
2.2
0.9
0.1
0.4
1.8
1.0
-2.5
-0.9
-1.4
1.8
-1.8
1.2
0.9
1.2
0.5
0.6
-1.0
1.2
-1.9
6.6
0.5
0.2
0.6
1.0
1.1
-0.3
-0.3
3.1
-0.2
0.7
-0.1
-0.1
-0.5
1M (%)
4.7
-4.0
11.6
14.1
12.2
0.1
7.3
-5.5
13.6
-6.8
0.4
15.5
-10.5
3.4
4.5
5.5
-11.0
7.2
8.8
7.4
7.9
1.5
1.8
5.3
1.8
-3.0
-6.7
-9.9
-3.9
-7.0
-11.3
8.4
6.0
-2.3
6.8
5.1
25.0
-3.0
0.9
7.3
17.1
8.1
3.7
-9.0
4.5
10.1
23.1
1.7
3.1
-4.8
0.3
24.3
12M (%)
-8.5
39.4
-2.1
-31.6
-5.9
-7.9
22.5
-25.0
-13.2
-18.8
-24.0
48.0
4.4
19.9
-18.5
37.7
15.0
-38.0
19.7
-12.2
-7.0
-17.7
4.5
-4.7
-31.7
-20.6
1.6
-23.4
2.6
-10.6
1.8
9.2
11.0
23.2
61.7
6.8
62.7
2.1
-0.5
53.4
42.5
52.0
11.3
8.5
19.5
71.9
107.6
25.6
40.2
24.4
15.0
71.7
67.6
-10.6
27.1
29.0
9.6
5.9
3.3
-19.9
15.1
-7.6
-8.8
-9.1
-14.2
28 August 2018
29
 Motilal Oswal Financial Services
MOSL Universe stock performance
Company
United Spirits
Healthcare
Alembic Phar
Alkem Lab
Ajanta Pharma
Aurobindo
Biocon
Cadila
Cipla
Divis Lab
Dr Reddy’s
Fortis Health
Glenmark
Granules
GSK Pharma
IPCA Labs
Jubilant Life
Lupin
Laurus Labs
Sanofi India
Shilpa Medicare
Strides Shasun
Sun Pharma
Torrent Pharma
Infrastructure
Ashoka Buildcon
IRB Infra.Devl.
KNR Construct.
Sadbhav Engg.
Logistics
Allcargo Logistics
Concor
Media
Dish TV
D B Corp
Ent.Network
Hathway Cab.
Hind. Media
HT Media
Jagran Prak.
Music Broadcast
PVR
Sun TV
Zee Ent.
Metals
Hindalco
Hind. Zinc
JSPL
JSW Steel
Nalco
NMDC
Rain Industries
SAIL
Vedanta
Tata Steel
1 Day (%)
0.2
0.5
-1.1
0.0
-0.6
0.2
-0.3
1.3
-0.4
-0.2
0.1
-1.1
1.1
0.4
-2.0
2.3
0.1
-0.6
1.3
3.1
0.1
-1.2
0.6
2.1
2.8
0.5
-0.6
-0.6
0.9
-1.3
-1.1
-0.4
-1.4
-1.6
-0.6
-2.1
0.2
0.3
0.1
0.3
3.7
2.3
2.4
0.3
3.0
4.0
-3.3
2.6
0.7
1.0
1M (%)
6.3
5.0
-3.9
12.7
16.6
3.6
6.3
4.0
17.9
17.3
9.2
13.9
13.1
6.7
0.1
-7.8
11.3
-2.6
6.0
34.9
33.9
11.6
20.1
-4.9
-3.2
-0.6
-4.1
1.7
-0.4
6.7
-1.2
-2.3
8.0
-11.1
-1.1
-5.1
9.4
18.7
-0.6
-1.6
7.9
9.6
1.9
10.1
18.8
3.6
1.8
2.7
2.6
5.8
12M (%)
23.3
16.9
13.9
-0.1
-5.9
79.8
-19.9
15.0
92.8
17.0
-1.5
5.8
-11.8
41.9
81.3
0.9
-8.5
-16.1
54.1
-9.0
-47.0
28.7
45.2
14.6
-7.7
6.9
-1.0
-27.1
1.8
-9.9
-33.5
-17.4
-45.6
-41.0
-41.0
-30.6
-10.3
4.5
8.1
-0.5
-0.8
5.6
53.2
44.6
6.6
-11.9
40.4
27.2
-24.5
-3.5
Company
Oil & Gas
Aegis Logistics
BPCL
GAIL
Gujarat Gas
Gujarat St. Pet.
HPCL
IOC
IGL
Mahanagar Gas
MRPL
Oil India
ONGC
PLNG
Reliance Ind.
Retail
Jubilant Food
Titan Co.
Technology
Cyient
HCL Tech.
Hexaware
Infosys
KPIT Tech
Mindtree
Mphasis
NIIT Tech
Persistent Sys
Tata Elxsi
TCS
Tech Mah
Wipro
Zensar Tech
Telecom
Bharti Airtel
Bharti Infratel
Idea Cellular
Tata Comm
Utiltites
Coal India
CESC
JSW Energy
NHPC Ltd
NTPC
Power Grid
Tata Power
Others
Arvind
Avenue Super.
BSE
Castrol India
Coromandel Intl
Delta Corp
Interglobe
Indo Count
1 Day (%)
0.1
1.0
1.3
-0.1
-1.2
1.2
1.2
2.4
-0.3
2.4
1.8
0.7
0.9
1.1
1.8
0.6
0.9
1.5
-1.1
2.5
0.2
3.5
1.0
0.1
-1.8
0.4
0.5
2.7
1.4
-1.6
2.7
0.7
-1.2
1.6
0.8
1.6
-0.4
-0.4
1.1
3.6
5.5
-0.6
1.8
0.3
0.8
0.5
2.1
-0.9
0.0
1M (%)
-1.9
-9.1
1.9
0.7
-5.7
-7.9
-5.5
-3.3
-5.5
4.3
0.0
9.2
1.1
14.3
9.6
1.0
2.6
7.7
-6.7
2.9
-2.5
11.8
12.9
7.0
1.6
-1.7
5.6
14.4
8.0
27.6
3.8
-0.4
-8.6
-2.8
11.7
5.3
1.9
5.0
7.4
10.1
5.3
-5.0
1.1
-6.7
-8.2
5.5
9.4
4.2
-5.0
12M (%)
24.6
-28.9
34.0
-1.8
-4.0
-43.8
-27.1
13.9
-17.7
-32.6
11.8
10.6
3.6
64.8
122.9
47.0
37.0
19.7
55.4
56.3
153.8
125.4
109.4
170.0
37.7
74.5
64.4
72.4
2.4
100.8
-12.6
-25.0
-42.8
-14.0
21.3
4.5
6.9
-15.0
-1.8
-10.1
-4.5
11.4
59.4
-24.9
-18.4
-1.4
43.0
-11.7
-29.7
28 August 2018
30
 Motilal Oswal Financial Services
MOSL Universe stock performance
Company
Info Edge
Kaveri Seed
MCX
Navneet Educat.
Oberoi Realty
Phoenix Mills
PI Inds.
Piramal Enterp.
Quess Corp
SRF
S H Kelkar
Tata Chemicals
Team Lease Serv.
Trident
UPL
1 Day (%)
0.2
0.4
1.1
1.7
0.1
-2.4
0.2
6.2
1.1
0.0
0.5
2.4
2.2
-0.3
0.8
1M (%)
12.3
5.4
1.6
17.9
-2.6
-5.1
-4.5
15.1
1.6
17.2
15.6
10.0
0.8
13.9
3.7
12M (%)
68.6
18.2
-17.6
-16.4
27.7
15.7
6.0
15.4
31.9
36.0
-7.0
28.9
80.6
-27.2
-20.9
28 August 2018
31
 Motilal Oswal Financial Services
NOTES
28 August 2018
32
 Motilal Oswal Financial Services
THEMATIC/STRATEGY RESEARCH GALLERY
 Motilal Oswal Financial Services
REPORT GALLERY
RECENT INITIATING COVERAGE REPORTS
.
Rs
 Motilal Oswal Financial Services
DIFFERENTIATED PRODUCT GALLERY
 Motilal Oswal Financial Services
Explanation of Investment Rating
Investment Rating
BUY
SELL
NEUTRAL
UNDER REVIEW
NOT RATED
Expected return (over 12-month)
>=15%
< - 10%
> - 10 % to 15%
Rating may undergo a change
We have forward looking estimates for the stock but we refrain from assigning recommendation
*In case the recommendation given by the Research Analyst becomes inconsistent with the investment rating legend, the Research Analyst shall within 28 days of the inconsistency, take appropriate measures to make the recommendation consistent with the investment rating legend.
Disclosures:
The following Disclosures are being made in compliance with the SEBI Research Analyst Regulations 2014 (herein after referred to as the Regulations).
Motilal Oswal Securities Ltd. (MOSL*
)
is a SEBI Registered Research Analyst having registration no. INH000000412. MOSL, the Research Entity (RE) as defined in the Regulations, is engaged in the business of providing Stock broking services,
Investment Advisory Services, Depository participant services & distribution of various financial products. MOSL is a subsidiary company of Motilal Oswal Financial Service Ltd. (MOFSL). MOFSL is a listed public company, the details in respect of
which are available on
www.motilaloswal.com.
MOSL is registered with the Securities & Exchange Board of India (SEBI) and is a registered Trading Member with National Stock Exchange of India Ltd. (NSE) and BSE Limited (BSE), Multi
Commodity Exchange of India (MCX) & National Commodity & Derivatives Exchange Ltd. (NCDEX) for its stock broking activities & is Depository participant with Central Depository Services Limited (CDSL) & National Securities Depository Limited
(NSDL) and is member of Association of Mutual Funds of India (AMFI) for distribution of financial products. Details of associate entities of Motilal Oswal Securities Limited are available on the website at
http://onlinereports.motilaloswal.com/Dormant/documents/Associate%20Details.pdf
MOSL, it’s associates, Research Analyst or their relative may have any financial interest in the subject company. MOSL and/or its associates and/or Research Analyst may have actual/beneficial ownership of 1% or more securities in the subject
company at the end of the month immediately preceding the date of publication of the Research Report.
MOSL and its associate company(ies), their directors and Research Analyst and their relatives may; (a) from time to time, have a long or short
position in, act as principal in, and buy or sell the securities or derivatives thereof of companies mentioned herein. (b) be engaged in any other transaction involving such securities and earn brokerage or other compensation or act as a market maker
in the financial instruments of the company(ies) discussed herein or act as an advisor or lender/borrower to such company(ies) or may have any other potential conflict of interests with respect to any recommendation and other related information and
opinions.; however the same shall have no bearing whatsoever on the specific recommendations made by the analyst(s), as the recommendations made by the analyst(s) are completely independent of the views of the associates of MOSL even
though there might exist an inherent conflict of interest in some of the stocks mentioned in the research report.
Research Analyst may have served as director/officer, etc. in the subject company in the last 12 month period. MOSL and/or its
associates may have received any compensation from the subject company in the past 12 months.
In the last 12 months period ending on the last day of the month immediately preceding the date of publication of this research report, MOSL or any of its associates may have:
a)
managed or co-managed public offering of securities from subject company of this research report,
b)
received compensation for investment banking or merchant banking or brokerage services from subject company of this research report,
c)
received compensation for products or services other than investment banking or merchant banking or brokerage services from the subject company of this research report.
d)
Subject Company may have been a client of MOSL or its associates during twelve months preceding the date of distribution of the research report.
MOSL and it’s associates have not received any compensation or other benefits from the subject company or third party in connection with the research report. To enhance transparency, MOSL has incorporated a Disclosure of Interest Statement in
this document. This should, however, not be treated as endorsement of the views expressed in the report. MOSL and / or its affiliates do and seek to do business including investment banking with companies covered in its research reports. As a
result, the recipients of this report should be aware that MOSL may have a potential conflict of interest that may affect the objectivity of this report. Compensation of Research Analysts is not based on any specific merchant banking, investment
banking or brokerage service transactions.
Terms & Conditions:
This report has been prepared by MOSL and is meant for sole use by the recipient and not for circulation. The report and information contained herein is strictly confidential and may not be altered in any way, transmitted to, copied or distributed, in
part or in whole, to any other person or to the media or reproduced in any form, without prior written consent of MOSL. The report is based on the facts, figures and information that are considered true, correct, reliable and accurate. The intent of this
report is not recommendatory in nature. The information is obtained from publicly available media or other sources believed to be reliable. Such information has not been independently verified and no guaranty, representation of warranty, express or
implied, is made as to its accuracy, completeness or correctness. All such information and opinions are subject to change without notice. The report is prepared solely for informational purpose and does not constitute an offer document or solicitation
of offer to buy or sell or subscribe for securities or other financial instruments for the clients. Though disseminated to all the customers simultaneously, not all customers may receive this report at the same time. MOSL will not treat recipients as
customers by virtue of their receiving this report.
Analyst Certification
The views expressed in this research report accurately reflect the personal views of the analyst(s) about the subject securities or issues, and no part of the compensation of the research analyst(s) was, is, or will be directly or indirectly related to the
specific recommendations and views expressed by research analyst(s) in this report.
A graph of daily closing prices of securities is available at
www.nseindia.com, www.bseindia.com.
Research Analyst views on Subject Company may vary based on Fundamental research and Technical Research. Proprietary trading desk of MOSL or
its associates maintains arm’s length distance with Research Team as all the activities are segregated from MOSL research activity and therefore it can have an independent view with regards to subject company for which Research Team have
expressed their views.
Regional Disclosures (outside India)
This report is not directed or intended for distribution to or use by any person or entity resident in a state, country or any jurisdiction, where such distribution, publication, availability or use would be contrary to law, regulation or which would subject
MOSL & its group companies to registration or licensing requirements within such jurisdictions.
For Hong Kong:
This report is distributed in Hong Kong by Motilal Oswal capital Markets (Hong Kong) Private Limited, a licensed corporation (CE AYY-301) licensed and regulated by the Hong Kong Securities and Futures Commission (SFC) pursuant to the
Securities and Futures Ordinance (Chapter 571 of the Laws of Hong Kong) “SFO”. As per SEBI (Research Analyst Regulations) 2014 Motilal Oswal Securities (SEBI Reg No. INH000000412) has an agreement with Motilal Oswal capital Markets
(Hong Kong) Private Limited for distribution of research report in Hong Kong. This report is intended for distribution only to “Professional Investors” as defined in Part I of Schedule 1 to SFO. Any investment or investment activity to which this
document relates is only available to professional investor and will be engaged only with professional investors.” Nothing here is an offer or solicitation of these securities, products and services in any jurisdiction where their offer or sale is not
qualified or exempt from registration. The Indian Analyst(s) who compile this report is/are not located in Hong Kong & are not conducting Research Analysis in Hong Kong.
For U.S.
Motilal Oswal Securities Limited (MOSL) is not a registered broker - dealer under the U.S. Securities Exchange Act of 1934, as amended (the"1934 act") and under applicable state laws in the United States. In addition MOSL is not a registered
investment adviser under the U.S. Investment Advisers Act of 1940, as amended (the "Advisers Act" and together with the 1934 Act, the "Acts), and under applicable state laws in the United States. Accordingly, in the absence of specific exemption
under the Acts, any brokerage and investment services provided by MOSL, including the products and services described herein are not available to or intended for U.S. persons. This report is intended for distribution only to "Major Institutional
Investors" as defined by Rule 15a-6(b)(4) of the Exchange Act and interpretations thereof by SEC (henceforth referred to as "major institutional investors"). This document must not be acted on or relied on by persons who are not major institutional
investors. Any investment or investment activity to which this document relates is only available to major institutional investors and will be engaged in only with major institutional investors. In reliance on the exemption from registration provided by
Rule 15a-6 of the U.S. Securities Exchange Act of 1934, as amended (the "Exchange Act") and interpretations thereof by the U.S. Securities and Exchange Commission ("SEC") in order to conduct business with Institutional Investors based in the
U.S., MOSL has entered into a chaperoning agreement with a U.S. registered broker-dealer, Motilal Oswal Securities International Private Limited. ("MOSIPL"). Any business interaction pursuant to this report will have to be executed within the
provisions of this chaperoning agreement.
The Research Analysts contributing to the report may not be registered /qualified as research analyst with FINRA. Such research analyst may not be associated persons of the U.S. registered broker-dealer, MOSIPL, and therefore, may not be
subject to NASD rule 2711 and NYSE Rule 472 restrictions on communication with a subject company, public appearances and trading securities held by a research analyst account.
For Singapore
In Singapore, this report is being distributed by Motilal Oswal Capital Markets Singapore Pte Ltd (“MOCMSPL”) (Co.Reg. NO. 201129401Z) which is a holder of a capital markets services license and an exempt financial adviser in Singapore,
as per the approved agreement under Paragraph 9 of Third Schedule of Securities and Futures Act (CAP 289) and Paragraph 11 of First Schedule of Financial Advisors Act (CAP 110) provided to MOCMSPL by Monetary Authority of Singapore.
Persons in Singapore should contact MOCMSPL in respect of any matter arising from, or in connection with this report/publication/communication. This report is distributed solely to persons who qualify as “Institutional Investors”, of which some of
whom may consist of "accredited" institutional investors as defined in section 4A(1) of the Securities and Futures Act, Chapter 289 of Singapore (“the SFA”). Accordingly, if a Singapore person is not or ceases to be such an institutional investor, such
Singapore Person must immediately discontinue any use of this Report and inform MOCMSPL.
Disclaimer:
The report and information contained herein is strictly confidential and meant solely for the selected recipient and may not be altered in any way, transmitted to, copied or distributed, in part or in whole, to any other person or to the media or
reproduced in any form, without prior written consent. This report and information herein is solely for informational purpose and may not be used or considered as an offer document or solicitation of offer to buy or sell or subscribe for securities or
other financial instruments. Nothing in this report constitutes investment, legal, accounting and tax advice or a representation that any investment or strategy is suitable or appropriate to your specific circumstances. The securities discussed and
opinions expressed in this report may not be suitable for all investors, who must make their own investment decisions, based on their own investment objectives, financial positions and needs of specific recipient. This may not be taken in substitution
for the exercise of independent judgment by any recipient. Each recipient of this document should make such investigations as it deems necessary to arrive at an independent evaluation of an investment in the securities of companies referred to in
this document (including the merits and risks involved), and should consult its own advisors to determine the merits and risks of such an investment. The investment discussed or views expressed may not be suitable for all investors. Certain
transactions -including those involving futures, options, another derivative products as well as non-investment grade securities - involve substantial risk and are not suitable for all investors. No representation or warranty, express or implied, is made
as to the accuracy, completeness or fairness of the information and opinions contained in this document. The Disclosures of Interest Statement incorporated in this document is provided solely to enhance the transparency and should not be treated
as endorsement of the views expressed in the report. This information is subject to change without any prior notice. The Company reserves the right to make modifications and alternations to this statement as may be required from time to time
without any prior approval. MOSL, its associates, their directors and the employees may from time to time, effect or have effected an own account transaction in, or deal as principal or agent in or for the securities mentioned in this document. They
may perform or seek to perform investment banking or other services for, or solicit investment banking or other business from, any company referred to in this report. Each of these entities functions as a separate, distinct and independent of each
other. The recipient should take this into account before interpreting the document. This report has been prepared on the basis of information that is already available in publicly accessible media or developed through analysis of MOSL. The views
expressed are those of the analyst, and the Company may or may not subscribe to all the views expressed therein. This document is being supplied to you solely for your information and may not be reproduced, redistributed or passed on, directly or
indirectly, to any other person or published, copied, in whole or in part, for any purpose. This report is not directed or intended for distribution to, or use by, any person or entity who is a citizen or resident of or located in any locality, state, country or
other jurisdiction, where such distribution, publication, availability or use would be contrary to law, regulation or which would subject MOSL to any registration or licensing requirement within such jurisdiction. The securities described herein may or
may not be eligible for sale in all jurisdictions or to certain category of investors. Persons in whose possession this document may come are required to inform themselves of and to observe such restriction. Neither the Firm, not its directors,
employees, agents or representatives shall be liable for any damages whether direct or indirect, incidental, special or consequential including lost revenue or lost profits that may arise from or in connection with the use of the information.
The person
accessing this information specifically agrees to exempt MOSL or any of its affiliates or employees from, any and all responsibility/liability arising from such misuse and agrees not to hold MOSL or any of its affiliates or employees responsible for any
such misuse and further agrees to hold MOSL or any of its affiliates or employees free and harmless from all losses, costs, damages, expenses that may be suffered by the person accessing this information due to any errors and delays.
Registered Office Address: Motilal Oswal Tower, Rahimtullah Sayani Road, Opposite Parel ST Depot, Prabhadevi, Mumbai-400025; Tel No.: 022-3980 4263; www.motilaloswal.com. Correspondence Address: Palm Spring Centre, 2nd Floor, Palm
Court Complex, New Link Road, Malad (West), Mumbai- 400 064. Tel No: 022 3080 1000. Compliance Officer: Neeraj Agarwal, Email Id:
na@motilaloswal.com,
Contact No.:022-30801085.
Registration details of group entities: MOSL: SEBI Registration: INZ000158836 (BSE/NSE/MCX/NCDEX); CDSL: IN-DP-16-2015; NSDL: IN-DP-NSDL-152-2000; Research Analyst: INH000000412. AMFI: ARN 17397. Investment Adviser:
INA000007100. Motilal Oswal Asset Management Company Ltd. (MOAMC): PMS (Registration No.: INP000000670) offers PMS and Mutual Funds products. Motilal Oswal Wealth Management Ltd. (MOWML): PMS (Registration No.: INP000004409)
offers wealth management solutions. *Motilal Oswal Securities Ltd. is a distributor of Mutual Funds, PMS, Fixed Deposit, Bond, NCDs, Insurance and IPO products. * Motilal Oswal Commodities Broker Pvt. Ltd. offers Commodities Products. * Motilal
Oswal Real Estate Investment Advisors II Pvt. Ltd. offers Real Estate products. * Motilal Oswal Private Equity Investment Advisors Pvt. Ltd. offers Private Equity products
*MOSL
has been amalgamated with Motilal Oswal Financial Services Limited (MOFSL) w.e.f August 21, 2018 pursuant to order dated July 30, 2018 issued by Hon'ble National Company Law Tribunal, Mumbai Bench. The existing registration no(s) of
MOSL would be used until receipt of new MOFSL registration numbers.
Disclosure of Interest Statement
Analyst ownership of the stock
Companies where there is interest
No
28 August 2018
33