30 August 2018
Market snapshot
Equities - India
Sensex
Nifty-50
Nifty-M 100
Equities-Global
S&P 500
Nasdaq
FTSE 100
DAX
Hang Seng
Nikkei 225
Commodities
Brent (US$/Bbl)
Gold ($/OZ)
Cu (US$/MT)
Almn (US$/MT)
Currency
USD/INR
USD/EUR
USD/JPY
YIELD (%)
10 Yrs G-Sec
10 Yrs AAA Corp
Flows (USD b)
FIIs
DIIs
Volumes (INRb)
Cash
F&O
Close
38,723
11,692
19,827
Close
2,914
8,110
7,563
12,562
11,083
22,848
Close
77
1,207
6,073
2,147
Close
70.6
1.2
111.7
Close
7.9
8.7
29-Aug
-0.20
0.16
29-Aug
384
10,802
Chg .%
-0.4
-0.4
0.5
Chg .%
0.6
1.0
-0.7
0.3
-0.1
0.2
Chg .%
1.9
0.5
-1.0
1.7
Chg .%
0.7
-0.1
0.6
1MChg
0.28
0.00
MTD
0.0
0.8
MTD*
360
9,242
YTD.%
13.7
11.0
-6.2
YTD.%
9.0
17.5
-1.6
-2.8
-5.3
0.4
YTD.%
15.3
-7.4
-15.7
-4.8
YTD.%
10.5
-2.5
-0.8
YTDchg
0.6
0.8
YTD
-0.2
10.7
YTD*
357
8,441
Today’s top research theme
Yes Bank: India’s new-age private sector bank buiding size,
getting leaner
We hosted Mr. Rana Kapoor MD & CEO of Yes Bank. Key takeaways:
Key strategic enablers during large bank growth phase
– 1] Comprehensive
product suite 2] Solution driven knowledge banking approach 3) Leadership in
technology 4) Prudent risk management 5] Expansive reach 6] Experienced
leadership 7] Vibrant Yes Bank brand
CASA market share has more than doubled to 1.5% over FY16-18 while
incremental loan market share during FY18 stood at 9.2%
60% of the book is linked to MCLR of which 2/3rd of the book is linked to 1yr
MCLR. Margins are thus expected to recover from 3QFY19
Credit cost has been under control over past several years and banks expects
RoE to remain in 20%-22% range after FY20
Research covered
Cos/Sector
AGIC: CEO Track
Takeaways
Key Highlights
Yes Bank | AU Small Finance Bank |Dabur India | Pidilite Industries |
TeamLease
Automobiles | Capital Goods and Electricals | Cement | Consumer |
AGIC:
Financials – Bank | Life Insurance | NBFC | Healthcare | Metals | Oil
Management Says
& Gas | Technology | Telecom | Midcaps/Others
Piping hot news
The rupee slipped to a record low of 70.64 against the dollar on Wednesday in intra-
currency trades and staged only a limited recovery to end the session at 70.59. The Indian
currency has now lost nearly 10% since January making it Asia’s worst performing currency.
It was possible, dealers said,…
Rupee slips to record closing low of 70.59
Note: YTD is calendar year, *Avg
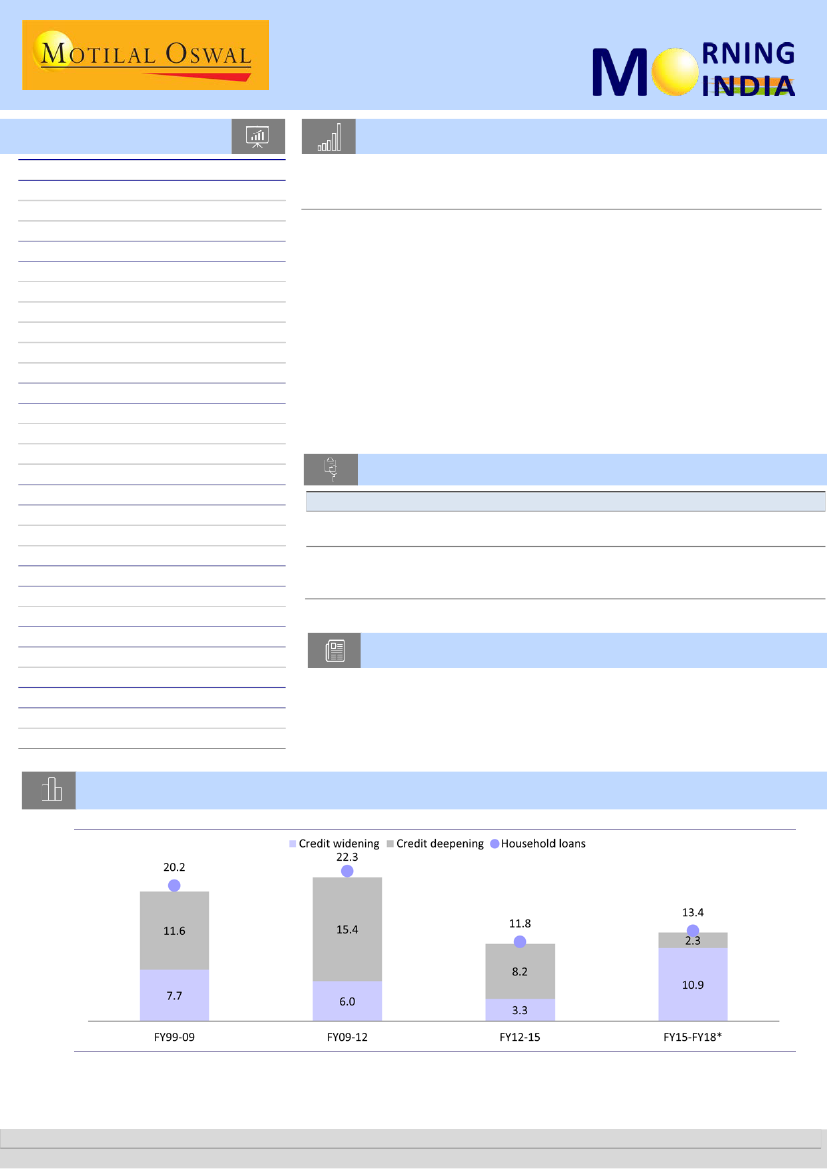
Chart of the Day: EcoKnowLedge – How sustainable is the leverage of Indian households?
Drivers of banks’ household loans during the past two decades
* Up to December 2017
Credit widening = No of accounts (volume); Credit deepening = Loan/account (Value)
Source: RBI, CSO, CEIC, MOSL
Research Team (Gautam.Duggad@MotilalOswal.com)
Motilal Oswal research is available on www.motilaloswal.com/Institutional-Equities, Bloomberg, Thomson Reuters, Factset and S&P Capital.
Investors are advised to refer through important disclosures made at the last page of the Research Report.
 Motilal Oswal Financial Services
In the news today
Kindly click on textbox for the detailed news link
1
The rupee slipped to a record low
of 70.64 against the dollar on
Wednesday in intra-currency
trades and staged only a limited
recovery to end the session at
70.59. The Indian currency has
now lost nearly 10% since January
making it Asia’s worst performing
currency…
2
Spencer's joins More & Future on Amazon's shopping list
Amazon is in early talks with Spencer's Retail to pick up a minority
stake in the food and grocery retail chain, according to two people
with knowledge of the matter, as the US online giant scours the
country for alliances to penetrate deeper into the market. The US
company is also in talks with the Aditya Birla Group on buying stakes
in its More chain of stores and is likely to partner with Samara Capital
and other investors to fully acquire the business…
Rupee slips to record closing
low of 70.59
3
RInfra sells Mumbai power
utility to Adani
Reliance Infrastructure Ltd’s
chairman Anil Ambani on
Wednesday completed the sale of
its Mumbai city power
distribution business to fellow
industrialist Gautam Adani for
₹18,800 crore. Though Reliance
Infra has sold one of its profitable
business ventures,…
4
Indian Oil earmarks Rs 22,000-
crore capex for FY19
Indian Oil Corporation (IOC) today
said it has lined up Rs 22,000-
crore capex plan for the current
fiscal year and will commission
the Ennore-Manali LNG pipeline
on schedule by the end of the
year. Sanjiv Singh, the chairman
of the nation's largest oil
marketing company,…
5
Aditya Birla, Varde to set up
$1 billion joint venture to buy
stressed assets
Varde Partners Inc. and Aditya
Birla Capital Ltd. are creating a
joint venture to invest as much as
$1 billion in distressed assets in
India, according to people
familiar with the transaction, who
asked not to be identified
because the information is
private. The US investment firm
and Indian financial services
provider, helmed by billionaire
Kumar Mangalam Birla, are
expected to deploy this sum over
three years, one of the people
said. The venture, which will
scout for deals of up to $100
million, may be announced as
early as this week, the person
said…
6
Fuel retailers set to expand
network after four-year gap
Indian Oil Corp Ltd (IOCL), Bharat
Petroleum Corp Ltd (BPCL) and
Hindustan Petroleum Corp Ltd
(HPCL) are set to expand their
fuel retail network after a gap of
nearly four years. The three
state-run companies have an
ambitious plan to open a
combined nearly 50,000 fuel
outlets over the next three years,
said officials at IOCL…
7
99.3% of demonetised
currency returned: RBI
Over 99% of the ₹ 500 and ₹ 1000
that were withdrawn from
circulation in November 2016
were returned, the Reserve Bank
of India (RBI) said in its annual
report, released on Wednesday.
According to the report, after
verification and reconciliation,
the total value of the ₹ 500 and
₹,1000 as on November 8, 2016,…
30 August 2018
2
 Motilal Oswal Financial Services
CEO Track
Yes Bank
Mr. Rana Kapoor
MD & CEO
India’s new-age private sector bank buiding size, getting leaner
We hosted Mr Rana Kapoor – MD & CEO of Yes Bank (YES) – as part of CEO Track at our
conference. Key takeaways:
YES aims to be India’s finest-quality large bank by 2025. It also targets to be among the
top five banks in the country.
Currently, YES is the fourth largest private sector bank in the country, with an asset
size of INR3t, incremental market share of 9.2% in FY18 (v/s 2.3% static market share),
a C/I ratio of 37.3% (third most profitable bank in the country), GNPA/NNPA of
1.31%/0.59%, 1,100+ branches, RoA>1.5% and RoE > 17% since 2010.
Key strategic enablers of growth: With (1) a comprehensive product suite, (2) a
solution-driven knowledge banking approach, (3) leadership in new-age technology,
(4) a prudent risk management framework, (5) expansive reach, (6) experienced
leadership and (7) a vibrant ‘Yes Bank’ brand, YES has all the necessary components of
growth in place.
The bank recorded a CASA CAGR of 51% over FY16-18; it has set a CASA mix target of
40% by FY20.
YES’ CASA market share more than doubled to 1.5% over FY16-18.
MSME forms 18.4% of total advances – implying healthy growth despite GST and
demon-related headwinds. Retail advances now form 14% of total advances (+400bp
YoY).
60% of the book is linked to MCLR, of which two thirds are linked to one-year MCLR.
Margin drivers: MCLR book re-pricing, momentum in CASA, stored value in SA rate,
apt position for a rising interest rate scenario, improving PSL compliance and reduced
cost of funds due to rating upgrade to AAA strengthen the bank’s margins profile.
Funding and liquidity profile: Total capital funds doubled in three years to INR470b. It
has healthy internal accruals with best-in-class RoE. Lending to better-rated
corporates is likely to result in lower capital consumption.
Increasing tenor of borrowings. Rising proportion of CASA, Retail TD, long-term
borrowing in the overall funding profile.
The bank prefers organic growth over inorganic growth.
Credit cost has been under control and lower than the guided range over the past
three years. RoEs are expected to remain stable in the range of 20% to 22% after FY20.
30 August 2018
3
 Motilal Oswal Financial Services
AU Small Finance Bank
Mr. Sanjay Agarwal
MD & CEO
Retail banking – Unlimited opportunities
We hosted Mr Sanjay Agarwal – MD & CEO of AU Small Finance Bank – as part of CEO
Track at our conference. Key takeaways:
The bank platform has developed a strong pull among customers. AUBANK has laid a
strong focus on cross-sell, with a strategy to sell at least 3-4 products per customer.
Business mix will continue being dominated by vehicle loans, followed by SME/MSME
loans. Gold, housing and consumer durable loans are also seen as interesting business
opportunities. Product selection is based on interest rates, which typically range from
13 to 15%.
AUBANK has developed innovative savings products with monthly interest payouts.
To enrich customer experience, the bank has implemented paperless branches even
for normal transactions like draft issuance and cheque deposit.
The bank has drawn up a '4D' strategy to grow its business – Data, Distribution, Digital,
and Delight (in the form of higher interest rates on SA account, monthly payouts,
extended banking hours, etc.).
AUBANK targets to fund 75% of the balance sheet by deposits over the next two years.
Digital and Automation: The bank is scaling up distribution/financial inclusion through
Digital – the ‘AU Abhi’ app for self on boarding and ‘AU Buss app’ for lead aggregation
are some examples.
AUBANK sees headwinds in the form of (a) competitive intensity – irrational behavior
in some product segments, (b) customer mindset, (c) RBI’s plan and roadmap for SFBs
(d) push for one bank theory and (e) execution.
The adoption of “Phygital” strategy – a mix of physical and digital – is likely to create
low-cost distribution.
Way forward
By Mar’22, AUBANK aims to build a retail bank by leveraging 4Ds.
It aims to employ a customer-centric business model.
The target is to consistently grow assets by 30-35% per annum; assets targeted to
reach at USD10b by 2022 – INR8b of loan assets.
Funded by the granular deposit base, deposits are targeted to fund 70-75% of assets.
The aim is to become the most eligible SFB to be promoted as a universal bank.
30 August 2018
4
 Motilal Oswal Financial Services
Dabur India
Mr. Sunil Duggal
CEO
Rural demand revival trend gaining steam
Dabur poised to benefit as a result of its own initiatives as well
We hosted Mr Sunil Duggal – CEO of Dabur India – as part of CEO Track at our conference.
Key takeaways:
Management estimates ~14% CAGR for consumer companies up to 2025 – rural India
is estimated to lead growth with ~15% CAGR. Rural growth could have been even
higher if not for the likely higher pace of urbanization over the next few years.
Urbanization has been slow over the past 10 years (+400bp to ~34%). Rural accounts
for ~65% of the population, but only around 35% of FMCG sales.
In consumer staples, management expects the 172m households in the middle- and
lower-income groups to be the major driver of growth. 69% of this population lives in
rural India.
Rural customers are brand savvy, are trading up and willing to explore. These
customers are street-smart, value-seeking and social. In fact, sales of mid-level brands
in these regions have been higher than those of the perceived ‘rural brands’.
The gap between rural and urban growth has widened to ~300bp in recent quarters,
barring 1QFY19 when growth converged.
Why is Dabur well placed and what has it done?
a) The company has achieved an overall reach of 6.4m outlets, of which 1.04m is
direct (targeted 1.2m by end-FY19).
b) Dabur reaches 42,000 villages in India, which is easily among the highest
compared to peers. In 2012, when it had commenced the ‘Project Double,’ the
company reached 12,000 villages. Rural salesforce of ~1,400, too, is among the
highest.
c) The company also has a network of 366 super-stockists, 3,360 stockists and 10,266
sub-stockists.
d) Project Buniyaad aims for better utilization of the company’s reach.
e) From 17 SKUs in rural two years ago, Dabur has 20 SKUs now, and the aim is to
take it to 30. Similarly, the number of FMCG brands sold has increased from 7.3 to
8.3 over the past year.
f) Inventory has come down from 33 days in FY16 to 17 days in 1QFY19.
Key segments that are likely to be leveraged for higher rural thrust are home care,
affordable skin care and juices. Punjab – the most prosperous rural state – has healthy
juice consumption in rural areas compared to mainly drinks and carbonated
beverages.
Urban will be an important area of growth as well, particularly with products like
juices and the offer for more healthy products across categories.
30 August 2018
5
 Motilal Oswal Financial Services
Pidilite Industries
Mr. Bharat Puri
MD
Pioneering category creation
Employing a combination of Core, Growth and Pioneer categories to fuel
growth
We hosted Mr Bharat Puri – MD of Pidilite Industries – as part of CEO Track at our
conference. Key takeaways:
By 2030, 40% of India’s population will live in cities. Management believes that
Pidilite’s brands have a long runway to grow as urbanization picks up, particularly in
tier 2/3 cities.
Pidilite’s strengths – (a) passionate about pioneering, (b) deep insight, (c) holistic
brand management, (d) persistent innovation and (e) teams working together with
passion.
The three categories of growth are Core, Growth and Pioneer.
A) Core: Targeted at 1-2x GDP growth. The strategy is to increase penetration,
innovate and fuel premiumization. Fevikwik’s reach of 4m outlets is already
among the best in the Indian FMCG space. Change in communication in such
brands is also important, and advertising and communication are now being
targeted toward females as they end up doing most of the minor repair work at
homes in smaller towns. Innovation (variants launched over the last three years
are expected to contribute around a third of sales growth) and premiumization
(which is being witnessed across the Fevicol range like water resistant, fast setting
and anti-bubble, among many others) are the other focus areas.
B) Growth: The company is aiming to create new categories (like water proofing
brand Dr-Fixit), initially creating awareness and then with holistic brand
management (expanding portfolio and improving communication accordingly).
C) Pioneering businesses in India: The acquisition of CIPY (which is into specialized
floor painting) and the tie-up with Jowat (which is into hot-melt technologies for
readymade furniture where PIDI intends to have as high share eventually as
custom-made furniture) are some examples of the company’s initiatives toward
this.
Key factors that will enable growth: (1) All-encompassing use of digital, which is likely
to provide further competitive edge and increase efficiency in areas like distribution.
(2) Sales and distribution excellence using two sets of salesforce – one to serve traders
and the other to educate customers. (3) Continue to encourage the ‘Preneurial’ culture
– combining entrepreneurial and professional cultures to develop a culture that
‘punishes not trying rather than punishing trying and failing’.
In most of Pidilite’s new products, it plans to attain critical mass in 2-4 years.
With low cost of labor, India and Africa are among the few markets where custom-
made furniture is cheaper than ready-made furniture. The non-standardized
preference of Indian consumers is also a factor favoring custom-made furniture.
Nevertheless, tie-ups like Jowat give the company a promising entry into ready-made
furniture as well.
30 August 2018
6
 Motilal Oswal Financial Services
Thematic
Presentation
Mr. Manish Sabharwal
Chairman
TeamLease Services
India employment and education outlook
We hosted Mr. Manish Sabharwal, Chairman of TeamLease Services, as part of CEO Track
at our conference. Following are the key takeaways from his presentation.
While (lack of) job creation is a hotly discussed topic in the Indian context over the last
few years, the problem is not one of jobs, but one of wages / productivity. In the
context of the same, solution requires focused attention towards four areas:
formalisation, urbanisation, industrialisation, financialisation and human capital
Productivity is set in a low level equilibrium of low wage and low productivity. This is a
problem that takes a longer term solution and 10 1-year solutions will not work.
Problem with the “Enterprise”: There are 63mn Enterprises in India. Only 6.7m have
paid any form of indirect tax, 12mn don’t have an office and only 1mn paid PF. Only
18,500 firms have paidup capital of more than INR100m. An example of the
productivity skew is the IT sector - 0.7% of employment but produces 8% of GDP
Average life expectancy of Fortune 500 company today is 14 years, it was 64 in 1955.
Two biggest assassinators of productivity in Indi a are Farm and Self-employment.
The problem with informal labor: Indians have redefined their aspiration from
minimum wages to living wages. This means that while there are plenty of jobs
available at the lowest strata, with minimal skill requirements, here are no takers.
However, in the informal sector, gross wage = net wage, with the PF and ESIC benefits.
As a result of this arbitrage, formal sector is therefore incompetitively positioned.
Wages don’t go up in an economy till you run out of farm labor. This seems to have
been defied in the Indian context, and the only reason is the difference between real
and nominal wages. Urbanization is limited to a very few cities in the country
compared to other economies in the world. As a result, the disparity in nominal wages
between urbanized and other cities does not count for much. Though wages here keep
going up, oversupplied farm labor coexists.
There is some discontinuity seen towards formalization - 30mn new provident fund
accounts got added. These are likely jobs that existed as informal jobs and got
formalized.
30 August 2018
7
 Motilal Oswal Financial Services
‘Management Says’
Key takeaways from Motilal Oswal Annual Global Investor Conference 2018
Company
Takeaway
A. No impact of new axle load for CV industry; expect 12-15% growth in
FY19.
A. No impact on demand from change in axle norms. Net increase in axle
capacity post revised schedule is just 12-13% v/s 20% expected earlier.
B. Expect Aug-18 wholesales to be healthy, despite uncertainties related to
new axle norms. Exposure to Kerala is just 500 vehicles a month.
C. Targeting stable RoCEs across cycles at 20-25% and debt:EBITDA of 1x,
driven by reducing cyclicality by ramping-up nascent businesses.
D. Capacity is being debottlenecked and is prepared from strong growth in
FY20. Capacity would be ~180k for M&HCV and ~72 for LCVs.
E. Discount per truck is steady (v/s 1QFY19) at ~INR0.35m (15-17%).
A. JLR: Continued impact in Aug-18 from WLTP in EU/UK and duty-related
discounts in China. Demand should normalize from Sep-18 in both these
geographies.
B. JLR: Expect positive impact of duty reduction in China from 2HFY19, with
market share gains from competition.
C. JLR: Very high focus on cost reduction; appointed very senior level
executive to focus just on cost. Expect further details in due course.
D. JLR: Order book at 5.5 months for I-Pace and 2-3 months for PHEV of
RR/RR Sport. These models are yet to be launched in the US and other
global markets.
E. JLR: FCF negative for FY19, but lower negative FCF than FY18; FCF to
break-even from FY20 and turn positive in FY21.
F. Witnessed weakness initially in retail demand post new axle load
regulations. However, demand has come back to normalcy from mid-
August.
Impact
+ ve
+ve
+ ve
+ve
+ ve
+ ve
- ve
- ve
+ ve
+ ve
Automobiles
Ashok Leyland
Tata Motors
+ ve
Company
Takeaway
A. Witnessing a broad pickup in end-consumption demand, with higher
growth seen in non-urban areas v/s urban areas.
B. No change in payment terms from the government on defense orders –
Capital Goods and
continues receiving 15% advances and balance on milestones.
C. Refinery orders likely to be placed in FY20 are a) BPCL Numaligarh, b)
Electricals
Chennai Petroleum refinery, c) Bina Refinery expansion and d) Gail
Kakinada Petrochemical plant. The West Coast refinery could take two
years, as land acquisition is an issue.
A. Maintained sales growth guidance of 15% YoY in FY19 and margin to be
flat YoY.
B. Not seen any change in the payment terms from the government on
Bharat Electronics
defense orders – continue to receive 15% advances and balance on
milestones.
Impact
+ve
+ve
+ve
+ve
+ve
30 August 2018
8
 Motilal Oswal Financial Services
Engineers India
Havells
C. Expect Akash order for INR54b to also be finalized in FY19 – waiting for
CCS approval. The QR SAM order is likely to be finalized only in FY21.
D. Not much progress on the TCS and BMS programs of the Army.
A. Expect HPCL Barmer order to be finalized by the end of the month. It
would be worth ~INR33-35b for EIL with a mix of EPC and consulting
orders
B. Orders likely to be placed in FY20 are a) BPCL Numaligarh, b) Chennai
Petroleum refinery, c) Bina Refinery expansion and d) Gail Kakinada
Petrochemical plant. The West Coast refinery could take two years, as
land acquisition is an issue.
C. Beginning to see a pickup in enquiries for large-sized contracts in the
Middle East post the rise in crude prices. Currently, mid-sized projects are
being awarded in the UAE.
A. Witnessing a broad pickup in end-market demand, with higher growth
seen in non-urban areas v/s urban areas.
B. Four key steps being implemented in Lloyd: (1) Premiumization of the
portfolio, (2) Investment in the brand, shop display, (3) Getting into large-
format stores and (4) Investment in manufacturing.
C. Price hikes were taken in AC in June to offset the impact of INR
depreciation and RM cost increase. Competitors have not done the same
– price difference with competitors is low as a result.
D. Aim is to take market share and grow in all categories profitably – this
would not be at the cost of margins.
Takeaway
+ve
-ve
+ ve
+ ve
+ ve
+ ve
+ve
+ ve
+ ve
Impact
Company
Cement
A. The company plans to expand into the wall tiles business through a JV in
Morbi.
B. Sales mix for the company is 60% retail and 40% institutional.
C. The company has a dealer network of 1,500.
D. The sanitary ware segment grew by 11.5%, while the faucet segment grew
by 19% YoY in 1QFY19.
A. Kajaria took two price hikes of ~2% – one in 1QFY19 and other in 2QFY19.
B. The company has launched large-format GVTs, which earn better margins.
C. Sales mix for the company is 75% retail and 25% institutional.
D. Kajaria has 1,400 dealers, of which 10-12% are exclusive dealers. The
company plans to increase the proportion of exclusive dealers to 20% in
the next two years.
Takeaway
+ ve
+ ve
+ ve
+ ve
+ ve
+ ve
+ ve
+ ve
Impact
Cera Sanitaryware
Kajaria Ceramics
Company
Consumer
A.
Ongoing drop in copra costs is unlikely to result in pricing intervention for the
next few months. Nevertheless, if costs drop significantly further, they will reduce
MRPs. This augurs well for margins.
+ ve
+ ve
+ ve
+ ve
Marico
B. Parachute Aloe Vera has gained traction and is likely to be rolled out
across the country.
C. Foods is clocking INR1.25b annual sales and is likely to be INR2b in FY20.
Soups and meal replacement are also expected to boost sales.
D. Adspend is expected to pick up to around 10% in FY19. EBITDA margins
are likely to be around 17-18%.
30 August 2018
9
 Motilal Oswal Financial Services
United Spirits
E. Saffola is unlikely to resume growth trajectory in FY19. In an effort to grow
the lower end variants like Saffola Tasty, there has been some
cannibalization of premium variants like Saffola Gold and Saffola Total, an
issue the company says will take time to address.
A. Opening up of the Uttar Pradesh market is a positive for industry participants.
B. Raw material outlook continues to be benign. There could be an increase
in ENA costs by the end of the year though.
C.
From a ‘hands off, eyes off’ approach towards popular brands in states
where this business has been franchised, the company has moved to ‘
hands off, eyes on’ approach in order to prevent any material loss of
market share by the end of the franchise period of around 5 years.
D. In a bid to protect its share, there have been pricing actions from Pernod,
which, in our view, could restrict industry profitability for FY19.
E. After effective price increases in 18 states amounting to a blended
increase of 1.8% in FY18, there may not be a similar price increase in FY19.
Takeaway
-ve
+ ve
+ve
Unclear
- ve
- ve
Impact
Company
Financials – Bank
A. PCA banks are not letting go off AAA-rated clients.
B. Borrower has become very cautious after Feb 12 circular and prefers to
work with a few lenders as compared to 20 lenders earlier.
C. Difference between the LAP yields and home loan yields has come down
to 75bp v/s 200bp earlier.
D. Lot of construction in the tier 2 and 3 cities is self-construction.
E. Bank has achieved 20% penetration on its deposit customer base of 240m
in the credit card business.
- ve
- ve
-ve
+ve
+ve
Impact
+ ve
+ ve
+ ve
+ ve
+ ve
+ ve
+ ve
-ve
Axis Bank
Takeaway
A. Corporate lending has a lot of opportunities, but banks have become
cautious on big-ticket loans.
B. Credit card business is a natural oligopoly in any country with approx. 4
Life Insurance
to 5 credit card issuers having the majority share.
C. Credit life penetration is very low in the country and is expected to grow
as more and more life insurers start pushing the product.
A. For the company, banca channel has grown faster than agency channel as
commission to agents has not been attractive over the last couple of
years.
B. Post completion of 5 years, if the ULIP Policies lapse, then it can be
revived within two years after the lapsation.
SBI Life Insurance Co.
C. Over the next 2-3 years, individual protection will outgrow group credit
Ltd
life.
D. Currently, the regulator is concerned about mis-selling rather than
regulating margins or commissions.
E. According to the company, digital is the most expensive channel.
Company
30 August 2018
10
 Motilal Oswal Financial Services
Company
NBFC
ABCL
CIFC
GRUH
HDFCAMC
Takeaway
A. Supply-side challenges in affordable housing prevail.
B. Expect demand impact of 4-5% on new vehicles due to new axle norms.
C. MF Industry AUM to grow to INR50t in next 5 years.
A. Impact of Ind-AS on NBFC and consol. net worth is minimal.
B. Expect significant VNB margin (post overrun) improvement in FY19.
C. Will expand to 84 branches in housing finance by year-end (70 currently).
A. Only 25% of HCVs to be impacted by new axle load norms. Expect
demand impact of 4-5% on new vehicles. Axle load notification for
existing vehicles came in August.
B. Margins in vehicle finance dipped due to mix change. However, yields are
incrementally up ~50bp now.
C. Resolution in LAP has been slow, but asset quality has been steady.
A. Sluggish supply of affordable housing remains a key issue for growth.
B. Prepayments have come down in FY19 compared to FY18
C. Margins should be largely stable as the company is sacrificing growth for
margins.
A. Strong distribution with presence in 134 places in B30 cities.
B. Sourcing contribution to remain largely stable in the near term.
C. Will focus on similar product mix over next 2 years.
Takeaway
A. The diagnostic industry is poised to grow at 12-15% CAGR over the next
3-4 years on the back of increased per capita income, changing lifestyle,
and higher diagnosis required by doctors before providing treatment.
B. Increased automation and a gradual shift in the mindset of patients
from star doctors to the brand of hospitals have been reducing the
dependence of hospitals on selected doctors, and thus, lowering
operational cost for hospitals.
A. Aster has planned to double bed capacity in GCC from 875 to 1,500 over
the next three years. Also, it has planned to double bed capacity in India
over the next five years.
B. Revenue growth in GCC region would be led by patient addition (~15%),
new hospitals (~5%), price hike (~4-5%) and case mix change (4-5%).
C. Capacity utilization in GCC is lower at 52% due to start of hospitals at
Sharjah and Qatar. Adjusting for the same, utilization would be 60%.
Aster intends to increase utilization to 75-80% over the next three years.
A. DLPL maintained its guidance of 15-16% revenue growth and 25-26%
EBITDA margin led by increased test per patient and increase in patient
addition.
B. Average price CAGR has been 1% over the past 8-10 years, despite a vast
improvement in the service levels by DLPL.
C. Though pricing may be relatively low in Ayushman Bharat Scheme, it
would increase awareness, and thus, drive volume growth over medium
to long term.
Impact
+ ve
+ ve
+ ve
+ ve
+ ve
+ ve
- ve
+ ve
+ ve
- ve
+ ve
+ ve
+ ve
+ ve
+ ve
Impact
+ ve
Company
Healthcare
+ ve
+ ve
+ ve
+ ve
+ ve
+ ve
+ ve
Aster DM
Dr Lal Path labs
30 August 2018
11
 Motilal Oswal Financial Services
Company
Takeaway
Impact
Metals
A. Approval of West Bengal Regulator is pending for the demerger to go
through. Approval in expected to happen in a couple of months and listing
is likely in a further a couple of months thereafter.
B. Spencer focus is shifting to growth. It has entered online business in the
areas where it operates. It expects to double revenue in four years, driven
by SSG growth of 9% and remaining through store addition. Not looking at
selling stake in Spencer.
A. Realization is likely to fall by less than INR1,500/t in Q2. While, cost will
increase due to increase in iron ore cost. Margins will thus be impacted in
Q2. However, realizations have rebounded earlier than expected which is
positive.
B. India steel production guidance of 5.5-5.7mt in FY19
C. Plan to deleverage by INR40b in FY19 and INR60b in FY20
A. Technically can blend 50% domestic coal, but it has not started yet due to
non-availability of domestic coal
B. Looking at in-organic opportunities but selectively – only at assets where
the generation cost is amongst the lowest quartile of India’s cost curve
C. For the electric vehicle venture, has hired a veteran auto expert, who is
also building the team for the venture. However, land, partner and
technology details are still in process.
A. CERC draft norms are likely sometime in Q3
B. Pay negotiation with non-executives is likely to be completed next week.
Once done, will file with CERC for pass-through of increase in employee cost
C. National merit order will be positive for NTPC
D. Parki coal mine will be capitalization in December. Regulatory norms of
70:30 Debt:Equity will apply. Captive coal production will increase from
2.5mt in FY18 to 8mt in FY19, driven by Pakri.
E. Commercialization of Lara, Kudgi and Meja is expected in September
Takeaway
Impact
CESC
JSPL
JSW Energy
NTPC
Company
Oil & Gas
ONGC
A. Oil production is likely to remain stagnant, while gas production should
increase.
B. Further restructuring may happen this year.
C. Capex guided at INR320b for FY19.
A. Another storage tank can take nameplate capacity to 19.5mmtpa in next
3-4 years at Dahej.
B. Expect utilization at Kochi to improve with completion of the Kochi-
Mangalore pipeline.
C. Terms for Bangladesh LNG terminal are under negotiation.
Petronet
30 August 2018
12
 Motilal Oswal Financial Services
Company
Takeaway
Impact
Technology
A. Microsoft is working closely to roll out Azure. Hence, a further uptick can
be seen. Moreover, internal IT (Microsoft office) projects are also given
to Mindtree now, making strong traction from the top account.
B. Demand scenario has improved drastically and base has been expanding.
Mindtree will now target on increasing revenue to USD 50m+ from top 5
accounts.
C. Further uptick will be seen in margins, with incremental expansion likely
every year from FY18 to FY20.
A. Direct segment saw good traction in BFSI, logistics and healthcare; within
BFSI, digital deals from consumer banking and wealth management
remain the key focus area.
B. Good traction seen from Blackstone portfolio, with 25% of deal wins
(direct channel) coming from the same. Huge potential ahead as
currently Blackstone portfolio companies spend USD 1.5b.
C. 70% of incremental deal wins are coming from digital side of the
business. Overall huge shift is seen in spending pattern from enterprise
to digital among clients.
Takeaway
+ ve
+ ve
+ ve
+ ve
+ ve
+ ve
+ ve
+ ve
+ ve
Impact
LTI
Mindtree
Mphasis
Company
Telecom
A. Traditional Services: Expect 3-4% revenue growth in FY19; EBITDA margin
to be in the range of 29-31%.
B. Growth Services: Expect 30% revenue growth to continue in FY19 and for
the next three years. Expect negative EBITDA to halve in 2QFY19, turn
breakeven in 3Q and positive in 4QFY19. However, EBITDA will remain
negative in FY19.
C. Innovation Segment: Expect USD50m investments in FY19. This should
taper off from FY20. Expect to reach USD150m revenue by FY21.
D. ATM business: Management considers the business as non-core and will
not be investing further. It is rather evaluating opportunities to monetize
the same.
E. Expect Data business to reach EBITDA margin of 23-25% in the next three
years.
F. F) Company is awaiting Govt. approval for merging TTSL’s enterprise
business. Should take 6-9 months post approval. So, the merger is likely
to conclude in next 12 months.
+ ve
+ ve
+ ve
+ ve
+ ve
+ ve
Tata Communication
30 August 2018
13
 Motilal Oswal Financial Services
Company
Takeaway
Impact
Midcaps/Others
A. The company has best-in-class margins in the soda ash business on
account of high utilization levels (97% in FY18) and captive production of
raw materials like limestone.
B. The focus would be on apt capital allocation – neither leverage the
business beyond 1:1 debt-equity ratio nor become a zero-debt company.
C. The global soda ash supply demand situation is expected to remain tight
with demand growing at 2.5% per annum and no massive expansion of
capacities in sight. GHCL has taken a price hike of 5% in soda ash in the
last 4-6 months.
D. The company, however, expects pressure in the home textile segment
because of oversupply situation. However, China’s own consumption is on
the rise. As a result, competition from there is expected to subside.
E. There are a couple of headwinds in the home textile business: viz. 50%
increase in MSP of cotton and US trying to challenge export incentives
under WTO.
A. Cattle feed is expected to continue delivering a steady margin. There is
even a possible improvement of 2-3% due to cost saving over the next 2-3
years.
B. In the animal feed business, the company has more or less safeguarded
margins with a pass-through raw material cost mechanism.
C. The company has witnessed revenue CAGR of 25% over the last five years
in the crop protection business.
D. The company’s crop protection business benefits from its dominance in
certain niches, which enables a high EBIT margin of 23.5% and RoCE of
34%.
A. The company expects FY19 revenue to grow at 7-9% and EBITDA margin
to expand by 80-100bp.
B. Growth in core branded textile business to be driven by a continued focus
on product & service innovations and asset-light franchise-based network
expansion model of mini TRS stores. Already opened 101 stores and
expected to open another 200 by 2020.
C. Branded Apparel business to continue growing at a mid-teen to high-teen
rate, led by scaling of power brands and supported by new customer
segments – Ethnix and Next Look.
D. The company expects profitable growth momentum in engineering (of
tools & hardware) and auto components businesses. The focus would be
to unlock value at an opportune time at right value.
A. In the outbound travel business, market share of organized players stands
at 20-25%, of which the company holds 5-6% market share. The company
thus has huge scope to capitalize on this opportunity.
B. Domestic and online business will turn positive in FY19.
C. Destination Management Specialist (DMS) business, which was acquired
last year, is expected to turn EBITDA positive by FY19 itself, as against
earlier expectation of FY20. Currently losses in the DMS business have
reduced by 70%.
D. Company has successfully pared down its debt by INR1.94b and has plans
to further deleverage the balance sheet by way of available cash on
books.
+ ve
+ ve
+ ve
GHCL
Neutral
-ve
+ ve
+ ve
+ ve
+ve
+ ve
+ ve
Godrej Agrovet
Raymond
+ ve
+ve
+ ve
+ ve
+ ve
Thomas Cook
+ve
30 August 2018
14
 Motilal Oswal Financial Services
Company
TTK Prestige
Takeaway
A. The company’s own stores account for 16-17% of revenue, E-commerce
accounts for 9%, modern retail for 20%, CSD for 5% and traditional
stores for 52%-59%.
B. Post-acquisition of Hornwood, the company suffered due to Brexit.
However, it is now recovering. TTK has brought about some changes in
Hornwood such as adding an online platform and introducing a new
pressure cooker line.
C. The company is looking to expand its product portfolio inorganically
into segments such as geysers and fans. Fans and geysers’ market size is
10x that of kitchen appliances. Hence, the company could evaluate
regional players for any potential acquisition.
D. Cleaning solutions to account for INR4b by FY22.
Impact
+ ve
+ ve
+ ve
+ ve
30 August 2018
15
 Motilal Oswal Financial Services
In conversation
1. We are cautiously optimistic on demand, says Pidilite
Bharat Puri, MD, Pidilite Industries said that we are cautiously optimistic. “While
demand is good what the new normal is; frankly the next two-three quarters is
going to tell you that,” he said. Talking about numbers, he said, “The inflation is
always the single biggest dampener for growth in any emerging market and that
is true for ours. So that is note of caution one. Note of caution two is normally
fast moving consumer goods (FMCG), consumer goods tend to be at 1-1.5 times
gross domestic product (GDP)growth.” “If that continues as GDP growth comes
in at the 7-7.5 percent mark then most FMCGs looking at double digit growth
would still be a reality,” he added.
2. No immediate plan to sell stake in Sadbhav Infra, says
Sadbhav Engineering
Nitin Patel, ED, Sadbhav Engineering said that there is no immediate plan to sell
stake in Sadbhav Infra. “The business model of Sadbhav Infra is to own the
highway concession and assets basically. So obviously, the churning of the assets
under Sadbhav Infra is a part and parcel of the regular business of the company
and at Sadbhav Infra level, there is no immediate plan to have any kind of stake
sale. So what basically company is always looking to churn the asset at
appropriate level,” said Patel.
30 August 2018
16
 Motilal Oswal Financial Services
From the think tank
1. Is the USD ready to turn lower?
Whatever you may think of Trump’s integrity, style, smarts or looks, there is no
doubt that he has brought a cat amongst the pigeons on trade. And, given that
the US is the largest buyer of goods from everywhere, his approach, like that of
large buyers in any industry, is certainly sound. Give me what I want or else…
Of course, his pathetic “Art of the Deal” approach, where you begin with
outrageous demands to ultimately get an acceptable deal, unsurprisingly, isn’t
cutting any ice in global geopolitics where poker is eaten before breakfast.
Nonetheless, Germany, in particular, has quietened down, since it cannot afford
to have its car sales to the US threatened.
2. Dark clouds gather as tech stockpiles hit pre-crisis levels
Storm clouds are brewing over the global technology industry. A host of
hardware companies, including Apple Inc, Samsung Electronics Co, Foxconn
Technology Group and Intel Corp are sitting on inventory stockpiles not seen
since the financial crisis a decade ago. And it comes amid a possible US-China
trade war; likely monetary tightening by the Fed; more expensive growth in
China’s consumer economy; and a long-standing sense that we’re in a tech
bubble.
3. Is slash and burn the new norm in Global Trade?
Is slash and burn (S&B) becoming the new norm in global trade? Until now, S&B
remained limited to clearing land, especially for temporary agriculture. Two
unrelated developments on 27 August suggests that it is going to be replicated
for striking new trade deals and for slashing existing legal arrangements, which
encased international trade rules. In both cases, the principal protagonist for
implementing the S&B method is the same country: the world’s largest trading
member, à la the US.
30 August 2018
17
 Motilal Oswal Financial Services
Click excel icon
for detailed
valuation guide
Valuation snapshot
Company
Reco
Automobiles
Amara Raja
Buy
Ashok Ley.
Buy
Bajaj Auto
Buy
Bharat Forge
Buy
Bosch
Neutral
CEAT
Buy
Eicher Mot.
Buy
Endurance Tech. Buy
Escorts
Neutral
Exide Ind
Buy
Hero Moto
Neutral
M&M
Buy
Maruti Suzuki
Buy
Motherson Sumi Buy
Tata Motors
Buy
TVS Motor
Neutral
Aggregate
Banks - Private
AU Small Finance Buy
Axis Bank
Buy
DCB Bank
Neutral
Equitas Hold.
Buy
Federal Bank
Buy
HDFC Bank
Buy
ICICI Bank
Buy
IndusInd
Buy
J&K Bank
Buy
Kotak Mah. Bk
Neutral
RBL Bank
Buy
South Indian
Buy
Yes Bank
Buy
Aggregate
Banks - PSU
BOB
Buy
BOI
Neutral
Canara
Neutral
Indian Bk
Buy
PNB
Neutral
SBI
Buy
Union Bk
Neutral
Aggregate
NBFCs
Aditya Birla Cap Buy
Bajaj Fin.
Neutral
Capital First
Buy
Cholaman.Inv.&Fn Buy
GRUH Fin.
Neutral
HDFC
Buy
HDFC Stand. Life Buy
ICICI Pru Life
Buy
Indiabulls Hsg
Buy
L&T Fin Holdings Buy
LIC Hsg Fin
Neutral
MAS Financial
Buy
CMP
TP % Upside
EPS (INR)
EPS Gr. YoY (%)
P/E (x)
P/B (x)
ROE (%)
(INR) (INR) Downside FY18 FY19E FY20E FY18 FY19E FY20E FY18 FY19E FY18 FY19E FY18 FY19E
862
132
2689
665
20037
1417
28219
1504
891
290
3240
982
9364
310
262
558
946
149
3223
747
19280
1588
34111
1691
988
314
3446
1084
10805
388
360
548
10
13
20
12
-4
12
21
12
11
8
6
10
15
25
38
-2
27.6
5.4
151.3
17.7
469.8
64.0
799.6
29.1
39.5
8.2
185.1
41.0
266.7
8.2
22.9
13.9
29.3
6.6
153.9
23.5
584.2
76.1
966
37.1
52.5
10.6
193.4
48.3
311.2
10.2
30.1
15.6
36.3
8.7
174.6
29.3
712.6
99.2
1,238
49.1
65.9
12.8
219.0
55.5
409.2
14.6
38.2
22.8
-1.5
23.9
7.3
34.9
-0.7
-31.5
27.0
23.8
88.0
0.4
9.5
49.8
7.3
5.9
15.7
18.7
15.2
6.2
23.4
1.7
33.2
24.3
19.0
20.9
27.8
32.8
29.1
4.5
17.8
16.7
24.4
31.3
11.6
18.6
23.8
30.5
13.5
24.5
22.0
30.4
28.1
32.3
25.5
21.4
13.2
14.8
31.5
44.0
26.9
46.1
24.9
31.2
24.6
17.8
37.7
42.7
22.2
35.3
51.7
22.6
35.4
17.5
23.9
35.1
38.0
11.4
40.0
25.4
29.4
19.9
17.5
28.3
34.3
18.6
29.2
40.5
17.0
27.4
16.8
20.3
30.1
30.6
8.7
35.8
21.4
51.9
32.7
18.3
32.4
13.8
26.2
34.5
23.3
8.3
34.7
31.1
10.6
15.4
26.9
12.6
18.7
14.7
10.2
NM
39.2
NM
36.4
29.9
47.6
14.7
19.2
54.8
41.9
68.8
33.1
12.0
15.7
11.6
25.0
5.0
5.4
4.1
6.7
6.1
2.2
10.9
9.7
3.6
4.6
5.5
3.9
6.8
7.0
0.9
9.2
3.9
9.2
2.7
2.0
2.4
1.3
5.1
2.1
4.8
0.5
4.9
4.0
0.6
3.3
3.7
0.9
0.5
0.6
0.9
0.6
1.3
0.4
0.9
3.5
11.1
2.5
4.5
19.3
5.2
6.1
2.9
3.6
3.3
2.1
4.7
4.4
4.7
3.7
5.7
5.5
2.0
8.5
8.2
3.0
4.1
4.9
3.5
6.0
6.0
0.8
7.8
3.5
6.7
2.5
1.8
2.2
1.2
3.8
2.1
4.2
0.5
4.3
3.6
0.6
2.8
3.1
0.9
0.5
0.6
0.9
0.7
1.2
0.4
0.9
2.9
9.2
2.2
3.7
15.8
4.5
5.2
2.5
3.2
2.8
1.9
4.2
17.0
23.7
24.2
18.8
15.3
10.3
35.2
21.0
18.3
12.9
33.8
14.2
18.5
19.5
10.1
25.1
15.5
13.8
0.5
10.9
1.4
8.3
17.9
6.8
16.5
3.8
12.5
11.6
6.6
17.7
10.4
15.9
25.1
22.1
21.7
17.0
11.2
32.7
22.0
19.3
14.9
31.1
14.5
19.5
21.2
10.1
23.6
16.3
14.9
7.8
10.8
7.1
9.1
16.6
6.2
19.4
6.7
11.8
12.3
5.7
19.5
11.6
729
657
174
158
81
2078
341
1907
54
1288
641
18
366
760
670
170
175
110
2400
355
2250
100
1400
700
26
444
4
2
-2
11
36
15
4
18
84
9
9
46
21
10.2
1.1
8.0
0.9
4.8
67.8
11.1
60.2
3.8
32.5
15.1
1.9
18.4
14.0 19.8 -79.5 37
40.8 71.1
20.1 35.9 -92.8 1,705 79.2 590.8
9.5 11.2 13.8 18.9 18.2 21.8
4.9
9.7 -82.3 427.2 99.5 170.9
5.8
7.9
-1.3 22.8 35.2 17.0
79.2 94.9 19.4 16.8 19.9 30.7
9.9 20.8 -34.3 -10.8 110.5 30.8
81.8 108.2 25.2 36.0 32.2 31.7
6.5
7.8
LP
74.1 19.7 14.5
37.2 45.7 21.3 14.2 22.9 39.6
20.6 28.0 27.3 36.3 35.6 42.3
1.7
3.9 -25.5 -9.7 134.2 9.6
23.8 30.7 26.3 29.0 29.2 19.9
-1.3 30.7 43.1 35.1
19.6
8.3
44.2
53.4
8.0
30.5
3.5
PL
Loss
PL
-10.4
PL
PL
PL
PL
NA
35.9
34.3
35.5
21.9
6.2
23.7
-3.8
31.5
29.5
3.0
27.5
LP
LP
LP
22.7
Loss
LP
Loss
LP
22.4
44.5
33.4
20.8
25.5
10.1
22.6
2.4
18.0
74.7
14.3
27.7
67.9
62.7
129.2
66.1
LP
286.2
LP
291.2
34.8
32.2
26.0
18.9
13.1
19.4
22.5
8.4
19.0
17.4
18.7
25.3
NM
NM
NM
12.5
NM
NM
NM
0.0
36.6
68.8
19.6
23.2
68.8
46.1
84.3
33.9
14.2
27.4
13.2
31.9
147
95
283
327
84
310
88
175
90
278
430
85
360
97
19
-5
-2
31
1
16
10
-9.8 11.7
-43.2 5.1
-63.5 19.3
26.2 32.2
-50.3 -8.9
-5.3
7.9
-56.5 -4.3
-5.8 6.9
-17.8 2.5
-12.2 3.9
8.3
9.4
-29.6 -6.4
-3.5 2.4
-23.7 -2.1
-8.0 2.5
12.4
20.4
13.4
20.9
31.8
18.6
25.8
16.1
27.9
14.2
17.0
21.2
10.9
21.1
15.7
21.0
31.8
17.5
26.0
16.8
28.3
19.3
17.2
17.7
137
2984
648
1446
341
1950
466
382
1281
185
521
612
200
2500
960
1700
300
2335
525
450
1650
240
525
750
46
-16
48
18
-12
20
13
18
29
29
1
22
3.8
4.6
6.2
43.4 62.7 82.9
33.1 44.2 55.6
62.3 75.3 89.5
5.0
6.2
7.0
42.3 46.5 55.6
5.5
6.8
8.3
11.3 11.6 12.5
90.2 106.4 126.6
6.8 11.8 13.9
39.4 45.0 53.5
19.2 24.5 30.7
30 August 2018
18
 Motilal Oswal Financial Services
Click excel icon
for detailed
valuation guide
CMP
TP % Upside
(INR) (INR) Downside
484
600
24
409
460
13
1391 1750
26
552
710
29
2026 2500
23
1346 1650
23
EPS (INR)
FY18 FY19E FY20E
17.4 20.3 24.2
43.0 44.8 48.9
49.9 63.0 78.4
32.9 40.9 45.9
100.8 136.9 158.5
69.1 109.4 135.5
Valuation snapshot
ROE (%)
FY18 FY19E
12.5 12.4
24.1 21.4
13.9 15.2
16.9 18.0
12.7 15.4
12.7 16.9
14.8 15.7
11.6
18.0
2.5
17.5
48.7
4.5
18.3
15.7
17.3
18.7
23.1
13.7
9.1
21.9
8.8
12.4
15.9
11.0
6.1
9.7
3.8
9.5
8.0
2.0
6.1
14.4
4.4
27.4
6.5
6.9
16.2
9.4
8.2
25.3
32.9
49.0
25.9
29.2
-3.3
24.9
21.2
78.1
22.3
16.0
34.2
13.3
17.2
3.6
21.8
44.8
6.9
17.7
16.8
23.4
20.4
21.3
14.3
10.8
22.4
12.3
12.9
15.1
12.0
7.8
14.0
6.6
11.1
12.6
3.5
9.1
14.1
9.9
22.7
12.0
8.1
15.5
10.5
10.8
25.7
32.6
48.3
23.4
30.2
1.2
24.8
22.5
86.9
22.9
17.3
35.8
Company
Reco
M&M Fin.
Buy
Muthoot Fin
Neutral
PNB Housing
Buy
Repco Home
Buy
Shriram City Union Buy
Shriram Trans.
Buy
Aggregate
Capital Goods
ABB
Sell
Bharat Elec.
Buy
BHEL
Sell
Blue Star
Neutral
CG Cons. Elec.
Buy
CG Power & Indu. Neutral
Cummins
Buy
Engineers India
Buy
GE T&D
Neutral
Havells
Buy
K E C Intl
Neutral
L&T
Buy
Siemens
Neutral
Solar Ind
Neutral
Thermax
Buy
Va Tech Wab.
Buy
Voltas
Neutral
Aggregate
Cement
Ambuja Cem.
Neutral
ACC
Buy
Birla Corp.
Buy
Dalmia Bharat
Buy
Grasim Inds.
Neutral
India Cem
Neutral
JK Lakshmi Ce
Buy
Ramco Cem
Buy
Orient Cem
Buy
Prism Johnson
Buy
Sagar Cements
Not Rated
Sanghi Inds.
Buy
Shree Cem
Buy
Ultratech
Buy
Aggregate
Consumer
Asian Paints
Neutral
Britannia
Buy
Colgate
Buy
Dabur
Neutral
Emami
Buy
Future Consumer Buy
Godrej Cons.
Neutral
GSK Cons.
Neutral
HUL
Buy
ITC
Neutral
Jyothy Lab
Neutral
Marico
Neutral
EPS Gr. YoY (%)
P/E (x)
P/B (x)
FY18 FY19E FY20E FY18 FY19E FY18 FY19E
146.3 16.2 19.3 27.7 23.8 3.1
2.8
45.6 4.1
9.2
9.5
9.1
2.1
1.8
57.7 26.4 24.4 27.9 22.1 3.6
3.2
13.1 24.0 12.3 16.8 13.5 2.7
2.2
19.5 35.8 15.8 20.1 14.8 2.4
2.1
24.7 58.4 23.8 19.5 12.3 2.2
1.9
25.2 23.7 20.7 34.0 27.5 5.0
4.3
8.1
-8.8
64.1
12.7
14.3
-29.8
-11.2
14.8
30.8
17.4
51.1
22.4
10.9
18.2
-1.2
27.6
11.9
15.1
30.5
27.7
-35.6
106.8
-15.4
-42.0
5.8
-12.3
LP
288.2
LP
29.5
0.4
-10.9
-0.7
1.9
13.5
18.6
7.2
-8.5
Loss
11.4
6.6
24.7
5.5
-12.4
-2.8
27.0
6.1
45.6
37.6
23.4
52.6
12.6
0.8
56.4
23.4
12.5
15.4
27.0
21.1
51.4
34.5
9.3
18.8
33.9
54.7
99.2
28.7
76.8
80.2
58.1
8.0
138.5
416.9
101.0
45.4
10.0
20.5
43.6
24.5
16.4
28.0
25.7
22.6
16.1
20.4
17.0
12.7
22.1
27.8
22.0
19.8
29.8
30.1
14.8
14.5
21.6
18.0
27.4
31.6
51.8
27.2
38.1
67.3
47.4
62.6
33.5
39.7
40.5
45.3
36.9
34.4
66.7
20.0
36.7
46.5
48.4
20.6
33.0
19.9
37.4
63.7
16.9
26.1
51.9
48.4
49.9
16.1
36.3
31.8
38.5
34.4
40.3
46.9
18.7
37.1
44.8
29.0
53.6
109.1
29.2
21.8
48.8
51.4
39.0
52.5
18.8
25.2
33.8
39.2
13.5
29.3
19.8
23.9
51.6
15.1
22.7
40.9
39.9
33.0
12.0
33.2
26.8
28.7
22.3
20.2
36.4
10.6
20.6
28.4
26.8
22.5
21.1
14.5
15.0
44.4
42.7
27.2
59.8
68.3
41.3
56.1
38.9
705.8
58.8
37.6
60.1
31.2
36.8
48.7
7.8
3.6
0.9
7.8
19.8
1.0
5.4
3.7
6.0
11.9
3.9
3.4
4.7
9.8
4.2
1.9
5.3
3.5
2.3
3.2
1.4
4.2
1.4
0.7
2.7
4.0
2.3
5.6
1.8
1.3
7.4
4.7
3.2
15.9
23.7
20.5
14.7
12.6
8.8
15.7
8.9
53.8
7.4
6.6
18.7
7.0
3.2
0.9
7.0
15.8
0.9
5.0
3.4
5.2
10.5
3.2
3.1
4.4
8.2
3.9
1.7
4.8
3.2
2.2
3.0
1.3
3.8
1.3
0.7
2.5
3.6
2.1
4.5
1.6
1.2
6.4
4.3
2.9
14.9
21.0
19.4
11.8
11.0
8.7
13.6
8.0
50.9
6.9
6.1
16.3
1322
115
81
674
250
59
776
125
280
715
303
1351
1026
1179
1025
387
628
950
145
60
695
305
60
800
155
330
645
360
1570
1070
1150
1295
450
590
-28
26
-26
3
22
1
3
24
18
-10
19
16
4
-2
26
16
-6
19.8
5.7
2.2
14.5
5.2
2.9
23.5
6.3
7.5
11.2
17.9
51.7
19.8
24.4
20.5
24.1
17.3
25.2
6.1
3.2
20.0
6.4
4.4
26.5
6.3
11.7
13.8
20.1
59.7
25.1
29.5
31.1
32.4
18.9
31.3
7.1
4.1
25.1
7.8
5.1
31.9
7.4
13.2
16.9
25.7
72.8
30.1
38.3
40.4
37.2
21.6
234
1614
762
2618
1074
121
330
691
116
116
734
81
18829
4405
231
1633
1030
3198
1084
120
384
802
139
136
-
130
19804
4536
-1
1
35
22
1
-1
16
16
20
18
61
5
3
6.1
46.9
18.9
55.9
57.4
3.3
7.4
23.9
2.2
1.1
25.2
3.7
385.8
85.7
8.1
72.5
37.7
71.9
101.4
5.9
11.6
25.8
5.1
5.5
50.6
5.4
424.5
103.3
9.6
92.4
49.6
109.1
129.0
8.1
19.5
38.0
8.4
7.3
70.6
7.6
617.1
141.4
1392
6737
1150
478
561
53
1440
7411
1759
313
208
369
1405
7165
1360
440
665
69
1240
6710
2010
295
220
370
1
6
18
-8
19
30
-14
-9
14
-6
6
0
21.1
83.6
25.2
7.8
12.1
-0.2
21.1
166.5
24.5
8.9
4.9
6.5
23.3
98.6
27.8
8.5
14.4
0.1
24.5
197.3
29.2
10.0
5.7
7.6
28.3
124.9
32.5
10.1
17.2
0.9
28.5
222.1
35.6
11.4
7.0
9.0
10.1 21.6 65.9
17.8 26.7 80.5
10.5 16.7 45.7
9.7
18.9 61.5
18.8 19.5 46.2
LP 1,080.9 NM
16.1 16.2 68.2
18.5 12.6 44.5
19.5 21.8 71.8
13.2 13.8 35.3
14.9 24.5 42.3
17.6 18.2 57.2
30 August 2018
19
 Motilal Oswal Financial Services
Click excel icon
for detailed
valuation guide
CMP
Company
Reco
(INR)
Nestle
Neutral 11323
Page Inds
Neutral 35891
Parag Milk Foods Neutral
298
Pidilite Ind.
Buy
1151
P&G Hygiene
Neutral
9587
Prabhat Dairy
Not Rated 154
United Brew
Buy
1386
United Spirits
Neutral
641
Aggregate
Healthcare
Alembic Phar
Neutral
592
Alkem Lab
Buy
2117
Ajanta Pharma
Buy
1231
Aurobindo
Buy
691
Biocon
Neutral
614
Cadila
Buy
387
Cipla
Neutral
644
Divis Lab
Neutral
1276
Dr Reddy’s
Neutral
2386
Fortis Health
Buy
149
Glenmark
Neutral
645
Granules
Buy
112
GSK Pharma
Neutral
3343
IPCA Labs
Buy
764
Jubilant Life
Buy
719
Laurus Labs
Buy
439
Lupin
Buy
887
Sanofi India
Buy
6254
Shilpa Medicare Buy
487
Strides Shasun
Buy
480
Sun Pharma
Buy
621
Torrent Pharma Neutral
1767
Aggregate
Infrastructure
Ashoka Buildcon Buy
137
IRB Infra
Neutral
193
KNR Constructions Buy
235
Sadbhav
Buy
282
Engineering
Aggregate
Logistics
Allcargo Logistics Buy
119
Concor
Buy
640
Aggregate
Media
Dish TV
Buy
71
D B Corp
Neutral
232
Ent.Network
Buy
708
Hathway Cable
Buy
19
Hind. Media
Neutral
162
HT Media
Neutral
54
Jagran Prak.
Buy
124
Music Broadcast Buy
334
PVR
Buy
1361
Sun TV
Buy
768
TP % Upside
(INR) Downside
10620
-6
31600
-12
314
5
1325
15
10250
7
-
1550
12
615
-4
EPS (INR)
FY18 FY19E FY20E
140.0 181.0 197.8
311.1 412.2 529.4
10.4 12.0 14.9
18.9 19.7 23.5
115.3 156.6 186.4
3.5
6.4
9.7
14.9 18.7 23.7
6.7
9.2 13.2
Valuation snapshot
P/B (x)
FY18 FY19E
31.9 29.0
47.2 38.0
3.5
3.1
16.3 14.4
33.4 29.0
2.1
2.0
13.7 11.8
18.6 13.7
15.1 13.6
4.3
4.6
4.5
2.9
6.5
3.9
3.3
5.3
2.9
1.7
3.0
2.0
15.0
3.2
2.2
2.7
2.8
6.5
3.1
1.7
3.7
5.5
3.7
ROE (%)
FY18 FY19E
40.3 48.5
41.0 43.6
13.0 13.2
27.3 26.2
46.3 50.8
4.9
8.5
15.8 17.2
19.6 19.6
26.4 27.7
19.6
15.1
26.0
23.8
7.2
22.1
11.5
15.5
8.6
-2.3
15.6
12.2
16.2
9.3
18.9
11.9
15.6
16.1
10.3
3.9
8.7
20.3
12.6
19.3
17.0
20.4
20.1
11.3
19.5
11.7
18.6
12.5
1.6
14.0
12.7
27.5
12.7
21.6
14.0
9.4
17.2
14.5
4.4
11.2
16.2
13.2
EPS Gr. YoY (%)
P/E (x)
FY18 FY19E FY20E FY18 FY19E
13.2 29.2
9.3
80.9 62.6
30.3 32.5 28.5 115.4 87.1
187.1 15.8 24.3 28.7 24.8
13.2 4.0
19.3 60.8 58.4
-13.4 35.9 19.0 83.2 61.2
-2.0 83.8 52.1 44.2 24.1
71.7 25.7 26.3 92.9 73.9
26.1 36.4 43.1 95.0 69.7
10.5 16.4 18.5 57.0 48.9
2.5 14.3
-21.1 25.7
-7.5 -2.7
8.7
3.5
-39.2 71.1
20.6 2.5
31.2 14.3
-17.3 31.0
-10.9 53.6
PL
LP
-27.5 4.1
-21.8 20.2
14.4 56.0
18.1 49.8
23.3 38.2
-10.9 33.1
-17.4 -37.6
9.8 17.7
-0.7 65.4
-65.1 8.4
-48.5 36.7
-2.6 -10.4
-18.2 15.9
Loss
17.5
61.8
17.5
LP
-0.5
-29.1
24.7
12.5
33.2
26.2
11.9
96.5
8.9
29.8
21.5
21.4
234.2
20.0
28.0
13.2
34.6
16.4
47.7
54.5
14.8
26.8
92.0
39.3
35.0
29.6
231.2
-1.2
22.3
11.3
27.1
36.0
23.2
16.2
99.0
22.1
31.6
38.6
36.9
NM
22.7
19.8
85.1
40.3
15.8
27.7
19.0
44.1
38.0
42.6
46.1
32.9
32.8
NM
8.1
12.1
21.9
15.2
540
2475
1560
750
625
440
620
1270
2170
171
550
130
2888
850
1020
552
950
6590
620
481
700
1430
-9
17
27
9
2
14
-4
0
-9
15
-15
16
-14
11
42
26
7
5
27
0
13
-19
21.9
58.9
53.0
42.7
6.2
17.5
20.3
33.0
64.7
-2.3
28.5
5.7
39.3
19.0
45.6
15.8
46.8
141.7
12.8
11.3
13.5
53.7
25.0
74.0
51.5
44.2
10.6
18.0
23.2
43.3
99.3
1.4
29.7
6.8
61.3
28.4
63.0
21.1
29.2
166.8
21.2
12.2
18.4
48.1
28.2
98.6
65.0
49.5
20.9
19.6
30.2
52.6
120.6
4.8
35.6
8.7
69.4
38.3
73.3
31.2
45.1
191.6
26.9
23.4
25.6
65.0
23.7 5.0
28.6 5.2
23.9 5.3
15.6 3.5
57.8 7.1
21.5 4.5
27.7 3.6
29.5 5.7
24.0 3.1
104.2 1.7
21.8 3.5
16.5 2.2
54.5 13.8
26.9 3.6
11.4 2.7
20.8 3.1
30.4 3.0
37.5 7.1
22.9 3.7
39.3 1.7
33.7 3.9
36.7 6.5
28.3 4.1
173.4 12.2
8.1
1.1
17.1 2.9
17.6
13.9
14.1
24.8
23.4
38.9
12.6
53.8
NM
6.3
6.3
10.4
25.7
39.7
21.1
2.6
2.0
1.5
3.3
3.0
1.9
2.2
3.8
2.0
0.9
0.5
1.9
3.2
5.9
6.5
195
225
315
385
42
17
34
37
-4.2
23.9
19.4
12.9
0.8
23.8
13.7
16.0
2.6
23.5
16.8
17.8
11.4 -30.2 6.8
1.0 14.6 12.9
2.5 26.5 15.5
2.3
1.7
1.3
3.1
2.8
1.8
2.3
3.6
2.2
0.8
0.5
1.8
3.0
5.2
6.0
12.5
12.8
9.5
9.1
8.9
-2.1
18.4
3.7
-8.7
14.0
12.6
14.3
9.0
12.2
25.2
13.8
12.5
10.0
12.9
12.0
4.9
17.0
6.9
-8.2
13.2
7.5
17.5
11.9
13.9
29.6
146
769
23
20
7.3
17.1
8.4
25.8
10.5
30.9
-23.1
13.4
4.7
16.3
51.2
45.1
24.3
19.7
20.4
16.4
37.5
34.0
100
300
851
47
237
59
156
455
1565
1050
41
29
20
148
46
10
26
36
15
37
-0.4
17.6
6.8
-0.9
23.9
13.0
9.6
9.1
26.7
27.7
1.8
18.4
13.2
-0.8
25.5
8.5
11.9
13.0
34.3
36.5
5.5
23.1
21.6
-0.6
28.0
9.9
14.9
17.1
44.8
41.9
PL
LP
-13.8 4.3
-40.5 93.7
Loss Loss
-7.5
6.9
75.6 -34.5
-9.5 23.8
41.1 43.5
29.9 28.6
11.6 31.5
201.8 NM
25.7 13.2
64.4 104.3
Loss
NM
9.5
6.8
16.6
4.1
24.7 12.9
31.6 36.8
30.5 51.0
14.9 27.7
30 August 2018
20
 Motilal Oswal Financial Services
Click excel icon
for detailed
valuation guide
Valuation snapshot
Company
Zee Ent.
Aggregate
Metals
Hindalco
Hind. Zinc
JSPL
JSW Steel
Nalco
NMDC
SAIL
Rain Industries
Vedanta
Tata Steel
Aggregate
Oil & Gas
Aegis Logistics
BPCL
GAIL
Gujarat Gas
Gujarat St. Pet.
HPCL
IOC
IGL
Mahanagar Gas
MRPL
Oil India
ONGC
PLNG
Reliance Ind.
Aggregate
Retail
Jubilant Food
Titan Co.
Aggregate
Technology
Cyient
HCL Tech.
Hexaware
Infosys
KPIT Tech
Mindtree
Mphasis
NIIT Tech
Persistent Sys
Tata Elxsi
TCS
Tech Mah
Wipro
Zensar Tech
Aggregate
Telecom
Bharti Airtel
Bharti Infratel
Idea Cellular
Tata Comm
Reco
Buy
CMP
TP % Upside
EPS (INR)
EPS Gr. YoY (%)
P/E (x)
P/B (x)
ROE (%)
(INR) (INR) Downside FY18 FY19E FY20E FY18 FY19E FY20E FY18 FY19E FY18 FY19E FY18 FY19E
506
680
34
14.6 16.1 19.5 -7.0 10.6 21.3 34.7 31.4 6.4
5.6 19.6 19.0
0.1 26.3 33.9 31.6 25.0 3.8
3.6 12.1 14.2
237
299
217
399
77
109
80
195
228
594
331
295
327
385
108
178
82
241
269
632
40
-1
51
-4
41
64
2
24
18
6
18.9
21.1
-8.5
23.4
5.0
13.1
0.3
23.7
20.4
71.9
24.4
22.2
1.9
33.4
9.1
13.7
8.9
32.4
21.6
85.1
27.8 120.5 29.4 13.6 12.6
9.7
26.3 7.2
5.0
18.6 14.2 13.5
3.8 Loss
LP
101.2 NM 114.3
30.1 56.9 42.8
-9.8
17.1 11.9
8.2 35.3 80.7 -10.4 15.2
8.4
14.6 31.5 4.7
6.1
8.3
7.9
6.8
LP 3,359 -23.8 311.1 9.0
34.2 238.1 36.4
5.7
8.2
6.0
27.0 34.6 6.2
24.9 11.2 10.5
68.7 76.5 18.4 -19.3
8.3
7.0
73.3 31.2
2.2
12.7
9.7
11.0
48.9
32.5
40.7
12.2
51.8
18.8
12.8
54.8
11.9
35.1
31.5
19.3
94.9
64.5 36.9
3.0
-2.3
20.5 30.6
32.0 55.4
34.6 4.0
-12.4 6.7
11.0 -24.9
9.2 22.1
21.5 5.5
-13.6 -21.6
-1.2 49.3
-9.9 40.1
21.8 24.5
20.7 25.7
5.5 15.1
35.9
0.5
21.9
23.8
-1.0
2.4
4.7
11.5
7.3
19.0
5.8
11.3
11.9
23.9
13.9
24.8
26.5
26.2
18.2
13.1
17.3
18.0
18.0
39.0
9.5
18.4
28.0
16.8
14.1
21.6
14.2
34.0
14.7
38.8
7.3
18.0
36.4
15.5
5.4
6.6
30.6
17.3
6.3
9.4
8.8
16.8
21.2
12.5
104.3
69.8
76.5
18.8
16.5
26.0
21.8
23.2
30.1
28.4
29.2
20.8
36.1
31.3
17.2
16.6
29.8
23.6
28.3
7.4
13.8
23.4
14.9
5.1
8.7
25.0
16.4
8.1
6.3
6.3
13.5
16.9
10.9
70.4
54.4
58.2
18.5
14.3
22.6
19.4
19.1
22.4
21.6
22.4
18.2
29.5
25.2
17.0
15.8
22.1
21.4
1.4
3.5
0.7
3.4
1.3
1.4
0.9
1.7
1.3
1.2
1.5
6.4
1.9
2.0
5.7
2.0
1.5
1.3
5.7
3.9
1.3
0.9
1.1
3.6
2.6
1.9
21.1
15.4
16.6
3.4
3.9
6.5
4.9
3.2
6.2
4.4
4.6
3.3
12.0
9.0
3.4
2.8
4.3
5.7
1.3
3.1
0.7
2.7
1.2
1.3
0.8
1.3
1.2
1.1
1.3
5.4
1.7
1.8
4.8
1.8
1.3
1.2
4.9
3.5
1.1
0.8
1.0
3.1
2.3
1.7
17.1
15.3
16.0
3.1
3.4
5.5
4.7
2.7
5.4
5.1
4.2
3.2
9.4
8.8
3.0
2.4
3.7
5.4
12.8
26.7
-2.7
22.2
9.1
17.7
0.3
22.9
12.2
17.8
11.5
19.4
29.0
11.8
16.7
14.0
31.0
21.0
20.8
24.3
21.2
9.4
13.0
23.3
13.0
14.9
20.3
24.0
21.8
18.3
25.0
26.9
24.1
15.4
18.8
14.6
16.2
16.7
37.6
29.4
21.5
17.0
15.3
24.1
14.2
24.2
0.6
25.5
14.8
17.1
9.5
24.5
12.2
16.5
13.5
20.7
24.4
14.2
22.3
13.0
27.8
14.5
21.0
22.5
15.0
13.7
16.9
24.6
14.3
15.3
24.2
28.2
27.4
16.7
25.3
26.4
25.0
16.1
25.7
20.9
19.5
18.3
35.8
34.9
19.3
15.7
18.1
25.0
Buy
Neutral
Buy
Buy
Buy
Buy
Neutral
Buy
Buy
Neutral
Buy
Buy
Neutral
Buy
Neutral
Buy
Buy
Buy
Buy
Neutral
Buy
Buy
Buy
Buy
230
361
367
771
184
258
157
288
838
81
210
177
233
1294
311
535
361
990
196
428
254
383
1097
88
296
219
312
1301
35
48
-2
28
7
66
62
33
31
9
41
24
34
1
5.9
49.8
20.4
21.2
11.9
47.4
23.9
9.4
48.4
12.8
22.2
20.2
13.9
60.9
8.1
48.6
26.6
32.9
12.3
50.6
17.9
11.5
51.1
10.0
33.1
28.3
17.2
76.6
Neutral
Buy
1551
882
1320
1130
-15
28
14.9
12.6
22.0
16.2
27.5 180.6 48.2
20.5 39.9 28.4
51.2 31.3
45.9
81.5
22.4
85.8
18.2
64.4
63.2
70.2
58.9
55.4
93.5
52.6
21.5
95.0
24.8
4.5
21.2
3.1
6.1
38.0
13.2
19.8
7.2
37.7
-1.0
33.6
7.7
1.3
5.0
1.4
15.2
15.1
12.3
21.3
34.8
31.1
30.1
13.9
22.3
24.1
1.3
5.2
34.4
10.0
Neutral
Neutral
Sell
Buy
Neutral
Buy
Neutral
Neutral
Buy
Buy
Neutral
Buy
Neutral
Buy
719
1033
431
1410
294
1036
1249
1329
838
1399
2066
734
297
1570
780
1100
380
1600
320
1225
1100
1100
950
1700
1950
800
300
1500
9
6
-12
13
9
18
-12
-17
13
22
-6
9
1
-4
38.2
62.6
16.6
64.8
12.7
34.4
44.0
45.6
40.4
38.7
66.0
42.7
17.9
52.8
38.8
72.0
19.1
72.7
15.4
46.3
57.7
59.3
46.0
47.4
81.9
43.3
18.8
70.9
Buy
Neutral
Buy
Buy
375
284
50
550
470
305
70
670
25
7
41
22
4.1
13.6
-9.6
3.5
-0.8
1.2 -63.3 PL
LP
13.5 13.8 -8.1 -1.2
2.4
-15.2 -13.3 Loss Loss
Loss
0.7 13.8 -67.2 -78.5 1,752.3
92.0 NM
2.2
20.8 21.1 3.1
NM
NM
0.8
158.8 740.0 31.4
2.2
2.4 -0.5
3.2 15.6 14.9
1.0 -16.0 -26.5
30.1 9.4
4.2
30 August 2018
21
 Motilal Oswal Financial Services
Click excel icon
for detailed
valuation guide
Valuation snapshot
Company
Reco
Aggregate
Utiltites
Coal India
Buy
CESC
Buy
JSW Energy
Neutral
NHPC
Buy
NTPC
Buy
Power Grid
Buy
Tata Power
Neutral
Aggregate
Others
Arvind
Neutral
Avenue
Sell
Supermarts
BSE
Buy
Castrol India
Buy
Coromandel Intl Buy
Delta Corp
Buy
Interglobe
Neutral
Indo Count
Neutral
Info Edge
Buy
Kaveri Seed
Buy
MCX
Buy
Navneet EducationBuy
Oberoi Realty
Buy
Phoenix Mills
Buy
Quess Corp
Neutral
PI Inds.
Buy
Piramal Enterp. Buy
SRF
Buy
S H Kelkar
Buy
Tata Chemicals
Buy
Team Lease Serv. Buy
Trident
Buy
UPL
Buy
CMP
TP % Upside
EPS (INR)
EPS Gr. YoY (%)
P/E (x)
P/B (x)
ROE (%)
(INR) (INR) Downside FY18 FY19E FY20E FY18 FY19E FY20E FY18 FY19E FY18 FY19E FY18 FY19E
-98.8 PL
Loss 2,850 -53
2.1
2.2
0.1 -4.1
287
988
69
25
166
194
77
345
1292
75
34
194
253
75
20
31
9
35
17
31
-2
19.2
75.5
3.0
2.4
13.2
16.5
5.3
26.2 30.6 28.3
96.2 105.4 45.5
3.5
4.8 -21.2
2.7
3.0 -17.3
15.3 16.3 6.8
18.6 20.6 16.1
6.2
7.9
3.5
13.4
14.7
16.7
20.0
22.3
0.1
68.4
6.0
2.9
38.8
89.4
35.1
-45.7
31.3
67.8
-14.6
-26.1
21.2
44.2
115.7
-20.2
7.2
-10.3
-2.2
39.7
28.0
-21.8
5.9
36.6
27.4
15.5
11.4
16.0
12.5
16.0
22.0
15.4
29.3
1.9
-11.4
3.1
18.8
-27.8
15.8
14.5
11.5
8.4
45.7
94.1
15.8
5.3
15.3
1.1
27.6
7.8
3.0
40.3
32.9
5.7
16.7
9.6
36.5
11.3
6.4
10.7
26.9
12.1
36.5
33.7
25.9
0.7
19.1
36.3
52.7
13.8
23.9
22.3
46.7
12.8
46.3
42.4
52.1
20.6
69.2
27.5
34.6
18.5
56.9
16.5
8.3
15.0
13.1
22.7
10.3
12.6
11.7
14.4
13.1
31.4
123.8
17.0
22.8
18.5
46.8
16.6
11.5
69.9
19.9
38.7
25.4
36.2
38.5
48.2
28.9
40.1
25.5
31.2
15.7
61.1
12.2
15.4
11.0
10.3
19.6
9.3
10.8
10.4
12.4
10.8
27.2
95.7
16.6
25.7
18.0
39.4
23.0
9.9
61.1
17.9
35.7
17.4
18.7
33.3
45.7
25.1
39.7
20.0
29.0
15.3
43.6
9.2
14.5
9.3
1.2
1.0
0.9
1.3
1.8
1.4
2.0
2.7
21.4
1.3
15.4
3.9
4.3
5.3
1.5
9.1
4.2
3.0
4.3
2.7
3.3
4.8
5.5
2.4
3.4
3.7
1.7
9.9
1.1
3.7
8.5
1.1
1.0
0.8
1.2
1.6
1.2
1.9
2.5
17.5
1.1
14.6
3.5
4.1
5.1
1.3
8.2
3.8
2.9
3.8
2.1
2.6
4.3
4.7
2.3
3.0
3.4
1.6
8.1
1.0
3.1
36.5
9.2
4.6
8.5
10.8
16.3
10.7
15.3
8.9
18.9
7.6
69.1
22.1
11.9
41.3
14.0
13.4
20.9
7.9
17.4
7.8
9.6
18.8
20.7
7.5
13.7
12.3
24.9
17.6
9.2
26.9
77.8
10.9
5.1
9.1
11.7
16.3
10.2
17.3
9.6
20.1
6.3
58.3
20.4
10.8
22.4
14.3
14.1
22.2
8.4
22.9
12.6
8.7
12.4
20.4
5.8
15.8
12.3
11.0
20.4
11.5
23.4
399
1599
737
159
421
271
970
74
1570
638
821
137
457
609
1051
771
3119
2053
221
758
2630
64
680
454
1117
950
218
557
301
903
93
1550
741
1000
160
616
757
1100
889
3125
2225
257
957
3500
82
749
14
-30
29
37
32
11
-7
27
-1
16
22
17
35
24
5
15
0
8
16
26
33
28
10
12.7
12.9
43.5 44.3 55.8
7.0
6.2
6.2
22.7 23.4 27.9
5.8
6.9
9.4
58.3 42.1 64.3
6.4
7.4
8.4
22.5 25.7 31.8
32.0 35.7 43.6
21.2 23.0 33.7
5.4
7.9
8.9
12.6 24.5 35.8
15.8 18.3 26.1
21.8 23.0 35.0
26.7 30.7 37.1
77.8 78.6 133.1
80.4 102.6 130.9
7.1
7.6 10.3
48.2 49.7 58.8
43.0 60.4 94.8
5.3
7.0
8.2
44.2 46.7 50.6
30 August 2018
22
 Motilal Oswal Financial Services
MOSL Universe stock performance
Company
Automobiles
Amara Raja
Ashok Ley.
Bajaj Auto
Bharat Forge
Bosch
CEAT
Eicher Mot.
Endurance Tech.
Escorts
Exide Ind
Hero Moto
M&M
Maruti Suzuki
Motherson Sumi
Tata Motors
TVS Motor
Banks - Private
AU Small Fin. Bank
Axis Bank
DCB Bank
Equitas Hold.
Federal Bank
HDFC Bank
ICICI Bank
IndusInd
Kotak Mah. Bk
RBL Bank
South Indian
Yes Bank
Banks - PSU
BOB
BOI
Canara
Indian Bk
PNB
SBI
Union Bk
NBFCs
Aditya Birla Cap
Bajaj Fin.
Capital First
Cholaman.Inv.&Fn
GRUH Fin.
HDFC
HDFC Stand. Life
Indiabulls Hsg
L&T Fin.Holdings
LIC Hsg Fin
M&M Fin.
Muthoot Fin
MAS Financial Serv.
ICICI Pru Life
PNB Housing
Repco Home
1 Day (%)
1.0
-0.2
0.0
1.4
6.4
0.2
-1.8
0.2
-0.5
-0.1
0.2
0.3
-0.6
0.4
0.5
-2.1
2.0
-0.6
-0.3
2.6
1.6
-0.9
0.5
-1.4
0.2
1.0
1.4
-1.4
2.4
4.0
2.9
0.8
1.6
1.5
2.7
-0.6
1.7
2.0
-0.6
3.4
-0.1
1.0
-0.9
1.0
-0.3
1.4
-0.2
0.1
0.5
-1.2
0.3
1M (%)
8.9
17.1
0.4
5.5
7.5
1.8
-2.6
11.9
-3.3
6.1
1.4
7.9
0.5
-2.3
-2.3
6.0
14.9
18.6
4.5
13.8
-10.8
-5.7
16.1
-3.5
-1.8
12.4
-1.7
-1.1
6.7
-2.8
1.2
-7.4
2.7
8.0
3.3
-4.1
10.2
22.1
-1.2
5.3
-4.6
-8.3
-2.6
4.9
-3.0
-6.5
-1.1
7.6
-7.0
3.5
-10.5
12M (%)
12.8
25.9
-1.6
17.8
-7.9
-14.3
-8.5
54.0
47.8
48.1
-18.0
42.5
24.4
2.1
-30.5
-6.2
34.1
30.4
-6.9
-0.9
-24.8
19.0
14.1
16.1
33.4
20.5
-35.4
6.4
5.2
-33.0
-16.3
13.2
-40.3
11.9
-34.7
Company
Shriram City Union
Shriram Trans.
Capital Goods
ABB
Bharat Elec.
BHEL
Blue Star
CG Cons. Elec.
CG Power & Inds Sol.
Cummins
Engineers India
GE T&D
Havells
K E C Intl
L&T
Siemens
Solar Ind
Thermax
Va Tech Wab.
Voltas
Cement
Ambuja Cem.
ACC
Birla Corp.
Dalmia Bharat
Grasim Inds.
India Cem
JK Lakshmi Ce
Ramco Cem
Orient Cem
Prism Johnson
Sagar Cements
Sanghi Inds.
Shree Cem
Ultratech
Consumer
Asian Paints
Britannia
Colgate
Dabur
Emami
Future Consumer
Godrej Cons.
GSK Cons.
HUL
ITC
Jyothy Lab
Marico
Nestle
Page Inds
Parag Milk
Pidilite Ind.
P&G Hygiene
Prabhat Dairy
United Brew
1 Day (%)
0.0
0.7
1.0
-0.2
3.8
-1.5
1.3
0.1
-0.5
1.0
-2.0
-0.3
-0.6
-0.3
-0.2
-2.0
1.1
1.4
-0.1
-1.1
-0.7
-2.5
-3.4
0.2
1.7
0.7
1.5
-0.8
2.3
-1.0
-1.7
0.2
-0.5
-1.1
-1.5
-0.2
-1.6
1.7
8.9
0.1
-0.5
-0.7
0.4
1.0
-0.6
-0.2
-0.2
-1.7
-0.4
-4.4
0.8
0.8
1M (%)
5.1
-4.8
11.6
12.3
13.4
-1.4
2.2
-6.3
14.2
-6.2
-3.2
14.5
-12.4
3.1
4.1
2.9
-9.9
9.7
9.6
3.9
5.2
-1.8
-2.8
4.8
1.8
-2.3
-4.4
-9.3
-1.1
-7.3
-14.1
9.9
6.8
-2.9
5.5
4.4
24.0
-0.7
14.2
10.1
15.2
6.1
3.5
-7.4
2.3
10.0
23.6
0.8
2.2
-9.1
1.5
24.0
12M (%)
-4.9
38.5
-2.3
-31.7
-4.7
-10.3
15.8
-24.4
-13.7
-20.2
-26.0
48.0
-2.8
19.6
-19.4
32.6
15.3
-36.2
20.6
-15.0
-10.2
-20.4
-2.2
-5.0
-29.1
-20.8
1.0
-22.1
5.9
-9.5
-2.4
8.2
12.0
20.8
61.4
5.2
54.4
4.7
10.7
57.7
38.4
47.7
11.6
9.0
18.1
62.8
107.5
22.8
39.1
16.1
15.9
73.3
68.0
-7.7
26.1
36.3
12.9
6.6
-2.1
-21.0
17.6
-9.8
-9.9
-12.9
-13.6
30 August 2018
23
 Motilal Oswal Financial Services
MOSL Universe stock performance
Company
United Spirits
Healthcare
Alembic Phar
Alkem Lab
Ajanta Pharma
Aurobindo
Biocon
Cadila
Cipla
Divis Lab
Dr Reddy’s
Fortis Health
Glenmark
Granules
GSK Pharma
IPCA Labs
Jubilant Life
Lupin
Laurus Labs
Sanofi India
Shilpa Medicare
Strides Shasun
Sun Pharma
Torrent Pharma
Infrastructure
Ashoka Buildcon
IRB Infra.Devl.
KNR Construct.
Sadbhav Engg.
Logistics
Allcargo Logistics
Concor
Media
Dish TV
D B Corp
Ent.Network
Hathway Cab.
Hind. Media
HT Media
Jagran Prak.
Music Broadcast
PVR
Sun TV
Zee Ent.
Metals
Hindalco
Hind. Zinc
JSPL
JSW Steel
Nalco
NMDC
Rain Industries
SAIL
Vedanta
Tata Steel
1 Day (%)
1.4
-0.1
2.5
-0.1
0.7
-0.2
-2.4
-0.8
-0.3
-1.3
-0.8
0.3
-1.8
-0.6
0.3
-0.6
-1.6
-0.4
-2.7
-4.9
0.4
-0.1
-0.2
-0.3
-0.5
1.2
2.1
-0.1
1.5
-1.2
-1.0
0.1
8.9
0.7
-0.3
1.0
-1.4
2.3
-0.7
-0.9
-0.8
-0.8
4.2
9.0
2.5
0.0
-5.0
2.8
-1.1
0.8
1M (%)
7.6
4.4
0.2
12.6
16.8
4.7
3.7
1.5
15.9
14.6
8.8
12.5
10.7
5.4
1.8
-9.3
8.8
-2.4
7.4
28.0
33.3
11.4
19.1
-7.7
-4.7
0.3
2.1
0.8
-1.3
5.4
-7.5
-2.2
15.9
-10.8
-1.9
-2.9
8.5
22.2
-0.9
-2.5
10.9
9.3
6.9
23.5
22.8
4.5
-3.0
6.2
3.7
8.1
12M (%)
25.0
16.8
20.8
2.9
-5.6
79.9
-22.3
13.3
85.9
16.7
3.2
4.9
-11.1
37.5
83.7
3.0
-10.2
-13.3
57.4
-17.2
-45.4
29.0
45.5
10.6
-8.2
12.1
1.8
-29.2
1.8
-10.7
-38.0
-15.3
-42.1
-39.4
-40.7
-27.7
-10.3
7.7
9.6
-2.4
4.0
5.3
65.4
61.5
13.0
-10.8
39.7
31.0
-23.6
0.0
Company
Oil & Gas
Aegis Logistics
BPCL
GAIL
Gujarat Gas
Gujarat St. Pet.
HPCL
IOC
IGL
Mahanagar Gas
MRPL
Oil India
ONGC
PLNG
Reliance Ind.
Retail
Jubilant Food
Titan Co.
Technology
Cyient
HCL Tech.
Hexaware
Infosys
KPIT Tech
Mindtree
Mphasis
NIIT Tech
Persistent Sys
Tata Elxsi
TCS
Tech Mah
Wipro
Zensar Tech
Telecom
Bharti Airtel
Bharti Infratel
Idea Cellular
Tata Comm
Utiltites
Coal India
CESC
JSW Energy
NHPC Ltd
NTPC
Power Grid
Tata Power
Others
Arvind
Avenue Super.
BSE
Castrol India
Coromandel Intl
Delta Corp
Interglobe
Indo Count
1 Day (%)
-1.3
0.8
0.8
0.3
0.3
0.3
0.6
2.2
0.5
-1.8
0.8
1.6
0.6
-1.8
-0.6
-0.7
0.1
-0.7
2.8
-1.0
0.3
-0.3
0.1
-0.9
-1.2
-1.4
0.0
-0.2
0.4
0.3
-0.4
-1.0
-3.3
0.4
-2.6
-0.1
0.4
0.4
-1.3
-1.6
2.9
0.2
0.5
-1.2
1.0
-0.6
2.4
-5.5
-4.4
1M (%)
-2.9
-9.0
-2.9
0.2
-6.2
-9.4
-5.2
-2.3
-5.9
-0.1
-0.7
9.9
0.6
14.6
9.6
-0.2
1.3
7.2
-5.8
2.6
-1.4
10.4
11.4
6.0
0.4
-3.6
6.3
13.8
8.2
27.5
2.9
-1.8
-12.2
-3.1
9.6
4.1
2.6
5.0
7.3
7.9
7.0
-6.4
2.0
-8.3
-8.3
5.1
13.9
-3.7
-9.4
12M (%)
21.6
-28.4
29.3
-0.9
-4.4
-44.9
-28.0
16.0
-17.3
-36.1
8.6
12.8
4.6
69.0
130.5
46.6
36.3
21.3
59.2
52.1
153.8
119.9
104.9
167.0
35.1
70.0
66.9
70.1
2.1
100.6
-12.5
-25.4
-43.4
-15.1
20.5
-1.1
5.0
-13.1
-1.5
-10.2
-0.1
10.9
55.0
-24.8
-17.1
-3.4
46.5
-17.4
-34.6
30 August 2018
24
 Motilal Oswal Financial Services
MOSL Universe stock performance
Company
Info Edge
Kaveri Seed
MCX
Navneet Educat.
Oberoi Realty
Phoenix Mills
PI Inds.
Piramal Enterp.
Quess Corp
SRF
S H Kelkar
Tata Chemicals
Team Lease Serv.
Trident
UPL
1 Day (%)
1.4
-0.2
-1.3
0.3
-0.8
0.2
-0.7
0.5
-1.7
5.2
-0.7
1.4
-0.3
2.9
3.9
1M (%)
11.9
5.1
-0.9
23.4
-5.0
-3.0
-4.7
17.3
-1.7
22.0
11.4
11.6
-1.3
16.1
6.9
12M (%)
69.6
18.0
-22.5
-15.3
23.5
15.8
7.8
18.0
25.9
40.4
-8.9
29.3
77.7
-31.6
-19.1
30 August 2018
25
 Motilal Oswal Financial Services
NOTES
30 August 2018
26
 Motilal Oswal Financial Services
THEMATIC/STRATEGY RESEARCH GALLERY
 Motilal Oswal Financial Services
REPORT GALLERY
RECENT INITIATING COVERAGE REPORTS
.
Rs
 Motilal Oswal Financial Services
DIFFERENTIATED PRODUCT GALLERY
 Motilal Oswal Financial Services
Explanation of Investment Rating
Investment Rating
BUY
SELL
NEUTRAL
UNDER REVIEW
NOT RATED
Expected return (over 12-month)
>=15%
< - 10%
> - 10 % to 15%
Rating may undergo a change
We have forward looking estimates for the stock but we refrain from assigning recommendation
*In case the recommendation given by the Research Analyst becomes inconsistent with the investment rating legend, the Research Analyst shall within 28 days of the inconsistency, take appropriate measures to make the recommendation consistent with the investment rating legend.
Disclosures:
The following Disclosures are being made in compliance with the SEBI Research Analyst Regulations 2014 (herein after referred to as the Regulations).
Motilal Oswal Securities Ltd. (MOSL*
)
is a SEBI Registered Research Analyst having registration no. INH000000412. MOSL, the Research Entity (RE) as defined in the Regulations, is engaged in the business of providing Stock broking services,
Investment Advisory Services, Depository participant services & distribution of various financial products. MOSL is a subsidiary company of Motilal Oswal Financial Service Ltd. (MOFSL). MOFSL is a listed public company, the details in respect of
which are available on
www.motilaloswal.com.
MOSL is registered with the Securities & Exchange Board of India (SEBI) and is a registered Trading Member with National Stock Exchange of India Ltd. (NSE) and BSE Limited (BSE), Multi
Commodity Exchange of India (MCX) & National Commodity & Derivatives Exchange Ltd. (NCDEX) for its stock broking activities & is Depository participant with Central Depository Services Limited (CDSL) & National Securities Depository Limited
(NSDL) and is member of Association of Mutual Funds of India (AMFI) for distribution of financial products. Details of associate entities of Motilal Oswal Securities Limited are available on the website at
http://onlinereports.motilaloswal.com/Dormant/documents/Associate%20Details.pdf
MOSL, it’s associates, Research Analyst or their relative may have any financial interest in the subject company. MOSL and/or its associates and/or Research Analyst may have actual/beneficial ownership of 1% or more securities in the subject
company at the end of the month immediately preceding the date of publication of the Research Report.
MOSL and its associate company(ies), their directors and Research Analyst and their relatives may; (a) from time to time, have a long or short
position in, act as principal in, and buy or sell the securities or derivatives thereof of companies mentioned herein. (b) be engaged in any other transaction involving such securities and earn brokerage or other compensation or act as a market maker
in the financial instruments of the company(ies) discussed herein or act as an advisor or lender/borrower to such company(ies) or may have any other potential conflict of interests with respect to any recommendation and other related information and
opinions.; however the same shall have no bearing whatsoever on the specific recommendations made by the analyst(s), as the recommendations made by the analyst(s) are completely independent of the views of the associates of MOSL even
though there might exist an inherent conflict of interest in some of the stocks mentioned in the research report.
Research Analyst may have served as director/officer, etc. in the subject company in the last 12 month period. MOSL and/or its
associates may have received any compensation from the subject company in the past 12 months.
In the last 12 months period ending on the last day of the month immediately preceding the date of publication of this research report, MOSL or any of its associates may have:
a)
managed or co-managed public offering of securities from subject company of this research report,
b)
received compensation for investment banking or merchant banking or brokerage services from subject company of this research report,
c)
received compensation for products or services other than investment banking or merchant banking or brokerage services from the subject company of this research report.
d)
Subject Company may have been a client of MOSL or its associates during twelve months preceding the date of distribution of the research report.
MOSL and it’s associates have not received any compensation or other benefits from the subject company or third party in connection with the research report. To enhance transparency, MOSL has incorporated a Disclosure of Interest Statement in
this document. This should, however, not be treated as endorsement of the views expressed in the report. MOSL and / or its affiliates do and seek to do business including investment banking with companies covered in its research reports. As a
result, the recipients of this report should be aware that MOSL may have a potential conflict of interest that may affect the objectivity of this report. Compensation of Research Analysts is not based on any specific merchant banking, investment
banking or brokerage service transactions.
Terms & Conditions:
This report has been prepared by MOSL and is meant for sole use by the recipient and not for circulation. The report and information contained herein is strictly confidential and may not be altered in any way, transmitted to, copied or distributed, in
part or in whole, to any other person or to the media or reproduced in any form, without prior written consent of MOSL. The report is based on the facts, figures and information that are considered true, correct, reliable and accurate. The intent of this
report is not recommendatory in nature. The information is obtained from publicly available media or other sources believed to be reliable. Such information has not been independently verified and no guaranty, representation of warranty, express or
implied, is made as to its accuracy, completeness or correctness. All such information and opinions are subject to change without notice. The report is prepared solely for informational purpose and does not constitute an offer document or solicitation
of offer to buy or sell or subscribe for securities or other financial instruments for the clients. Though disseminated to all the customers simultaneously, not all customers may receive this report at the same time. MOSL will not treat recipients as
customers by virtue of their receiving this report.
Analyst Certification
The views expressed in this research report accurately reflect the personal views of the analyst(s) about the subject securities or issues, and no part of the compensation of the research analyst(s) was, is, or will be directly or indirectly related to the
specific recommendations and views expressed by research analyst(s) in this report.
Disclosure of Interest Statement
Analyst ownership of the stock
Companies where there is interest
No
A graph of daily closing prices of securities is available at
www.nseindia.com, www.bseindia.com.
Research Analyst views on Subject Company may vary based on Fundamental research and Technical Research. Proprietary trading desk of MOSL or
its associates maintains arm’s length distance with Research Team as all the activities are segregated from MOSL research activity and therefore it can have an independent view with regards to subject company for which Research Team have
expressed their views.
Regional Disclosures (outside India)
This report is not directed or intended for distribution to or use by any person or entity resident in a state, country or any jurisdiction, where such distribution, publication, availability or use would be contrary to law, regulation or which would subject
MOSL & its group companies to registration or licensing requirements within such jurisdictions.
For Hong Kong:
This report is distributed in Hong Kong by Motilal Oswal capital Markets (Hong Kong) Private Limited, a licensed corporation (CE AYY-301) licensed and regulated by the Hong Kong Securities and Futures Commission (SFC) pursuant to the
Securities and Futures Ordinance (Chapter 571 of the Laws of Hong Kong) “SFO”. As per SEBI (Research Analyst Regulations) 2014 Motilal Oswal Securities (SEBI Reg No. INH000000412) has an agreement with Motilal Oswal capital Markets
(Hong Kong) Private Limited for distribution of research report in Hong Kong. This report is intended for distribution only to “Professional Investors” as defined in Part I of Schedule 1 to SFO. Any investment or investment activity to which this
document relates is only available to professional investor and will be engaged only with professional investors.” Nothing here is an offer or solicitation of these securities, products and services in any jurisdiction where their offer or sale is not
qualified or exempt from registration. The Indian Analyst(s) who compile this report is/are not located in Hong Kong & are not conducting Research Analysis in Hong Kong.
For U.S.
Motilal Oswal Securities Limited (MOSL) is not a registered broker - dealer under the U.S. Securities Exchange Act of 1934, as amended (the"1934 act") and under applicable state laws in the United States. In addition MOSL is not a registered
investment adviser under the U.S. Investment Advisers Act of 1940, as amended (the "Advisers Act" and together with the 1934 Act, the "Acts), and under applicable state laws in the United States. Accordingly, in the absence of specific exemption
under the Acts, any brokerage and investment services provided by MOSL, including the products and services described herein are not available to or intended for U.S. persons. This report is intended for distribution only to "Major Institutional
Investors" as defined by Rule 15a-6(b)(4) of the Exchange Act and interpretations thereof by SEC (henceforth referred to as "major institutional investors"). This document must not be acted on or relied on by persons who are not major institutional
investors. Any investment or investment activity to which this document relates is only available to major institutional investors and will be engaged in only with major institutional investors. In reliance on the exemption from registration provided by
Rule 15a-6 of the U.S. Securities Exchange Act of 1934, as amended (the "Exchange Act") and interpretations thereof by the U.S. Securities and Exchange Commission ("SEC") in order to conduct business with Institutional Investors based in the
U.S., MOSL has entered into a chaperoning agreement with a U.S. registered broker-dealer, Motilal Oswal Securities International Private Limited. ("MOSIPL"). Any business interaction pursuant to this report will have to be executed within the
provisions of this chaperoning agreement.
The Research Analysts contributing to the report may not be registered /qualified as research analyst with FINRA. Such research analyst may not be associated persons of the U.S. registered broker-dealer, MOSIPL, and therefore, may not be
subject to NASD rule 2711 and NYSE Rule 472 restrictions on communication with a subject company, public appearances and trading securities held by a research analyst account.
For Singapore
In Singapore, this report is being distributed by Motilal Oswal Capital Markets Singapore Pte Ltd (“MOCMSPL”) (Co.Reg. NO. 201129401Z) which is a holder of a capital markets services license and an exempt financial adviser in Singapore,
as per the approved agreement under Paragraph 9 of Third Schedule of Securities and Futures Act (CAP 289) and Paragraph 11 of First Schedule of Financial Advisors Act (CAP 110) provided to MOCMSPL by Monetary Authority of Singapore.
Persons in Singapore should contact MOCMSPL in respect of any matter arising from, or in connection with this report/publication/communication. This report is distributed solely to persons who qualify as “Institutional Investors”, of which some of
whom may consist of "accredited" institutional investors as defined in section 4A(1) of the Securities and Futures Act, Chapter 289 of Singapore (“the SFA”). Accordingly, if a Singapore person is not or ceases to be such an institutional investor, such
Singapore Person must immediately discontinue any use of this Report and inform MOCMSPL.
Disclaimer:
The report and information contained herein is strictly confidential and meant solely for the selected recipient and may not be altered in any way, transmitted to, copied or distributed, in part or in whole, to any other person or to the media or
reproduced in any form, without prior written consent. This report and information herein is solely for informational purpose and may not be used or considered as an offer document or solicitation of offer to buy or sell or subscribe for securities or
other financial instruments. Nothing in this report constitutes investment, legal, accounting and tax advice or a representation that any investment or strategy is suitable or appropriate to your specific circumstances. The securities discussed and
opinions expressed in this report may not be suitable for all investors, who must make their own investment decisions, based on their own investment objectives, financial positions and needs of specific recipient. This may not be taken in substitution
for the exercise of independent judgment by any recipient. Each recipient of this document should make such investigations as it deems necessary to arrive at an independent evaluation of an investment in the securities of companies referred to in
this document (including the merits and risks involved), and should consult its own advisors to determine the merits and risks of such an investment. The investment discussed or views expressed may not be suitable for all investors. Certain
transactions -including those involving futures, options, another derivative products as well as non-investment grade securities - involve substantial risk and are not suitable for all investors. No representation or warranty, express or implied, is made
as to the accuracy, completeness or fairness of the information and opinions contained in this document. The Disclosures of Interest Statement incorporated in this document is provided solely to enhance the transparency and should not be treated
as endorsement of the views expressed in the report. This information is subject to change without any prior notice. The Company reserves the right to make modifications and alternations to this statement as may be required from time to time
without any prior approval. MOSL, its associates, their directors and the employees may from time to time, effect or have effected an own account transaction in, or deal as principal or agent in or for the securities mentioned in this document. They
may perform or seek to perform investment banking or other services for, or solicit investment banking or other business from, any company referred to in this report. Each of these entities functions as a separate, distinct and independent of each
other. The recipient should take this into account before interpreting the document. This report has been prepared on the basis of information that is already available in publicly accessible media or developed through analysis of MOSL. The views
expressed are those of the analyst, and the Company may or may not subscribe to all the views expressed therein. This document is being supplied to you solely for your information and may not be reproduced, redistributed or passed on, directly or
indirectly, to any other person or published, copied, in whole or in part, for any purpose. This report is not directed or intended for distribution to, or use by, any person or entity who is a citizen or resident of or located in any locality, state, country or
other jurisdiction, where such distribution, publication, availability or use would be contrary to law, regulation or which would subject MOSL to any registration or licensing requirement within such jurisdiction. The securities described herein may or
may not be eligible for sale in all jurisdictions or to certain category of investors. Persons in whose possession this document may come are required to inform themselves of and to observe such restriction. Neither the Firm, not its directors,
employees, agents or representatives shall be liable for any damages whether direct or indirect, incidental, special or consequential including lost revenue or lost profits that may arise from or in connection with the use of the information.
The person
accessing this information specifically agrees to exempt MOSL or any of its affiliates or employees from, any and all responsibility/liability arising from such misuse and agrees not to hold MOSL or any of its affiliates or employees responsible for any
such misuse and further agrees to hold MOSL or any of its affiliates or employees free and harmless from all losses, costs, damages, expenses that may be suffered by the person accessing this information due to any errors and delays.
Registered Office Address: Motilal Oswal Tower, Rahimtullah Sayani Road, Opposite Parel ST Depot, Prabhadevi, Mumbai-400025; Tel No.: 022-3980 4263; www.motilaloswal.com. Correspondence Address: Palm Spring Centre, 2nd Floor, Palm
Court Complex, New Link Road, Malad (West), Mumbai- 400 064. Tel No: 022 3080 1000. Compliance Officer: Neeraj Agarwal, Email Id:
na@motilaloswal.com,
Contact No.:022-30801085.
Registration details of group entities: MOSL: SEBI Registration: INZ000158836 (BSE/NSE/MCX/NCDEX); CDSL: IN-DP-16-2015; NSDL: IN-DP-NSDL-152-2000; Research Analyst: INH000000412. AMFI: ARN 17397. Investment Adviser:
INA000007100. Motilal Oswal Asset Management Company Ltd. (MOAMC): PMS (Registration No.: INP000000670) offers PMS and Mutual Funds products. Motilal Oswal Wealth Management Ltd. (MOWML): PMS (Registration No.: INP000004409)
offers wealth management solutions. *Motilal Oswal Securities Ltd. is a distributor of Mutual Funds, PMS, Fixed Deposit, Bond, NCDs, Insurance and IPO products. * Motilal Oswal Commodities Broker Pvt. Ltd. offers Commodities Products. * Motilal
Oswal Real Estate Investment Advisors II Pvt. Ltd. offers Real Estate products. * Motilal Oswal Private Equity Investment Advisors Pvt. Ltd. offers Private Equity products
*MOSL
has been amalgamated with Motilal Oswal Financial Services Limited (MOFSL) w.e.f August 21, 2018 pursuant to order dated July 30, 2018 issued by Hon'ble National Company Law Tribunal, Mumbai Bench. The existing registration no(s) of
MOSL would be used until receipt of new MOFSL registration numbers.
30 August 2018
27