10 September 2018
Market snapshot
Equities - India
Sensex
Nifty-50
Nifty-M 100
Equities-Global
S&P 500
Nasdaq
FTSE 100
DAX
Hang Seng
Nikkei 225
Commodities
Brent (US$/Bbl)
Gold ($/OZ)
Cu (US$/MT)
Almn (US$/MT)
Currency
USD/INR
USD/EUR
USD/JPY
YIELD (%)
10 Yrs G-Sec
10 Yrs AAA Corp
Flows (USD b)
FIIs
DIIs
Volumes (INRb)
Cash
F&O
Close
38,390
11,589
19,579
Close
2,872
7,903
7,278
11,960
10,560
22,307
Close
77
1,196
5,915
2,031
Close
71.7
1.2
111.0
Close
8.0
8.9
7-Sep
0.01
0.13
7-Sep
405
6,782
Chg .%
0.4
0.5
1.3
Chg .%
-0.2
-0.3
-0.6
0.0
-0.2
-0.8
Chg .%
0.5
-0.3
0.2
1.4
Chg .%
-0.3
-0.6
0.2
1MChg
-0.34
-0.02
MTD
0.3
0.3
MTD*
374
9,959
YTD.%
12.7
10.1
-7.4
YTD.%
7.4
14.5
-5.3
-7.4
-9.8
-2.0
YTD.%
14.8
-8.2
-17.9
-10.0
YTD.%
12.3
-3.8
-1.5
YTDchg
0.7
1.0
YTD
-0.4
10.6
YTD*
359
8,582
Today’s top research idea
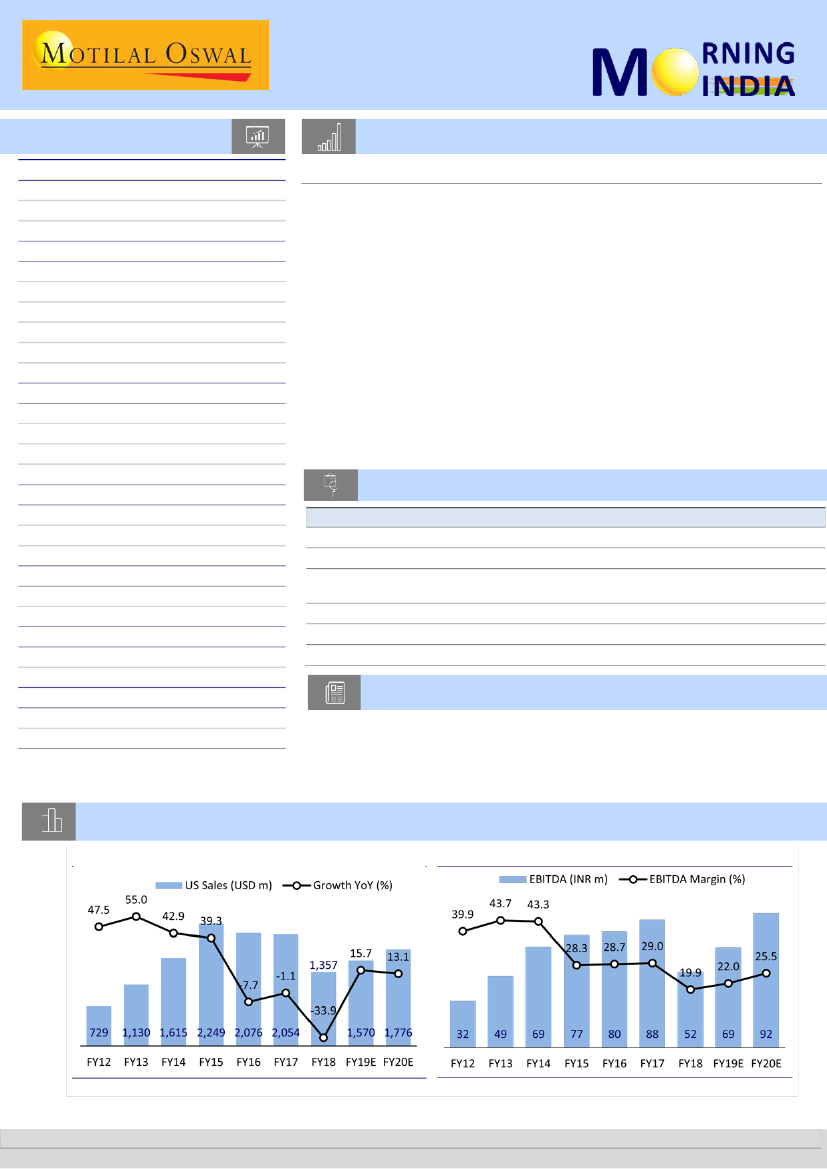
Sun Pharma: Recent Halol 483 - Not a show stopper
US FDA recently conducted an inspection at SUNP's Halol plant from 27-31
August and issued Form-483 with six observations. We believe the observations
are resolvable and should not impact existing business and/or new approvals,
pertaining to SUNP.
We raise EPS estimate by 1%/3% for FY19/FY20 to factor in the favorable
currency movement. We expect a premium for SUNP to further expand from
25% to 35%, compared to an industry average of 20x 12M forward earnings on
the back of increasing share of specialty portfolio. SUNP is the only Indian-listed
entity, which is progressing well in the specialty portfolio.
We believe, the incremental generics business from new launches, which
should be higher than base business erosion, increased traction in specialty
products and sustained outperformance in the domestic formulation business
should drive growth. Accordingly, we revise our target price to INR790 (from
INR700 earlier).
Research covered
Cos/Sector
Axis Bank
Sun Pharma
NCLT & Insolvency
Day
Lupin – (ART)
EcoScope
Economy
Key Highlights
RBI approves appointment of new MD & CEO
Recent Halol 483 - Not a show stopper
Stressed assets outlook from India’s key ARCs and resolution experts
Besides competitive intensity, acquired businesses drag profitability
1QFY19 CAD below expectations
Monsoon deficit at 7%, kharif sowing 0.2% higher YoY
Piping hot news
A Securities and Exchange Board of India (Sebi)-appointed experts group on
Saturday made a slew of recommendations which are likely to soothe the nerve of
foreign portfolio investors (FPIs)…
Sebi panel eases deal for FPIs, allows NRIs to hold 25% in offshore funds
Note: YTD is calendar year, *Avg
Chart of the Day: Sun Pharma— Recent Halol 483 - Not a show stopper
US sales to improve FY19 onwards
Margins to gradually improve
Source: Company, MOSL
Research Team (Gautam.Duggad@MotilalOswal.com)
Motilal Oswal research is available on www.motilaloswal.com/Institutional-Equities, Bloomberg, Thomson Reuters, Factset and S&P Capital.
Investors are advised to refer through important disclosures made at the last page of the Research Report.
 Motilal Oswal Financial Services
In the news today
Kindly click on textbox for the detailed news link
1
Sebi panel eases deal for FPIs,
allows NRIs to hold 25% in
offshore funds
A Securities and Exchange Board
of India (Sebi)-appointed experts
group on Saturday made a slew of
recommendations which are likely
to soothe the nerve of foreign
portfolio investors (FPIs)…
2
FPIs turn net sellers in Sept, pull out Rs 5,600 crore
Foreign investors have pulled out a massive Rs 5,600 crore from the
Indian capital markets in the last five trading sessions, after putting in
money during the previous two months, on unabated fall in rupee and
rise in crude oil prices. The latest outflow comes following a net
infusion of close to Rs 5,200 crore in the capital markets, both equity
and debt, last month and Rs 2,300 crore in August. Prior to that,
overseas investors had pulled out over Rs 61,000 crore during April-
June…
3
Two decades after it bought
Parle’s beverage brands,
including Thums Up, and
returned to India, Coca-Cola is
poised for its second big
acquisition here. The world’s
largest beverage company has
emerged as the frontrunner to
buy the consumer brand portfolio
of Kraft Heinz — which includes
children’s milk drink Complan,…
4
Amitabh Chaudhry of HDFC
Life appointed CEO & MD of
Axis Bank
Ending the speculation around the
appointment of its next head once
Shikha Sharma demits office, Axis
Bank today chose Amitabh
Chaudhry, 54, as the next CEO.
Chaudhry, who is currently the
managing director of HDFC Life was
widely speculated to take over as
the next boss at Axis…
After tax googly, Complan
may end up in Coke bottle
5
Congress, TDP set for poll
alliance in Telangana
The dissolution of the Telangana
assembly has triggered an
unlikely alliance in the state, with
the Congress set to tie up with
one-time rival Telugu Desam
Party (TDP). Last week’s decision
by Telangana's ruling Telangana
Rashtra Samithi (TRS) to call for
snap elections hastened the
alliance which will be formalized
this week, senior party leaders
said. The alliance will be effective
for the assembly and Lok Sabha
elections. The TDP was founded
in 1982 as an anti-Congress force,
but a new common enemy in the
ruling TRS seems to have bridged
the gap between the two. K.
Chandrashekar Rao, currently
caretaker chief minister,…
6
JNPT seen buying Air India
building for ₹ 2,000 crore by
year-end
Air India Ltd expects to sell its
former head office in Mumbai for
an estimated
₹ 2,000
crore by the
end of March to state-run
Jawaharlal Nehru Port Trust
(JNPT), said a senior airline official.
Both JNPT and Air India are
carrying out their individual
valuations of the iconic Air India
building at Mumbai’s Nariman
Point, the Air India official,…
10 September 2018
7
Arohan Financial to raise ₹ 350
crore, plans IPO in 12-15
months
Arohan Financial Services Ltd, the
Kolkata-based microfinance
company, will raise around ₹ 350
crore from its promoters and
existing investors to strengthen
its presence in east and north
India, a top company official said.
The micro financier is also looking
to launch its initial public offering
(IPO) in the next 12-15 months…
2
 Motilal Oswal Financial Services
9 September 2018
Update | Sector: Financials
Axis Bank
BUY
BSE SENSEX
38,390
S&P CNX
11,589
CMP: INR645
TP: INR750 (+16%)
RBI approves appointment of new MD & CEO
Building blocks falling in place to further strengthen recovery
Stock Info
Bloomberg
Equity Shares (m)
M.Cap.(INRb)/(USDb)
52-Week Range (INR)
1, 6, 12 Rel. Per (%)
12M Avg Val (INR M)
Free float (%)
AXSB IN
2,568
1657.1 / 23.1
671 / 448
7/12/9
4640
74.9
RBI approves appointment of Mr. Amitabh Chaudhry as MD & CEO of Axis Bank for a
period of 3 years with effect from 1-Jan-19 up to 31-Dec-21. Mr. Chaudhry’s term will
thus begin after Ms. Shikha Sharma, the current CEO demits office on 31-Dec-18. It’s
going to be a second consecutive time that Axis Bank’s MD & CEO will come from a life
insurance company.
Brief profile of Mr. Amitabh Chaudhry
Mr. Amitabh Chaudhry has been the MD & CEO of HDFC Standard Life since Jan-
10. Mr. Chaudhry started his career in corporate banking with Bank of America in
1987, where he worked in diverse roles ranging from Country Finance Officer,
Head of Wholesale and thereafter as MD and Head Technology - Investment
Banking, Asia. Mr. Chaudhry was also associated with CLSA as its MD, Head South
East Asian Investment Banking and Head Technology Investment Banking. Prior to
joining HDFC Life, Mr. Chaudhry worked as MD & CEO at Infosys BPO Ltd. Mr.
Chaudhry is a B. Tech (Electronic & Electricals) from BITS-Pilani and is an alumnus
of IIM-Ahmedabad.
Financials Snapshot (INR b)
Y/E March
FY19E FY20E FY21E
NII
OP
NP
NIM (%)
EPS (INR)
EPS Gr. (%)
BV/Sh. (INR)
ABV/Sh. (INR)
RoE (%)
RoA (%)
Valuations
P/E(X)
P/BV (X)
P/ABV (X)
208.3
175.5
51.9
3.0
20.1
1,704.6
267.7
222.4
7.8
0.68
32.2
2.4
2.9
243.5
216.9
93.9
2.9
35.9
79.2
299.1
263.1
12.7
1.04
18.0
2.2
2.5
294.7
277.5
127.4
3.0
48.8
35.8
342.1
312.7
15.2
1.20
13.2
1.9
2.1
AXSB will have the youngest CEO amongst all new private banks; rich
business/technology experience will help boost growth/productivity
levels
Post this management change AXSB will have the youngest CEO in Mr. Amitabh
Chaudhry, age 54 years, amongst all new private banks - though several banks are
going to see a change in top management over next two years. Mr. Chaudhry also
has a vast experience on the technology front which will come in handy as bank
further builds upon its digital capabilities and thus boost growth/productivity
levels.
Shareholding pattern (%)
As On
Jun-18 Mar-18 Jun-17
DII
25.1
26.4
28.7
FII
14.1
12.8
8.7
Others
52.3
52.2
52.4
FII Includes depository receipts
Stock Performance (1-year)
Axis Bank
Sensex - Rebased
680
610
540
470
400
RBI’s approval removes a big overhang; building blocks falling in place to
further strengthen recovery
RBI approval has ended months of speculation on the top management change at
Axis Bank – particularly after the Axis Bank board submitted three names to RBI in
Jul-18. We believe that after three painful years, things are now falling in place and
we expect earnings momentum to accelerate over FY18-21E. The net stressed
asset for the bank has declined to 6.7% while bank has already improved its
coverage ratio to 69% (including technical W.off) and guided for a normalization in
credit cost during 2HFY19E.
10 September 2018
3
 Motilal Oswal Financial Services
Don’t see any disruption at HDFC Life
HDFC life has reported robust performance under the leadership of Mr. Amitabh
Chaudhary who has been the MD & CEO of the company since Jan-10. During FY14-
18, HDFC Life reported ~30% CAGR growth in new business premiums (unwtd) while
its market share on un-weighted basis increased to 19.1% (as on FY18) amongst
private players thus making it the largest private insurer (13.2% as per wrp basis).
While HDFC Life stock has been in a consolidation phase over past few months post
the spectacular listing in Nov-17, we believe that the company’s growth trajectory
will remain unperturbed. We estimate HDFC Life to deliver 28.2% CAGR in earnings
over FY18-20E while RoEV remains healthy at avg. ~20%. We currently have a BUY
rating on HDFC Life with PT of INR525. We note that recently even ICICI PruLife
witnessed the change in CEO as Mr. Sandeep Bakhshi moved to ICICI Bank as the
COO.
What strategic changes can one look at as new CEO takes charge?
1) There has been few changes in top management at AXSB and as Mr. Chaudhary
assumes office, the focus will be on ensuring management stability and alongside
delivering business growth. 2) The business mix and loan growth strategy may also
see a change as the new management evaluates the risk-adjusted returns across
business segments and look at it in context to long term sustainable growth
ambitions and strengths of the bank. 3) There has been media reports in the past
that AXSB may enter into life insurance and now with Mr. Chaudhary taking charge
as the CEO, with such a proven track record in building the life insurance business,
expectations will naturally be higher about (a) AXSB entering into life insurance
through organic or inorganic route. (b) Alternately, will AXSB look to tie-up with
other life insurers, including HDFC Life! This may seem a little pre-mature at this
stage but will have material implications for Max Life.
Valuation and view
AXSB’s stock has delivered 23% return in past two months in anticipation of this
management change and also aided by the early signs of recovery in NPL cycle. With
management overhang done away with and improving outlook on fresh
slippages/credit cost, we expect earnings to start normalizing 2HFY19 onward. AXSB
has already increased the PCR to 69% (NCLT-1 provisions of 83%), which will further
curb incremental provisioning requirement. We revise our PT to INR750 (SOTP basis)
as we roll forward our valuations even as we keep our target multiple unchanged at
2.5x Sep-20E ABV for standalone bank. Maintain Buy.
10 September 2018
4
 Motilal Oswal Financial Services
Sun Pharma
BSE SENSEX
38,390
S&P CNX
11,589
7 September 2018
Update | Sector: Healthcare
CMP: INR664
TP: INR790 (+19%)
Buy
Recent Halol 483 - Not a show stopper
Stock Info
Bloomberg
Equity Shares (m)
M.Cap.(INRb)/(USDb)
52-Week Range (INR)
1, 6, 12 Rel. Per (%)
12M Avg Val (INR M)
Free float (%)
SUNP IN
2,399
1593.6 / 22.2
679 / 435
15/16/17
3363
45.6
Financials Snapshot (INR b)
2018 2019E 2020E
Y/E Mar
Net Sales
260.7 311.7 361.6
EBITDA
51.8
68.6
92.2
PAT
32.4
44.8
63.3
EPS (INR)
13.5
18.6
26.3
Gr. (%)
-48.5
38.6
41.2
BV/Sh (INR)
158.4 170.0 189.3
RoE (%)
8.7
11.4
14.6
RoCE (%)
8.1
11.3
15.0
P/E (x)
49.4
35.6
25.2
P/BV (x)
4.2
3.9
3.5
Shareholding pattern (%)
As On
Jun-18 Mar-18 Jun-17
Promoter
54.4
54.4
54.4
DII
16.6
16.2
12.9
FII
16.4
16.3
19.7
Others
12.6
13.1
13.0
FII Includes depository receipts
Stock Performance (1-year)
Sun Pharma.Inds.
Sensex - Rebased
680
610
540
470
400
US FDA recently conducted an inspection at SUNP’s Halol plant from 27-31 August
and issued Form-483 with six observations.
We believe the observations are resolvable and should not impact existing business
and/or new approvals, pertaining to SUNP.
We raise EPS estimate by 1%/3% for FY19/FY20 to factor in the favorable currency
movement.
We expect a premium for SUNP to further expand from 25% to 35%, compared to an
industry average of 20x 12M Forward Earnings on the back of increasing share of
specialty portfolio. SUNP is the only Indian-listed entity, which is progressing well in
the specialty portfolio. We believe, the incremental generics business from new
launches should be higher than base business erosion, and sustained
outperformance in the domestic formulation business should also support multiple
re-rating.
Accordingly, we raise our P/E multiple to 27x (from 25x earlier) and revise our price
target to INR790 (from INR700 earlier); reiterate a Buy.
Observations largely procedural in nature:
The US FDA issued Form-483 with
six observations, with respect to the recent US FDA inspection conducted
during 27-31 August 2018. There are three observations related to laboratory
systems, one related to production system and two related to quality system.
The observations at the laboratory system are towards test procedures
designed to assure appropriate standards of identity/quality/strength/purity,
procedures to prevent objectionable micro-organisms in drug products that
are not required to be sterile and non-inclusion of sample size (based on
statistical criteria) in written stability program. The observation at the
production systems are related to line clearances required during intervention
activities performed by production operators. The observation at quality
systems are towards written procedures for cleaning/maintenance of
equipment and procedures for batch trending of critical alarms raised during
production activities. We expect this observation to be non-critical and to
warrant stoppage of existing production or new approvals.
Second consecutive inspection within six months:
This is the second
inspection by the US FDA within a short span of six months at the Halol facility.
Also, given the facility size, this inspection would be the shortest in terms of
the number of days. Post clearance, the company received its first approval
from the plant in five years. Halol is an important facility for SUNP as it would
provide visibility regarding key approvals including Xelpros, Elepsia, Vagifem,
etc. We expect incremental sales of ~USD100-150m from this facility on
annualised basis.
10 September 2018
5
 Motilal Oswal Financial Services
Well-placed to deliver growth in the US market:
SUNP has a portfolio of 10
specialty products, a few are already commercialized. In 1QFY19, it launched
Yoansa. The company has also received an approval for Cequa, expected to be
launched in the coming quarters and Ilumya, to be launched in 2QFY19.
Although, the generic market in the US is expected to remain under pressure,
we expect SUNP’s growth in the US to be higher than the base-business erosion
on the back of new launches, in both generics and in the specialty products
category.
Valuation and view:
We raise EPS estimates by 1%/3% for FY19/FY20 to factor
in the favorable currency movement. We also raise our P/E multiple to 27x from
25x 12M Forward Earnings as we expect a premium to industry average for
SUNP to expand. Incremental generics business from new launches, which
should be higher than base business erosion, increased traction in specialty
products and sustained outperformance in the domestic formulation business
should drive growth. Accordingly, we revise our target price to INR790 (from
INR700 earlier).
10 September 2018
6
 Motilal Oswal Financial Services
Update | 7 September 2018
Sector: Financials
NCLT & Insolvency Day
Stressed assets outlook from India’s key ARCs and
resolution experts
We hosted the ‘Bankruptcy and Insolvency Day’ at our conference, wherein we invited top
management of leading ARCs, a partner from one of the big four consulting firms and a
resolution expert to share their experience and outlook on the overall stressed assets. Key
takeaways:
Stressed assets have ballooned; distressed asset funds to become active as
IBC stabilizes
Mr. R.K. Bansal
(MD and CEO, Edelweiss ARC)
Mr. Pramod Gupta
(Chief Financial Officer, ARCIL)
Policy hurdles (which led to value destruction), commodity super-cycle (which led to
overcapacity) and the overleveraged balance sheets were the key reasons behind
the ballooning of
stressed assets to INR12.3t (13.8% of loans) as of FY18, with the
metals, power and construction sectors contributing the bulk of it.
Prior to the
Insolvency and Bankruptcy Code (IBC), the Government of India (GoI) came up with
various legislations to deal with distressed assets, but the results were not
convincing (for instance, CDR succeeded initially in 2004 because the commodity
cycle had turned positive; however, post 2010, the results were far from
encouraging). The fact that the government and the regulator are on the same page
is encouraging and can make the IBC a success story. Further, as the IBC stabilizes,
stressed asset funds (including overseas funds) are likely to become more active in
the distressed asset space.
IBC – resolutions on track; resolution time still better than other countries
Of the 701 cases that have been admitted to the IBC until Mar-18, the resolution
plan has been approved for 32 cases, while 87 cases have gone for liquidation. The
average time taken for a case to get completed under the IBC is ~234 days, which is
faster in comparison to other countries. Of the 40 cases referred by the RBI (list 1
and list 2), Amtek Auto, Bhushan Steel, Electro Steel and Monnet Ispat are the only
ones to complete the resolution process. Jyoti Structures and Lanco Infratech have
been entered into liquidation as per an order from the NCLT after its resolution
process failed. However, only Bhushan Steel and Electro Steel have received the
final payment so far.
Mr. Sumit Khanna
(Partner, Corporate Finance &
Restructuring services, Deloitte)
Power assets to face higher haircuts; gas-based and under-construction
projects are at most risk
Power exposure can be divided into four key categories:
Fixed tariff
– better prospects with haircut of ~30%
Project is complete but no/partial PPAs –
Parivartan scheme is launched for its
revival; expected haircut of ~50%
Gas-based –
not much demand with expected haircut of ~80%-90%
Project is not complete –
no buyer; to be treated as scrap with a loss of ~90%-
100%.
Mr. Dhaivat Anjaria
(Resolution Expert)
10 September 2018
7
 Motilal Oswal Financial Services
IBC’s effectiveness likely to improve; expect 70-75% haircut for NCLT-2
Initially though we have seen appeals being made in many of the cases which led to
delay in resolution and despite the challenges faced by the RPs, we believe that as
more cases get resolved, the IBC would evolve as an effective tool in resolving
stressed accounts in an accelerated manner. Due to low demand/participation for
the NCLT list-2 accounts (which are dominated by infra/EPC accounts), we expect
haircuts to be higher in the range of 70%-75%, as against the haircuts for NCLT list-1
of ~55%-60%.
ARCs too undergoing an evolution; playground getting shifted to SME/retail
assets
ARCs’ AUM grew from INR413b in June 2015 to ~INR914b in June 2018, implying a
CAGR of 30%. The IBC passed by the government in 2016 has provided a boost to
the ARC sector, while the increase in FDI to 100% from 49% and the 100% pass-
through status provided to trusts set up for the acquisition of stressed assets have
further acted as growth enablers. Improving effectiveness of the NCLT and the
recent regulatory guideline that directs all NPL accounts >INR20b failing to secure a
resolution plan within 180 days to be moved to NCLT have affected ARCs’ business.
ARCs, thus, will play an increasingly important role in dealing with SME/retail assets,
though select larger ARCs have also been acquiring smaller stakes in large stressed
corporate assets.
Activities and challenges faced by the resolution professionals
Government and judiciary have been very proactive and taken the necessary steps
to ensure (a) smooth resolution of stressed assets and (b) stakeholders get the best
value. Although serious efforts are being made for optimal resolution, there are
some practical difficulties being faced by the resolution professionals which pose
certain challenges in the overall functioning. These include:
Taking charge
of cash and documentary backup is the first and the foremost
step undertaken by a resolution professional.
Budgeting –
it is the most important exercise to be undertaken initially in order
to make payments to employees, creditors, etc., when physical assets/plants are
taken over by the RP, as securing interim financing through market has been a
major challenge.
Maintenance
of the plant and the
working capital
attached to it.
Getting all the members together and
reach a consensus
on a decision.
Tracing the audit trail
to check if siphoning of funds has taken place.
10 September 2018
8
 Motilal Oswal Financial Services
10 September 2018
A
nnual
R
eport
T
hreadbare
LUPIN FY18
LPC’s FY18 annual report analysis highlights a weak operating
performance, with EBITDA declining 31% to INR31.5b, primarily due to
continuing pricing pressure in the US market. OCF declined 61% to
INR15.5b, as cash conversion days deteriorated to 218 (FY17: 186 days),
majorly due to rising trade receivables. Further, inorganic growth
continued with the acquisition of Solosec for an upfront cash payout of
~INR3.7b (total consideration: USD124.1m, ~INR8.1b), which led to FCF
post interest declining to INR0.6b (FY17: INR13.6b). Our analysis reveals
that revenue growth from the acquired subsidiaries has been high;
however, their profit contribution has remained muted. Intangibles
assets remained elevated at INR46.5b, 34% of NW. This is despite an
impairment of INR14.6b recognized on acquired intangibles of the Gavis
portfolio. Interestingly, the transfer of IP rights (primarily Gavis) within
the group (from Lupin Atlantis Holdings SA to Lupin Inc) before
impairment led to a reduction in an otherwise high ETR (at 123%) to
57.2% (FY17: 29.9%).
The
ART
of annual report analysis
Rise in working capital
intensity at INR10.2b
(FY17: -INR5.1b) led to a
61% decline in OCF to
INR15.5b
Intra-group asset transfer
(primarily gavis’ IP) led to
tax benefit of INR3.6b
Revenue contribution of acquired businesses
remains strong; however, their profit
contribution remains subdued
Stock Info
Bloomberg
CMP
Equity Shares (m)
M.Cap.(INRb)/(USDb)
52-Week Range (INR)
1, 6, 12 Rel. Per (%)
12M Avg Val (INR M)
Free float (%)
LPC IN
919
452
415.7 / 5.8
1090 / 724
4/5/-26
2083
53.0
Jun-18
47.0
12.1
25.8
15.1
Mar-18
47.0
12.2
25.4
15.4
Jun-17
46.7
9.8
30.9
12.6
Op. performance deteriorates, further drag on impairment
High pricing pressure, intensified competition, volatile industry
conditions and regulatory challenges in the US markets led to a
revenue decline of 10% to INR158b. Further, rising input costs
dragged EBITDA by 31% to INR31.5b with margins declining
600bps to 20%. Impairment charges (at INR14.6b) for the Gavis
portfolio and higher taxes (ETR at 57.2% v/s 29.9% in FY17) led
to a decline in profitability by 90% to INR2.6b.
Rising working capital intensity dents cash flows
Increased investment in working capital at INR10.2b as against
release of INR5.1b in FY17 led to a decline in operating cash
flows post interest declining 61% to INR15.5b (FY17: INR39.6b).
Trade receivables increased by 21% to INR51.9b (despite a
decline in revenue) leading to an increase in receivable days to
120 days (FY17: 90 days). Cash conversion cycle in turn
increased to 218 days from 186 days in FY17. Net debt increased
by INR4.2b to INR58.3b.
Acquisitions boost revenue, profitability remains muted
LPC has made ~15 acquisitions over FY08-18. The revenue
contribution from these acquisitions has been strong; however,
their profitability contribution continues to be weak. These
acquisitions have led to significant intangibles (including ITUD and
Goodwill) from INR7.7b in FY14 to INR70.9b in FY18 (52% of NW).
Intra-group transfer of assets aid ETR reduction
LAHSA (Lupin Atlantis Holdings SA) transferred various
Intangible products, primarily comprising portfolio of Gavis’ to
Lupin Inc. for a consideration of USD682m. Lupin Inc, recorded
the intangibles for USD302.3m and wrote of USD379.7m
(~INR24.5b) through net worth. This intra-group transfer has led
to a tax benefit of INR3.6b, thereby aiding to reduce ETR to
57.2% (FY17:29.9%). ETR (excluding this benefit) rose to 123%
due to non-deductibility of expenses (primarily impairment
related in our view).
Shareholding pattern (%)
Promoter
DII
FII
Others
Note: FII Includes depository receipts
Stock Performance (1-year)
Auditor’s name
B S R & Co LLP
Sandeep Ashok Gupta
(S.Gupta@MotilalOswal.com); +91 22 39825544
Mohit Baheti
(Mohit.Baheti@MotilalOswal.com); +91 22 3010 2492
Somil Shah
(Somil.Shah@MotilalOswal.com); +91 22 3312 4975
10 September 2018
9
 Motilal Oswal Financial Services
E
CO
S
COPE
The Economy Observer
7 September 2018
1QFY19 CAD below expectations
Sharp fall in capital inflows leads to reserve drawdown of USD11.3b
India’s current account deficit (CAD) came in at a 5-year high of USD15.8b (2.4% of GDP) in 1QFY19 as against USD15b
(2.5% of GDP) in the year ago quarter. The number is below our/consensus estimate of USD16.7b/USD17.3b. While the
merchandise trade deficit rose in the quarter, it was partially offset by higher invisible earnings.
Capital inflows came in at a 9-quarter low of USD5.2b (0.8% of GDP) in 1QFY19 as against USD26.9b (4.5% of GDP) in
1QFY18, and at an average quarterly level of USD22.8b during FY18. Consequently, India witnessed a drawdown of
USD11.3b from its reserves in 1QFY19 – the largest drawdown in six years.
Total domestic savings (implied from the difference between investments and CAD) declined to 28.6% of GDP in 1QFY19
from 29.1% in 1QFY18. This was the lowest savings rate in any first quarter in at least seven years.
We expect India’s CAD to widen to 2.8% in FY19 from 1.9% in FY18 and slightly higher than our
earlier forecast
of 2.6%.
The revision in our forecast is largely due to a downward revision in the nominal GDP estimate in dollar terms owing to
the rapid depreciation seen in the INR in recent months.
Current account deficit lower than expectations in 1QFY19:
India’s current
account deficit (CAD) came in at a five-year high of USD15.8b in 1QFY19 only
slightly higher than USD15b in the same quarter last year (Exhibit
1).
The
number, however, was lower than our estimate of USD16.7b, as well as market
consensus of USD17.3b for the quarter. As a proportion of GDP, CAD actually
declined slightly to 2.4% from 2.5% in the year ago quarter.
Higher merchandise deficit offset by increase in invisible earnings:
Although,
CAD remained largely stable on a YoY basis, India’s merchandise trade deficit
rose to USD45.7b in 1QFY19 from USD41.9b in the corresponding quarter last
year. This was entirely on account of a surge in the net oil import bill, which
touched a 14-quarter high of USD22.6b (3.2% of GDP) up from USD16.6b (2.7%
of GDP) in the year ago quarter. Invisible earnings rose by 11% YoY to USD29.9b
in 1QFY19, partially offsetting the higher merchandise trade deficit.
Sharp drop in capital inflows leads to drawdown of reserves:
Capital inflows
declined sharply to USD5.2b (0.8% of GDP) from USD26.9b (4.5% of GDP) and an
average of USD22.8b (3.5% of GDP) per quarter during FY18. This was entirely
on the back of large foreign portfolio investment (FPI) outflows, to the extent of
USD8.1b (of which USD6.4b was out of debt securities). While FDI inflows
improved to USD9.7b in 1QFY19 from an average of USD7.6b in the last 4four
quarters, other investment inflows came in lower at USD5.1bvis-à-vis an average
of USD10.5b. This was on account of net repayments of trade credit amounting
to USD3.5b as against inflows in the last four quarters. Capital flows were not
sufficient to fund the CAD, resulting in a drawdown of USD11.3b from India’s
foreign exchange reserves in 1QFY19
(Exhibit 3).
This was the largest drawdown
in six years.
National savings continue to fall:
As per our calculations, (implied) domestic
savings (domestic investments
minus
CAD) declined to 28.6% in 1QFY19 from
29.1% in 1QFY18 (Exhibit 4). This was the lowest savings rate in any first quarter
in at least seven years.
10 September 2018
10
 Motilal Oswal Financial Services
CAD to surge to 2.8% of GDP in FY19:
We expect India’s CAD to widen in the
ensuing quarters, primarily on account of a higher net oil import bill. As a result,
we expect the CAD to rise to 2.8% in FY19 from 1.9% in FY18, and slightly higher
than our
earlier forecast
of 2.6%. The revision in our forecast is largely due to a
downward revision in the nominal GDP estimate in dollar terms owing to the
rapid depreciation seen in the INR in the recent months. Although, this will be
the highest level of the CAD in six years, it will still be lower than the levels seen
during FY12-FY13.
invisible earnings
8
4
0
(% of GDP)
in 1QFY19
2
0
-2
-4
-6
-8
Exhibit 1:
India’s current account deficit at 2.4% of GDP
CAB
CAB excl Gold
Exhibit 2:
Higher merchandise deficit partially offset by
Goods
Services
Income
(% of GDP)
(4)
(8)
Source: Reserve Bank of India (RBI), MOSL
Source: RBI, MOSL
drawdown in 1QFY19
40,000
20,000
0
-20,000
-40,000
(USD mn)
Exhibit 3:
Lower capital flows leads to reserve
Forex reserves*
CAB
Capital account
1QFY19
39
36
33
31
28
25
Exhibit 4:
Implied domestic savings declined to 28.6% in
CAB (RHS)
Savings#
Investments
0.0
-0.8
-1.5
(% of GDP)
(% of GDP)
-2.3
-3.0
* (-) Implies accretion to reserves, (+) implies withdrawal (reduction)
# Implied savings; Does not include ‘errors & omissions’
10 September 2018
11
 Motilal Oswal Financial Services
E
CO
S
COPE
Monsoon deficit at 7%,
kharif
sowing 0.2% higher YoY
10 September 2018
The Economy Observer
India received 721.9mm of rainfall between June 1st, 2018 and September 9th, 2018. This is 7% below the
long period average (LPA) for the period.
While East & Northeast India witnessed a deficit of 24%, Northwest India and Central India witnessed a deficit
of 3% and 1% respectively. South India witnessed a surplus of 3%, largely on account of heavy rainfall in
Kerala (+31%).
Main rainfall deficit areas during June 1st, 2018 and September 9th, 2018: Gujarat (-23%), Bihar (-18%),
Jharkhand (-20%), West Bengal (-20%), Haryana (-19%), Punjab (-15%) and the Northeastern states (-20% to -
54%).
India’s water reservoir stood at 119 billion cubic meters (BCM) as on September 6th, 2018. This is 73.5% of the
total live storage capacity of the country’s 91 reservoirs. This is higher than the average level of 68.1% seen
during the last ten years (Exhibit 2).
Exhibit 1: India's Southwest monsoon
(% departure from LPA)
30 June 2018
Northwest India
Central India
South India
East & Northeast India
All-India
16
-3
16
-27
-5
th
Cumulative rainfall scenario as on
31 July 2018
-2
5
1
-26
-6
st
31 August 2018 9 September 2018
-4
-1
7
-24
-6
-3
-1
3
-24
-7
Source: IMD, MOSL
st
th
Exhibit 2: Current reservoir levels in India
90
80
70
60
50
40
30
20
2010
As of 6 September
th
Current reservoir levels as % of total
78.7
68.0
65.3
58.5
82.6
77.3
10-year average
68.5
73.5
57.8
2011
2012
2013
2014
2015
2016
2017
2018
Source: Central Water Commission, CMIE, MOSL
10 September 2018
12
 Motilal Oswal Financial Services
Area sown for kharif crops 0.2% higher up to September 7th, 2018
The total area sown for kharif crops touched 104.2mn ha by September 7
th
,
2018 – this is 0.2%
higher
than the area sown by the same period last year
(Exhibit
3).
The area sown for pulses and coarse cereals was down 2.2% and 4%,
respectively, by September 7
th
2018.
Exhibit 3: Area sown for kharif crops until to September 7, 2018 (Mn hectares)
Crop
Rice
Pulses
Coarse Cereals
Oilseeds
Sugarcane
Jute & Mesta
Cotton
Total
Area sown in
2018-19
38.2
13.4
17.4
17.4
5.2
0.7
11.8
104.2
Area sown in
2017-18
37.3
13.7
18.2
16.9
5.0
0.7
12.1
%
YoY
2.3
(2.2)
(4.0)
2.8
4.2
(0.7)
(2.4)
104.0
0.2
Source: Ministry of Agriculture, MOSL
10 September 2018
13
 Motilal Oswal Financial Services
In conversation
1. BAJAJ AUTO: No-permit regime for auto rickshaws run on
alternate fuel a progressive step; Rakesh Sharma, Chief
Commercial Officer
** Union Minister for Road Transport and Highways, Nitin Gadkari on Thursday
announced a "no-permit" regime for auto rickshaws run on alternate fuel.
It is a forward looking and a positive announcement by the minister in the drive
to get to pollution-free cities.
It is based on a recommendation by a committee, which the ministry had
constituted 12-18 months ago,
which comprised of a lot of state transport ministers wanting to address the
issue of congestion and the consequent impact on the environment of this
transport.
On the domestic side with all these positive moves, company feels that this kind
of a growth is sustainable and this year itself
company is certainly trying to breach the 400,000 mark in this financial year.
Coupled with international business, also at a similar level, company is already
touching 1 million whereas capacity was 750,000.
That is why this announcement was a trigger to action out company’s plan to
expand the capacity.
2. L&T TECHNOLOGY: Graphene is more than a revenue play;
Amit Chadha, President and ED
** L&T Technology Services has bought Graphene Semiconductor Services for an
all-cash deal of Rs 93 crore.
Graphene more than a revenue play is a capability or a niche acquisition. Have
gone to the market and announced that company is looking to get to a billion
dollars in revenues by FY21 and to get to that, company will need to expand its
telecom and hi-tech footprint.
Graphene has had 57 percent CAGR over the last four years. Will be able to do a
lot more because company is bringing in specific capability that it has gone in for
this acquisition.
Company is largely organic growth driven. Do expect to make one-two more
acquisitions, may or may not happen in this financial year but looking at specific
sectors and areas to see how company can augment that to scale up to the
ambitions that it has got.
3. L&T INFOTECH: Posive on customer spends; Sanjay Jalona- MD
& CEO
Customer economies are growing well in Europe & North America.
Typical customer spend has changed from support businesses to digital spend.
If IT companies can offer a good proposition, customers are ready to make the
IT budgets.
Company maintains its focus on large accounts and large deals.
Management expect to be leader in revenue growth in FY19 as well
Net profit margin will remain in narrow band of 15 percent despite Rupee
depreciation as company will set off 180pbs salary hike impact on margins.
10 September 2018
14
 Motilal Oswal Financial Services
From the think tank
1. Has the time come to change retail promotions?
Brand promotions have several objectives. Creating awareness is one, and repeat
business and increased sales are some others. But according to one-to-one
marketing expert and database marketing veteran Raj Bhatia, the end goal is to
build market share. He says that two things have to work in order to meet the
objective—incremental purchase by existing customers and large number of trials
from lapsed or new customers. “While advertising spreads the word, the make-or-
break moment is the point of sale, which often happens to be the store.”
Unfortunately, for 50 years, in-store product promotions have remained
unchanged. They include limited kind of offers: Price-offs, a free gift (bowls and
buckets), bundling (say, four soaps with ₹15 off) or cross-promotions
(usually
between two different brands, say, biscuits plus oats or milk plus breakfast
cereal). Some other kind of promos, such as lucky draws and scratch cards, are
now passé owing to logistical constraints.
2. CODE RED
With domestic airlines expected to rack up combined losses in excess of ₹13,000
crore this year, it’s crisis time in India’s civil aviation sector. Responding to panic
calls, the Centre is reportedly working on a relief package to help airlines cut
costs. Details of the package are not known yet and no deadline has been
specified for its roll-out. Carriers would be hoping for some long-pending
demands to be addressed, including lower taxes on aviation turbine fuel (ATF)
and rationalisation of airport charges. On average, fuel accounts for 34 per cent
of the operating costs of airlines in India, well above the global average of 24 per
cent. While the oil price rally and the rupee’s rout have primarily led to fuel
costs escalating this year, high taxes levied by the Centre and many States have
made a bad situation worse. While there is a case to cut taxes on ATF, the
Centre may be in a bind. The prices of petrol, diesel and other fuels have also
shot up. Cutting tax on ATF alone will make for bad optics, more so in an
election year. The Centre’s tight financial position gives it little room to cut taxes
on other fuels.
3. Why gst exemptions would prove to be a bane rather than a
boon
Now that more than a year has passed since the GST implementation, and the
revenues are more or less steady, and considering the fact that the general
elections are scheduled for next year, expectations that the government should
exempt more and more goods and services from GST levy are high. In the last
GST Council meeting, many decisions were taken concerning GST exemptions.
On the face of it, exempting any supply of goods/services from the levy of GST
appears to be consumer-friendly as no GST is payable on such supply. However,
in reality, the consumers may end up carrying the burden of at least a certain
amount of GST due to the cascading effect of the GST exemption. GST follows
the value-added tax (VAT) mechanism, where tax is payable on every value-add
in the supply-chain (either supply of goods and / or services). Further, India’s
policymakers have chosen the tax-invoice method (which is the most popular
method, globally) for the VAT mechanism to be followed by businesses.
10 September 2018
15
 Motilal Oswal Financial Services
International
4. State capitalism 2.0
The fall of the Berlin Wall almost 30 years ago represented a high-water mark in
the retreat of the state from the global economy, signaling a defeat of socialist
economics virtually worldwide. From dirigiste France to communist China,
countries with widely divergent economic models began to adopt a more
laissez-faire policymaking approach, predicated on the idea that the less state
intervention, the better. Amid this global rollback of statist and socialist
economics, some state-owned enterprises (SOEs) were privatized outright. But
the vast majority of “crown jewels” remained partly in the hands of
governments, with a strategic private partner or private investors acquiring
stakes through capital markets. Whatever its form, privatization did not just
express a philosophical direction; it also had wide-ranging economic
consequences, not least on stock exchanges, which were revitalized through
SOE listings in countries as different as Italy and Egypt.
10 September 2018
16
 Motilal Oswal Financial Services
Click excel icon
for detailed
valuation guide
CMP
(INR)
817
132
2924
687
21343
1399
28651
1476
798
279
3327
973
8733
304
278
591
Valuation snapshot
Company
Reco
Automobiles
Amara Raja
Buy
Ashok Ley.
Buy
Bajaj Auto
Buy
Bharat Forge
Buy
Bosch
Neutral
CEAT
Buy
Eicher Mot.
Buy
Endurance Tech. Buy
Escorts
Neutral
Exide Ind
Buy
Hero Moto
Neutral
M&M
Buy
Maruti Suzuki
Buy
Motherson Sumi Buy
Tata Motors
Buy
TVS Motor
Neutral
Aggregate
Banks - Private
AU Small Finance Buy
Axis Bank
Buy
DCB Bank
Neutral
Equitas Hold.
Buy
Federal Bank
Buy
HDFC Bank
Buy
ICICI Bank
Buy
IndusInd
Buy
J&K Bank
Buy
Kotak Mah. Bk Neutral
RBL Bank
Buy
South Indian
Buy
Yes Bank
Buy
Aggregate
Banks - PSU
BOB
Buy
BOI
Neutral
Canara
Neutral
Indian Bk
Buy
PNB
Neutral
SBI
Buy
Union Bk
Neutral
Aggregate
NBFCs
Aditya Birla Cap Buy
Bajaj Fin.
Neutral
Capital First
Buy
Cholaman.Inv.&F
Buy
n
GRUH Fin.
Neutral
HDFC
Buy
HDFC Stand. Life Buy
ICICI Pru Life
Buy
Indiabulls Hsg
Buy
L&T Fin Holdings Buy
LIC Hsg Fin
Neutral
TP % Upside
EPS (INR)
EPS Gr. YoY (%)
P/E (x)
P/B (x)
ROE (%)
(INR) Downside FY18 FY19E FY20E FY18 FY19E FY20E FY18 FY19E FY18 FY19E FY18 FY19E
946
149
3223
747
19280
1588
34111
1691
988
314
3446
1103
10805
388
338
546
16
13
10
9
-10
13
19
15
24
12
4
13
24
28
22
-8
27.6
5.4
151.3
17.7
469.8
64.0
799.6
29.1
39.5
8.2
185.1
41.0
266.7
8.2
22.9
13.9
29.3
6.6
153.9
23.5
584.2
76.1
966
37.1
52.5
10.6
193.4
48.3
311.2
10.2
30.1
15.6
36.3
8.7
174.6
29.3
712.6
99.2
1,238
49.1
65.9
12.8
219.0
55.5
409.2
14.6
38.2
22.8
-1.5
23.9
7.3
34.9
-0.7
-31.5
27.0
23.8
88.0
0.4
9.5
49.8
7.3
5.9
15.7
18.7
15.2
6.2
23.4
1.7
33.2
24.3
19.0
20.9
27.8
32.8
29.1
4.5
17.8
16.7
24.4
31.3
11.6
18.6
23.8
30.5
13.5
24.5
22.0
30.4
28.1
32.3
25.5
21.4
13.2
14.8
31.5
44.0
26.9
46.1
24.9
29.6
24.5
19.3
38.9
45.4
21.9
35.8
50.8
20.2
34.1
18.0
23.7
32.7
37.2
12.1
42.3
25.1
27.9
19.8
19.0
29.2
36.5
18.4
29.6
39.8
15.2
26.4
17.2
20.1
28.1
29.9
9.2
37.9
21.2
4.7
5.4
4.4
6.9
6.5
2.2
11.1
9.6
3.2
4.4
5.6
3.8
6.3
6.9
1.0
9.7
3.9
8.7
2.6
1.9
2.3
1.3
5.0
2.1
4.8
0.5
4.7
3.8
0.6
2.9
3.6
0.9
0.5
0.6
0.9
0.6
1.2
0.4
0.9
3.5
10.2
2.4
4.4
18.8
5.2
5.9
2.9
3.4
3.0
2.1
4.2
4.6
4.0
5.9
5.9
2.0
8.6
8.0
2.7
3.9
5.1
3.4
5.6
5.9
0.9
8.3
3.4
6.4
2.4
1.8
2.2
1.2
3.8
2.1
4.2
0.5
4.1
3.5
0.6
2.5
3.1
0.9
0.5
0.6
0.8
0.7
1.2
0.4
0.9
2.9
8.4
2.1
3.7
15.5
4.5
5.0
2.5
3.0
2.5
1.8
17.0
23.7
24.2
18.8
15.3
10.3
35.2
21.0
18.3
12.9
33.8
14.2
18.5
19.5
10.1
25.1
15.5
13.8
0.5
10.9
1.4
8.3
17.9
6.8
16.5
3.8
12.5
11.6
6.6
17.7
10.4
-5.8
-17.8
-12.2
8.3
-29.6
-3.5
-23.7
-8.0
12.4
20.4
13.4
20.9
31.8
18.6
25.8
16.1
27.9
14.2
17.0
15.9
25.1
22.1
21.7
17.0
11.2
32.7
22.0
19.3
14.9
31.1
14.5
19.5
21.2
10.1
23.6
16.3
14.9
7.8
10.8
7.1
9.1
16.6
6.2
19.4
6.7
11.8
12.3
5.7
19.5
11.6
6.9
2.5
3.9
9.4
-6.4
2.4
-2.1
2.5
10.9
21.1
15.7
21.0
31.8
17.5
26.0
16.8
28.3
19.3
17.2
692
645
169
157
78
2058
335
1876
55
1248
609
17
323
760
750
170
175
110
2400
355
2250
100
1400
700
26
444
10
16
1
11
41
17
6
20
83
12
15
54
37
10.2
1.1
8.0
0.9
4.8
67.8
11.1
60.2
3.8
32.5
15.1
1.9
18.4
14.0
20.1
9.5
4.9
5.8
79.2
9.9
81.8
6.5
37.2
20.6
1.7
23.8
19.8
35.9
11.2
9.7
7.9
94.9
20.8
108.2
7.8
45.7
28.0
3.9
30.7
-79.5 37
-92.8 1,705
13.8 18.9
-82.3 427.2
-1.3 22.8
19.4 16.8
-34.3 -10.8
25.2 36.0
LP
74.1
21.3 14.2
27.3 36.3
-25.5 -9.7
26.3 29.0
-1.3 30.7
PL
Loss
PL
-10.4
PL
PL
PL
PL
NA
35.9
34.3
35.5
LP
LP
LP
22.7
Loss
LP
Loss
LP
22.4
44.5
33.4
20.8
25.5
10.1
22.6
2.4
18.0
74.7
14.3
40.8 67.6 49.4
79.2 580.6 32.2
18.2 21.2 17.8
99.5 169.7 32.2
35.2 16.4 13.4
19.9 30.3 26.0
110.5 30.3 34.0
32.2 31.2 22.9
19.7 14.6 8.4
22.9 38.4 33.6
35.6 40.3 29.5
134.2 9.1 10.1
29.2 17.6 13.6
43.1 34.5 26.4
67.9
62.7
129.2
66.1
LP
286.2
LP
291.2
34.8
32.2
26.0
18.9
13.1
19.4
22.5
8.4
19.0
17.4
18.7
NM
NM
NM
12.3
NM
NM
NM
0.0
36.5
63.1
18.6
23.1
67.2
45.5
81.5
33.6
13.4
24.8
12.7
12.7
18.5
14.0
10.0
NM
36.9
NM
35.6
29.8
43.7
14.0
19.1
53.5
41.4
66.5
32.8
11.4
14.2
11.1
148
94
271
322
84
292
84
175
90
278
430
85
360
97
18
-4
3
34
1
23
16
-9.8
-43.2
-63.5
26.2
-50.3
-5.3
-56.5
11.7
5.1
19.3
32.2
-8.9
7.9
-4.3
19.6
8.3
44.2
53.4
8.0
30.5
3.5
137
2740
616
1437
333
1925
451
379
1209
168
501
200
2500
960
1700
300
2335
525
450
1650
240
600
46
-9
56
18
-10
21
17
19
36
43
20
3.8
43.4
33.1
62.3
4.6
62.7
44.2
75.3
6.2
82.9
55.6
89.5
5.0
6.2
7.0 21.9
42.3 46.5 55.6 6.2
5.5
6.8
8.3 23.7
11.3 11.6 12.5 -3.8
90.2 106.4 126.6 31.5
6.8 11.8 13.9 29.5
39.4 45.0 53.5 3.0
10 September 2018
17
 Motilal Oswal Financial Services
Click excel icon
for detailed
valuation guide
CMP
(INR)
606
460
467
1302
541
2027
1214
TP % Upside
(INR) Downside
780
29
600
30
490
5
1520
17
710
31
2500
1650
23
36
EPS (INR)
FY18 FY19E FY20E
19.2 24.4 30.7
17.4 20.3 24.2
43.0 51.2 58.1
49.9 67.1 81.4
32.9 40.9 45.9
Valuation snapshot
ROE (%)
FY18 FY19E
20.7 17.2
12.5 12.4
24.1 24.2
13.9 16.1
16.9 18.0
12.7
12.7
14.8
11.6
18.0
2.5
17.5
48.7
4.5
18.3
15.7
17.3
18.7
23.1
13.7
9.1
21.9
8.8
12.4
15.9
11.0
6.1
9.7
3.8
9.5
8.0
2.0
6.1
14.4
4.4
27.4
6.5
6.9
16.2
9.4
8.2
25.3
32.9
49.0
25.9
29.2
-3.3
24.9
21.2
78.1
22.3
15.4
16.9
15.8
13.3
17.8
3.6
21.8
44.8
6.9
17.7
16.8
23.4
20.4
21.3
14.3
10.8
22.4
12.3
12.9
15.1
12.1
7.8
14.0
6.6
11.1
12.6
3.5
9.1
14.1
9.9
22.7
12.0
8.1
15.5
10.5
10.8
25.7
32.6
48.3
23.4
30.2
1.2
24.8
22.5
86.9
22.9
Company
Reco
MAS Financial
Buy
M&M Fin.
Buy
Muthoot Fin
Neutral
PNB Housing
Buy
Repco Home
Buy
Shriram
City
Buy
Union
Shriram Trans. Buy
Aggregate
Capital Goods
ABB
Sell
Bharat Elec.
Buy
BHEL
Sell
Blue Star
Neutral
CG Cons. Elec.
Buy
CG Power & Indu. Neutral
Cummins
Buy
Engineers India Buy
GE T&D
Neutral
Havells
Buy
K E C Intl
Neutral
L&T
Buy
Siemens
Neutral
Solar Ind
Neutral
Thermax
Buy
Va Tech Wab.
Buy
Voltas
Neutral
Aggregate
Cement
Ambuja Cem.
Neutral
ACC
Buy
Birla Corp.
Buy
Dalmia Bharat
Buy
Grasim Inds.
Neutral
India Cem
Neutral
JK Lakshmi Ce
Buy
Ramco Cem
Buy
Orient Cem
Buy
Prism Johnson Buy
Sagar Cements Not Rated
Sanghi Inds.
Buy
Shree Cem
Buy
Ultratech
Buy
Aggregate
Consumer
Asian Paints
Neutral
Britannia
Buy
Colgate
Buy
Dabur
Neutral
Emami
Buy
Future Consumer Buy
Godrej Cons.
Neutral
GSK Cons.
Neutral
HUL
Buy
ITC
Neutral
EPS Gr. YoY (%)
P/E (x)
P/B (x)
FY18 FY19E FY20E FY18 FY19E FY18 FY19E
27.5 27.5
25.4 31.6 24.8 4.6
4.0
146.3 16.2
19.3 26.4 22.7 2.9
2.7
45.6 19.1
13.3 10.9 9.1
2.4
2.0
57.7 34.5
21.4 26.1 19.4 3.3
2.9
13.1 24.0
12.3 16.4 13.2 2.6
2.2
35.8
58.4
24.9
27.0
10.2
45.6
37.6
23.4
52.6
12.6
0.8
56.4
23.4
12.5
15.4
27.0
21.1
51.4
34.5
9.3
19.2
33.9
54.7
99.2
28.7
76.8
80.2
58.1
8.0
138.5
416.9
101.0
45.4
10.0
20.5
43.6
15.8
23.8
20.7
24.5
16.1
28.0
25.7
22.6
16.1
20.4
17.0
12.7
22.1
27.8
22.0
19.8
29.8
30.1
14.8
14.5
21.6
18.0
27.4
31.6
51.8
27.2
38.1
67.3
47.4
62.6
33.5
39.7
40.5
45.3
36.9
34.4
20.1
17.6
33.2
67.9
16.0
36.0
46.9
42.6
19.5
32.4
20.2
37.5
60.0
16.5
26.1
50.3
47.3
48.7
16.6
34.6
31.0
37.4
33.6
39.9
45.9
17.9
37.1
44.7
27.9
52.9
102.3
29.3
22.4
46.5
49.8
37.8
14.8
11.1
26.6
53.4
14.5
24.8
34.1
34.6
12.8
28.8
20.1
24.0
48.6
14.7
22.6
39.6
39.0
32.2
12.3
31.7
26.0
27.9
21.7
20.0
35.7
10.1
20.6
28.3
25.8
22.2
19.8
14.6
15.4
42.3
41.4
26.3
2.4
2.0
4.9
7.9
2.9
0.9
7.8
17.5
0.9
5.3
3.8
6.0
11.2
3.8
3.4
4.6
9.6
4.1
1.9
5.1
3.4
2.3
3.2
1.4
4.2
1.4
0.7
2.7
3.9
2.3
5.3
1.9
1.3
7.0
4.5
3.1
2.1
1.7
4.2
7.1
2.6
0.9
7.1
13.9
0.9
4.9
3.4
5.2
9.9
3.1
3.1
4.3
8.0
3.8
1.7
4.5
3.1
2.1
2.9
1.3
3.7
1.2
0.7
2.5
3.5
2.1
4.2
1.7
1.2
6.1
4.2
2.8
14.1
19.5
19.3
11.5
10.9
8.7
12.6
7.8
47.4
6.8
100.8 136.9 158.5 19.5
69.1 109.4 135.5 24.7
25.2
19.8
5.7
2.2
14.5
5.2
2.9
23.5
6.3
7.5
11.2
17.9
51.7
19.8
24.4
20.5
24.1
17.3
25.2
6.3
3.2
20.0
6.4
4.4
26.5
6.3
11.7
13.8
20.1
59.7
25.1
29.5
31.1
32.4
18.9
31.3
7.3
4.1
25.1
7.8
5.1
31.9
7.4
13.2
16.9
25.7
72.8
30.1
38.3
40.4
37.2
21.6
8.1
-8.8
64.1
12.7
14.3
-29.8
-11.2
14.8
30.8
17.4
51.1
22.4
10.9
18.2
-1.2
27.6
11.9
15.1
30.5
27.7
-35.6
106.8
-15.4
-42.0
5.8
-12.3
LP
288.2
LP
29.5
0.4
-10.9
-0.7
1345
92
79
681
220
56
763
127
281
673
296
1349
993
1152
1000
399
598
950
120
60
695
305
60
800
155
330
645
360
1570
1070
1150
1295
450
590
-29
30
-24
2
39
7
5
23
18
-4
22
16
8
0
29
13
-1
227
1574
755
2566
1024
121
329
665
114
108
736
83
17944
4271
231
1633
1030
3198
1084
120
384
802
139
136
-
130
19804
4536
2
4
36
25
6
-1
17
21
22
25
56
10
6
6.1
46.9
18.9
55.9
57.4
3.3
7.4
23.9
2.2
1.1
25.2
3.7
385.8
85.7
8.1
72.5
37.7
71.9
101.4
5.9
11.6
25.8
5.1
5.5
50.6
5.4
424.5
103.3
9.6
92.4
49.6
109.1
129.0
8.1
19.5
38.0
8.4
7.3
70.6
7.6
617.1
141.4
1317
6232
1141
468
558
53
1339
7234
1639
310
1405
7165
1360
440
665
69
1240
6710
2010
295
7
15
19
-6
19
30
-7
-7
23
-5
21.1
83.6
25.2
7.8
12.1
-0.2
21.1
166.5
24.5
8.9
23.3 28.3 1.9
98.6 124.9 13.5
27.8 32.5 18.6
8.5
10.1 7.2
14.4 17.2 -8.5
0.1
0.9
Loss
24.5 28.5 11.4
197.3 222.1 6.6
29.2 35.6 24.7
10.0 11.4 5.5
10.1
21.6 62.3 56.6 15.0
17.8
26.7 74.5 63.2 22.0
10.5
16.7 45.3 41.0 20.4
9.7
18.9 60.3 54.9 14.5
18.8
19.5 46.0 38.7 12.6
LP 1,080.9 NM 705.1 8.8
16.1
16.2 63.4 54.6 14.6
18.5
12.6 43.5 36.7 8.7
19.5
21.8 66.9 56.0 50.1
13.2
13.8 35.0 31.0 7.4
10 September 2018
18
 Motilal Oswal Financial Services
Click excel icon
for detailed
valuation guide
CMP
Company
Reco
(INR)
Jyothy Lab
Neutral
210
Marico
Neutral
358
Nestle
Neutral 10447
Page Inds
Neutral 33322
Parag Milk Foods Neutral
293
Pidilite Ind.
Buy
1159
P&G Hygiene
Neutral 10115
Prabhat Dairy
Not Rated 157
United Brew
Buy
1343
United Spirits
Neutral
605
Aggregate
Healthcare
Alembic Phar
Neutral
639
Alkem Lab
Buy
2202
Ajanta Pharma Buy
1270
Aurobindo
Buy
801
Biocon
Neutral
661
Cadila
Buy
426
Cipla
Neutral
664
Divis Lab
Neutral
1315
Dr Reddy’s
Neutral
2634
Fortis Health
Buy
147
Glenmark
Neutral
683
Granules
Buy
121
GSK Pharma
Neutral
3498
IPCA Labs
Buy
791
Jubilant Life
Buy
821
Laurus Labs
Buy
431
Lupin
Buy
957
Sanofi India
Buy
6584
Shilpa Medicare Buy
489
Strides Pharma Buy
506
Sun Pharma
Buy
664
Torrent Pharma Neutral
1828
Aggregate
Infrastructure
Ashoka Buildcon Buy
137
IRB Infra
Neutral
178
KNR
Buy
217
Constructions
Sadbhav
Buy
271
Engineering
Aggregate
Logistics
Allcargo Logistics Buy
117
Concor
Buy
658
Aggregate
Media
Dish TV
Buy
69
D B Corp
Neutral
226
Ent.Network
Buy
658
Hathway Cable Buy
23
Hind. Media
Neutral
170
HT Media
Neutral
54
Jagran Prak.
Buy
123
TP % Upside
(INR) Downside
220
5
370
3
10620
2
31600
-5
314
7
1325
14
10250
1
-
1730
29
615
2
EPS (INR)
FY18 FY19E FY20E
4.9
5.7
7.0
6.5
7.6
9.0
140.0 181.0 197.8
311.1 412.2 529.4
10.4 12.0 14.9
18.9 19.7 23.5
115.3 156.6 186.4
3.5
6.4
9.7
14.9 19.2 24.1
6.7
9.2
13.2
EPS Gr. YoY (%)
P/E (x)
FY18 FY19E FY20E FY18 FY19E
-12.4 14.9
24.5 42.7 37.2
-2.8 17.6
18.2 55.4 47.1
13.2 29.2
9.3
74.6 57.7
30.3 32.5
28.5 107.1 80.8
187.1 15.8
24.3 28.3 24.4
13.2 4.0
19.3 61.2 58.8
-13.4 35.9
19.0 87.7 64.6
-2.0 83.8
52.1 45.1 24.5
71.7 28.8
25.6 90.1 69.9
26.1 36.4
43.1 89.7 65.8
10.5 16.4
18.4 53.8 46.2
Valuation snapshot
P/B (x)
FY18 FY19E
6.7
6.2
18.1 15.8
29.4 26.7
43.9 35.3
3.4
3.1
16.5 14.5
35.3 30.6
2.2
2.0
13.2 11.3
17.6 12.9
14.2 12.8
4.7
4.7
4.6
3.3
7.0
4.3
3.4
5.4
3.2
1.6
3.2
2.2
15.7
3.4
2.6
2.7
3.0
6.8
3.1
1.8
3.9
5.7
3.9
ROE (%)
FY18 FY19E
16.0 17.3
34.2 35.8
40.3 48.5
41.0 43.6
13.0 13.2
27.3 26.2
46.3 50.8
4.9
8.5
15.7 17.5
19.6 19.6
26.4 27.7
19.6
15.1
26.0
23.8
7.2
22.1
11.5
15.5
8.6
-2.3
15.6
12.2
16.2
9.3
18.9
11.9
15.6
16.1
10.3
3.9
8.7
20.3
12.6
19.3
17.0
20.4
20.1
11.3
19.5
11.7
18.6
12.5
1.6
14.0
12.7
27.5
12.7
21.6
14.0
9.4
17.2
14.5
4.4
11.4
16.2
13.2
540
2475
1560
910
625
440
620
1270
2170
171
550
130
2888
850
1020
552
950
6590
620
481
790
1430
-15
12
23
14
-5
3
-7
-3
-18
17
-20
7
-17
7
24
28
-1
0
27
-5
19
-22
21.9
58.9
53.0
42.7
6.2
17.5
20.3
33.0
64.7
-2.3
28.5
5.7
39.3
19.0
45.6
15.8
46.8
141.7
12.8
11.3
13.5
53.7
25.0 28.2 2.5 14.3
74.0 98.6 -21.1 25.7
51.5 65.0 -7.5 -2.7
44.2 59.1 8.7
3.5
10.6 20.9 -39.2 71.1
18.0 19.6 20.6 2.5
23.2 30.2 31.2 14.3
43.3 52.6 -17.3 31.0
99.3 120.6 -10.9 53.6
1.4
4.8
PL
LP
29.7 35.6 -27.5 4.1
6.8
8.7 -21.8 20.2
61.3 69.4 14.4 56.0
28.4 38.3 18.1 49.8
63.0 73.3 23.3 38.2
21.1 31.2 -10.9 33.1
29.2 45.1 -17.4 -37.6
166.8 191.6 9.8 17.7
21.2 26.9 -0.7 65.4
12.2 23.4 -65.1 8.4
18.6 26.3 -48.5 38.3
48.1 65.0 -2.6 -10.4
-18.2 15.9
0.8
23.8
13.7
16.0
2.6
23.5
16.8
17.8
Loss
17.5
61.8
17.5
LP
-0.5
-29.1
24.7
12.5 29.2 25.5 5.4
33.2 37.4 29.8 5.4
26.2 24.0 24.6 5.5
33.8 18.8 18.1 4.0
96.5 106.5 62.2 7.7
8.9
24.3 23.7 5.0
29.8 32.6 28.6 3.8
21.5 39.8 30.4 5.9
21.4 40.7 26.5 3.5
234.2 NM 102.6 1.7
20.0 24.0 23.0 3.7
28.0 21.4 17.8 2.4
13.2 89.0 57.0 14.4
34.6 41.7 27.8 3.7
16.4 18.0 13.0 3.1
47.7 27.2 20.4 3.1
54.5 20.5 32.8 3.2
14.8 46.5 39.5 7.5
26.8 38.1 23.0 3.7
92.0 45.0 41.5 1.8
41.4 49.4 35.6 4.2
35.0 34.0 38.0 6.7
32.2 34.4 29.6 4.3
231.2
-1.2
22.3
11.3
NM
7.5
11.2
21.0
14.6
172.5 12.1
7.5
1.0
15.8
16.9
13.4
13.9
25.5
23.3
37.7
12.3
50.0
NM
6.6
6.3
10.3
2.6
2.5
1.9
1.5
3.4
3.0
1.9
2.2
3.5
2.4
0.9
0.5
1.9
195
225
315
385
43
26
45
42
-4.2
23.9
19.4
12.9
11.3 -30.2 6.8
0.9 14.6 12.9
2.3
2.2
1.7
1.3
3.2
2.8
1.8
2.2
3.3
2.7
0.8
0.5
1.8
26.5
12.5
12.8
9.5
9.1
8.9
-2.1
18.4
3.7
-8.7
14.0
12.6
14.3
15.5
13.8
12.5
10.0
12.9
12.0
4.9
17.0
6.9
-8.2
13.2
7.5
17.5
146
769
25
17
7.3
17.1
8.4
25.8
10.5
30.9
-23.1
13.4
4.7
16.3
51.2
45.1
24.3
19.7
20.4
201.8
25.7
64.4
Loss
9.5
16.6
24.7
16.2
38.6
33.9
NM
12.8
96.9
NM
7.1
4.1
12.8
100
300
851
47
237
59
156
46
33
29
100
40
10
27
-0.4
17.6
6.8
-0.9
23.9
13.0
9.6
1.8
18.4
13.2
-0.8
25.5
8.5
11.9
5.5
23.1
21.6
-0.6
28.0
9.9
14.9
PL
LP
-13.8 4.3
-40.5 93.7
Loss Loss
-7.5
6.9
75.6 -34.5
-9.5 23.8
10 September 2018
19
 Motilal Oswal Financial Services
Click excel icon
for detailed
valuation guide
CMP
(INR)
325
1361
695
470
TP % Upside
(INR) Downside
455
40
1565
15
1050
51
680
45
EPS (INR)
FY18 FY19E FY20E
9.1 13.0 17.1
26.7 34.3 44.8
27.7 36.5 41.9
14.6 16.1 19.5
Valuation snapshot
ROE (%)
FY18 FY19E
9.0 11.9
12.2 13.9
25.2 29.6
19.6 19.0
12.1 14.2
12.8
26.7
-2.7
22.2
9.1
17.7
0.3
22.9
12.2
17.8
11.5
19.4
29.0
11.8
16.7
14.0
31.0
21.0
20.8
24.3
21.2
9.4
13.0
23.3
13.0
14.9
20.3
24.0
21.8
18.3
25.0
26.9
24.1
15.4
18.8
14.6
16.2
16.7
37.6
29.4
21.5
17.0
15.3
24.1
2.4
14.2
24.2
0.6
25.5
14.8
17.1
9.5
24.5
12.2
16.5
13.5
20.7
24.4
14.2
22.3
13.0
27.8
14.5
21.0
22.5
15.0
13.7
16.9
24.6
14.3
15.3
24.2
28.2
27.4
16.7
25.3
26.4
25.0
16.1
25.7
20.9
19.5
18.3
35.8
34.9
19.3
15.7
18.2
25.0
-0.5
Company
Music Broadcast
PVR
Sun TV
Zee Ent.
Aggregate
Metals
Hindalco
Hind. Zinc
JSPL
JSW Steel
Nalco
NMDC
SAIL
Rain Industries
Vedanta
Tata Steel
Aggregate
Oil & Gas
Aegis Logistics
BPCL
GAIL
Gujarat Gas
Gujarat St. Pet.
HPCL
IOC
IGL
Mahanagar Gas
MRPL
Oil India
ONGC
PLNG
Reliance Ind.
Aggregate
Retail
Jubilant Food
Titan Co.
Aggregate
Technology
Cyient
HCL Tech.
Hexaware
Infosys
KPIT Tech
Mindtree
Mphasis
NIIT Tech
Persistent Sys
Tata Elxsi
TCS
Tech Mah
Wipro
Zensar Tech
Aggregate
Telecom
Bharti Airtel
Reco
Buy
Buy
Buy
Buy
EPS Gr. YoY (%)
P/E (x)
P/B (x)
FY18 FY19E FY20E FY18 FY19E FY18 FY19E
41.1 43.5
31.6 35.8 25.0 3.1
2.9
29.9 28.6
30.5 51.0 39.7 5.9
5.2
11.6 31.5
14.9 25.1 19.1 5.9
5.4
-7.0 10.6
21.3 32.2 29.1 6.0
5.2
0.1 26.3
33.9 29.3 23.2 3.5
3.3
13.6 12.8 9.9
18.6 14.1 13.5
101.2 NM 115.7
-9.8
17.3 12.1
-10.4 14.3 7.9
6.1
9.1
8.7
-23.8 303.3 8.8
5.7
8.1
5.9
24.9 11.3 10.7
-19.3
8.6
7.3
2.2
13.6 10.4
35.9
0.5
21.9
23.8
-1.0
2.4
4.7
11.5
7.3
19.0
5.8
11.3
11.9
23.9
13.9
24.8
26.5
26.2
18.2
13.1
17.3
16.5
18.0
34.5
9.5
18.4
28.0
16.8
14.1
21.6
14.2
33.0
14.6
LP
36.6
7.2
18.5
33.6
16.2
5.3
6.4
29.3
17.6
6.1
9.3
8.5
17.5
21.0
12.4
94.9
68.6
72.5
20.7
17.2
26.6
17.9
24.3
33.8
28.2
30.0
21.5
35.2
31.5
18.0
18.1
30.9
24.4
95.9
26.7
7.3
14.2
21.6
15.6
5.0
8.6
24.0
16.7
7.8
6.2
6.1
14.1
16.7
10.8
64.1
53.4
55.2
20.4
14.9
23.1
20.3
20.0
25.1
21.5
23.1
18.9
28.8
25.4
17.8
17.2
22.8
22.2
NM
1.5
3.5
0.7
3.5
1.2
1.5
0.9
1.6
1.4
1.3
1.6
6.0
1.9
2.1
5.3
2.1
1.5
1.3
5.5
4.0
1.2
0.9
1.1
3.7
2.6
1.8
19.2
15.1
15.8
3.8
4.1
6.7
4.1
3.4
7.0
4.4
4.7
3.4
11.7
9.1
3.6
3.0
4.5
5.9
2.2
1.4
3.0
0.7
2.8
1.1
1.4
0.8
1.3
1.3
1.1
1.4
5.1
1.7
1.9
4.4
1.9
1.3
1.2
4.7
3.5
1.1
0.8
1.0
3.2
2.2
1.6
15.5
15.1
15.2
3.4
3.5
5.6
5.0
2.9
6.0
5.0
4.3
3.3
9.2
8.8
3.2
2.6
3.9
5.6
2.3
Buy
Neutral
Buy
Buy
Buy
Buy
Neutral
Buy
Buy
Neutral
242
298
220
406
72
119
78
192
231
619
331
295
327
385
108
178
82
241
269
632
37
-1
49
-5
50
49
5
26
16
2
18.9
21.1
-8.5
23.4
5.0
13.1
0.3
23.7
20.4
71.9
24.4
22.2
1.9
33.4
9.1
13.7
8.9
32.4
21.6
85.1
27.8 120.5 29.4
26.3 7.2
5.0
3.8
Loss
LP
30.1 56.9 42.8
8.2 35.3 80.7
14.6 31.5 4.7
6.8
LP 3,359
34.2 238.1 36.4
27.0 34.6 6.2
68.7 76.5 18.4
73.3 31.2
11.0
48.9
32.5
40.7
12.2
51.8
18.8
12.8
54.8
11.9
35.1
31.5
19.3
94.9
64.5 36.9
3.0
-2.3
20.5 30.6
32.0 55.4
34.6 4.0
-12.4 6.7
11.0 -24.9
9.2 22.1
21.5 5.5
-13.6 -21.6
-1.2 49.3
-9.9 40.1
21.8 24.5
20.7 25.7
5.5 15.1
Buy
Buy
Neutral
Buy
Neutral
Buy
Buy
Buy
Buy
Neutral
Buy
Buy
Buy
Buy
217
357
377
712
192
253
154
276
853
78
207
172
243
1277
311
534
361
990
196
426
252
383
1097
88
296
219
312
1477
44
50
-4
39
2
68
64
39
29
13
43
27
29
16
5.9
49.8
20.4
21.2
11.9
47.4
23.9
9.4
48.4
12.8
22.2
20.2
13.9
60.9
8.1
48.6
26.6
32.9
12.3
50.6
17.9
11.5
51.1
10.0
33.1
28.3
17.2
76.6
Neutral
Buy
1412
867
1320
1130
-6
30
14.9
12.6
22.0
16.2
27.5 180.6 48.2
20.5 39.9 28.4
51.2 31.3
45.9
81.5
22.4
42.1
18.2
62.3
63.2
70.2
58.9
55.4
93.5
52.6
21.5
19.1
24.8
4.5
21.2
30.2
6.1
38.0
13.2
19.8
7.2
37.7
-1.0
33.6
7.7
1.3
5.0
-63.3
1.4
15.2
15.1
-11.5
21.3
34.8
31.1
30.1
13.9
22.3
24.1
1.3
5.2
35.9
10.0
PL
Neutral
Neutral
Sell
Buy
Neutral
Buy
Neutral
Neutral
Buy
Buy
Neutral
Buy
Neutral
Buy
792
1074
442
733
308
1161
1242
1368
869
1364
2080
770
324
326
780
1100
380
800
320
1260
1100
1100
950
1700
1950
800
300
300
-2
2
-14
9
4
9
-11
-20
9
25
-6
4
-7
-8
38.2
62.6
16.6
40.9
12.7
34.4
44.0
45.6
40.4
38.7
66.0
42.7
17.9
10.6
38.8
72.0
19.1
36.2
15.4
46.3
57.7
59.3
46.0
47.4
81.9
43.3
18.8
14.3
Buy
391
470
20
4.1
-0.8
1.2
10 September 2018
20
 Motilal Oswal Financial Services
Click excel icon
for detailed
valuation guide
CMP
(INR)
278
47
528
TP % Upside
(INR) Downside
290
4
70
49
670
27
EPS (INR)
FY18 FY19E FY20E
13.6 11.2 10.0
-9.6 -15.2 -13.3
3.5
0.7
13.8
EPS Gr. YoY (%)
FY18 FY19E FY20E
-8.1 -17.6 -10.9
Loss Loss
Loss
-67.2 -78.5 1,752.3
-98.8 PL
Loss
28.3
45.5
-21.2
-17.3
6.8
16.1
3.5
13.4
0.1
68.4
36.6
27.4
15.5
0.5
16.0
12.5
16.0
21.3
15.4
29.3
16.7
9.6
36.5
23.3
6.4
10.7
26.9
12.8
36.5
33.7
25.9
0.7
19.1
36.3
52.7
13.8
23.9
22.3
46.7
12.8
46.3
42.4
52.1
20.6
74.5
27.5
34.6
18.5
56.9
16.5
8.3
Valuation snapshot
Company
Reco
Bharti Infratel
Neutral
Idea Cellular
Buy
Tata Comm
Buy
Aggregate
Utiltites
Coal India
Buy
CESC
Buy
JSW Energy
Neutral
NHPC
Buy
NTPC
Buy
Power Grid
Buy
Tata Power
Neutral
Aggregate
Others
Arvind
Neutral
Avenue
Sell
Supermarts
BSE
Buy
Castrol India
Buy
Coromandel Intl Buy
Delta Corp
Buy
Interglobe
Neutral
Indo Count
Neutral
Info Edge
Buy
Kaveri Seed
Buy
MCX
Buy
Navneet
Buy
Education
Oberoi Realty
Buy
Phoenix Mills
Buy
Quess Corp
Neutral
PI Inds.
Buy
Piramal Enterp. Buy
SRF
Buy
S H Kelkar
Buy
Tata Chemicals Buy
Team Lease Serv. Buy
Trident
Buy
UPL
Buy
P/E (x)
P/B (x)
ROE (%)
FY18 FY19E FY18 FY19E FY18 FY19E
20.4 24.7 3.0
3.2 15.6 12.6
NM
NM
0.8
0.9 -16.0 -26.5
152.3 709.9 30.1 28.9 9.4
4.2
2,796 -48
2.0
2.1
0.1 -4.5
14.9
13.4
23.2
10.6
12.8
11.8
14.1
13.3
31.0
10.9
10.5
20.1
10.6
11.1
10.5
12.1
10.9
26.9
9.2
1.2
1.0
0.9
1.3
1.8
1.3
2.0
2.7
20.9
1.3
15.0
3.8
4.3
5.0
1.6
9.4
4.2
2.9
4.0
2.7
3.3
4.4
5.6
2.3
3.3
3.9
1.7
9.5
1.1
3.9
8.5
1.1
1.0
0.9
1.3
1.6
1.1
1.9
2.5
17.1
1.0
14.2
3.3
4.2
4.8
1.4
8.5
3.8
2.8
3.5
2.0
2.6
3.9
4.8
2.2
2.9
3.6
1.6
7.7
1.1
3.3
36.5
9.2
4.6
8.5
10.8
16.3
10.7
15.3
8.9
18.9
7.6
69.1
22.1
11.9
41.3
14.0
13.4
20.9
7.9
17.4
7.8
9.6
18.8
20.7
7.5
13.7
12.3
24.9
17.6
9.2
26.9
77.8
10.9
5.1
8.3
11.7
16.3
10.2
17.2
9.6
20.1
6.3
58.3
20.4
10.8
22.4
14.3
14.1
22.2
8.4
22.9
12.6
8.7
12.4
20.4
5.8
15.8
12.3
11.0
20.4
11.5
23.4
286
1013
70
26
169
196
75
345
1292
75
33
194
253
75
21
28
7
27
14
29
0
19.2
75.5
3.0
2.4
13.2
16.5
5.3
26.2
96.2
3.5
2.5
15.3
18.6
6.2
30.6
105.4
4.8
3.0
16.3
20.6
7.9
394
1564
736
155
408
273
915
77
1625
641
772
128
452
609
947
776
3044
2014
233
761
2514
67
713
454
1117
950
218
557
301
903
93
1550
741
1000
160
616
757
1100
889
3685
2225
257
957
3500
82
749
15
-29
29
41
37
10
-1
21
-5
16
29
25
36
24
16
15
21
10
11
26
39
22
5
12.7
12.9
43.5
7.0
22.7
5.8
58.3
6.4
22.5
32.0
21.2
5.4
14.7
16.7
44.3
6.2
23.4
6.9
42.1
7.4
25.7
35.7
23.0
7.9
20.0
22.3
55.8
6.2
27.9
9.4
64.3
8.4
31.8
43.6
33.7
8.9
121.0 93.6
16.9
22.1
18.0
47.2
15.7
12.1
72.4
20.0
36.4
23.8
35.8
38.5
43.4
29.1
39.1
25.0
32.8
15.8
58.4
12.7
16.1
16.6
25.0
17.4
39.7
21.7
10.4
63.2
18.0
33.6
16.3
18.5
33.3
41.2
25.3
38.6
19.6
30.4
15.3
41.6
9.6
15.3
6.0
1.9
2.9 -11.4
38.8 3.1
89.4 18.8
35.1 -27.8
-45.7 15.8
31.3 14.5
67.8 11.5
-14.6 8.4
-26.1
45.7
94.1
15.8
5.3
15.3
1.4
27.6
7.8
3.0
40.3
32.9
5.7
12.6 24.5 35.8 21.2
15.8 18.3 26.1 44.2
21.8 23.0 35.0 115.7
26.7 30.7 37.1 -20.2
77.8 78.9 137.6 7.2
80.4 102.6 130.9 -10.3
7.1
7.6
10.3 -2.2
48.2 49.7 58.8 39.7
43.0 60.4 94.8 28.0
5.3
7.0
8.2 -21.8
44.2 46.7 50.6 5.9
10 September 2018
21
 Motilal Oswal Financial Services
MOSL Universe stock performance
Company
Automobiles
Amara Raja
Ashok Ley.
Bajaj Auto
Bharat Forge
Bosch
CEAT
Eicher Mot.
Endurance Tech.
Escorts
Exide Ind
Hero Moto
M&M
Maruti Suzuki
Motherson Sumi
Tata Motors
TVS Motor
Banks - Private
AU Small Fin. Bank
Axis Bank
DCB Bank
Equitas Hold.
Federal Bank
HDFC Bank
ICICI Bank
IndusInd
Kotak Mah. Bk
RBL Bank
South Indian
Yes Bank
Banks - PSU
BOB
BOI
Canara
Indian Bk
PNB
SBI
Union Bk
NBFCs
Aditya Birla Cap
Bajaj Fin.
Capital First
Cholaman.Inv.&Fn
GRUH Fin.
HDFC
HDFC Stand. Life
Indiabulls Hsg
L&T Fin.Holdings
LIC Hsg Fin
M&M Fin.
Muthoot Fin
MAS Financial Serv.
ICICI Pru Life
PNB Housing
Repco Home
1 Day (%)
1.9
1.5
5.1
2.9
0.6
2.4
-0.6
2.7
1.2
1.8
5.3
4.1
-0.5
4.2
2.8
3.7
2.0
1.0
-1.1
3.0
0.9
0.1
2.0
-0.3
-1.0
3.0
0.0
-4.6
1.3
0.5
0.8
2.2
1.3
-1.6
0.5
-0.4
2.1
1.3
2.7
-2.7
-1.5
-0.7
-0.2
2.1
0.5
3.4
3.6
-0.8
1.3
0.9
0.3
1M (%)
-1.4
10.2
8.9
8.0
11.8
-0.3
4.4
-1.0
-8.6
-2.1
0.8
5.1
-7.1
-0.3
10.2
7.6
4.9
9.0
1.8
6.4
-10.7
-3.5
7.0
-6.0
-2.8
7.8
-6.6
-15.2
1.1
-0.9
-6.3
-13.9
1.8
-4.0
-3.4
-8.0
-0.2
10.0
0.0
0.2
-2.4
-5.9
-11.2
-4.7
-11.2
-5.7
11.4
6.2
-9.8
0.0
-11.3
12M (%)
4.6
17.8
-1.4
19.0
-3.3
-19.3
-12.6
47.7
21.3
34.7
-16.5
45.4
10.4
-8.6
-26.8
-6.6
24.3
29.9
-11.6
-9.5
-29.8
16.2
14.5
10.2
25.4
14.2
-41.9
-10.3
6.1
-34.8
-19.6
15.2
-39.5
6.3
-37.7
-33.8
39.9
-20.0
23.7
27.1
8.2
-8.1
-18.6
-25.7
4.0
-5.3
-13.7
-20.2
-20.4
Company
Shriram City Union
Shriram Trans.
Capital Goods
ABB
Bharat Elec.
BHEL
Blue Star
CG Cons. Elec.
CG Power & Inds Sol.
Cummins
Engineers India
GE T&D
Havells
K E C Intl
L&T
Siemens
Solar Ind
Thermax
Va Tech Wab.
Voltas
Cement
Ambuja Cem.
ACC
Birla Corp.
Dalmia Bharat
Grasim Inds.
India Cem
JK Lakshmi Ce
Ramco Cem
Orient Cem
Prism Johnson
Sagar Cements
Sanghi Inds.
Shree Cem
Ultratech
Consumer
Asian Paints
Britannia
Colgate
Dabur
Emami
Future Consumer
Godrej Cons.
GSK Cons.
HUL
ITC
Jyothy Lab
Marico
Nestle
Page Inds
Parag Milk
Pidilite Ind.
P&G Hygiene
Prabhat Dairy
United Brew
1 Day (%)
0.1
1.1
4.2
0.8
-2.6
0.9
1.5
0.5
-1.4
1.2
2.2
-0.9
-1.2
0.2
-0.4
-1.8
0.8
2.8
0.9
0.4
1.0
-0.2
1.1
-0.3
3.0
-0.9
-0.1
0.3
1.2
0.4
-0.4
-1.3
3.0
0.2
0.5
0.1
3.1
-1.6
0.4
2.1
-1.4
1.9
-0.1
-0.7
0.7
1.1
4.6
0.8
0.9
0.5
-1.2
0.0
1M (%)
4.8
-14.4
11.6
-21.0
7.8
-1.0
-15.6
-4.6
11.4
-4.6
0.4
-0.3
-6.9
4.1
-3.7
-9.5
-13.5
4.0
4.0
-1.0
2.3
-4.8
-2.6
0.8
-0.5
2.4
0.0
-5.5
2.2
-7.0
-5.5
4.2
1.5
-7.2
0.5
-0.3
6.0
-2.3
8.5
2.9
7.2
-5.3
3.1
-4.8
-1.1
-0.8
11.7
-9.8
4.8
-6.0
1.4
16.4
12M (%)
-3.4
12.6
0.3
-47.8
-9.0
-11.4
1.7
-36.4
-16.7
-20.9
-33.0
36.6
-6.3
19.7
-22.2
30.9
14.1
-35.9
12.5
-19.2
-12.2
-22.0
-6.0
-15.3
-33.9
-22.0
-8.9
-29.1
-5.2
-10.9
-3.5
-3.2
3.8
9.8
46.3
-0.3
51.3
-0.6
-16.5
44.8
38.9
35.6
14.8
6.9
11.6
46.4
80.1
19.0
37.3
20.4
18.4
70.7
10 September 2018
22
 Motilal Oswal Financial Services
MOSL Universe stock performance
Company
United Spirits
Healthcare
Alembic Phar
Alkem Lab
Ajanta Pharma
Aurobindo
Biocon
Cadila
Cipla
Divis Lab
Dr Reddy’s
Fortis Health
Glenmark
Granules
GSK Pharma
IPCA Labs
Jubilant Life
Lupin
Laurus Labs
Sanofi India
Shilpa Medicare
Strides Pharma
Sun Pharma
Torrent Pharma
Infrastructure
Ashoka Buildcon
IRB Infra.Devl.
KNR Construct.
Sadbhav Engg.
Logistics
Allcargo Logistics
Concor
Media
Dish TV
D B Corp
Ent.Network
Hathway Cab.
Hind. Media
HT Media
Jagran Prak.
Music Broadcast
PVR
Sun TV
Zee Ent.
Metals
Hindalco
Hind. Zinc
JSPL
JSW Steel
Nalco
NMDC
Rain Industries
SAIL
Vedanta
Tata Steel
1 Day (%)
0.9
2.2
4.5
0.7
5.5
-0.3
0.8
0.5
-0.1
2.6
0.4
0.6
0.3
0.7
0.1
7.5
4.1
-0.6
0.8
-2.6
1.0
-1.8
0.0
3.1
0.3
-3.0
-0.3
-1.9
2.7
1.3
0.6
-1.9
12.5
6.6
-1.3
0.4
2.7
1.4
-0.7
-0.2
3.0
-0.5
3.8
1.9
0.8
3.2
0.1
1.9
0.8
3.1
1M (%)
2.8
8.2
2.9
11.8
29.3
15.2
14.2
5.6
12.9
16.6
0.2
15.9
12.6
7.1
1.5
7.7
10.6
-0.5
7.1
24.1
29.1
16.6
8.8
-7.7
-9.5
-5.2
-5.1
-4.5
3.0
0.9
-7.2
-11.5
30.3
-0.6
-4.6
4.4
1.9
11.1
-14.6
-11.5
10.7
4.4
2.6
19.3
8.6
4.4
-9.3
-1.8
1.9
8.0
12M (%)
18.9
26.9
23.4
5.4
8.2
97.2
-16.9
20.0
89.2
18.4
-4.4
14.0
-4.6
42.9
88.3
19.4
-2.1
-21.5
65.8
-18.8
-43.4
38.4
50.2
11.0
-17.9
5.6
-5.4
-30.9
-4.2
-13.2
-39.4
-24.4
-28.2
-36.9
-46.4
-30.1
-15.1
2.9
-16.5
-10.1
-3.3
-3.0
54.6
53.6
-13.5
-13.5
35.6
24.1
-29.2
0.3
Company
Oil & Gas
Aegis Logistics
BPCL
GAIL
Gujarat Gas
Gujarat St. Pet.
HPCL
IOC
IGL
Mahanagar Gas
MRPL
Oil India
ONGC
PLNG
Reliance Ind.
Retail
Jubilant Food
Titan Co.
Technology
Cyient
HCL Tech.
Hexaware
Infosys
KPIT Tech
Mindtree
Mphasis
NIIT Tech
Persistent Sys
Tata Elxsi
TCS
Tech Mah
Wipro
Zensar Tech
Telecom
Bharti Airtel
Bharti Infratel
Idea Cellular
Tata Comm
Utiltites
Coal India
CESC
JSW Energy
NHPC Ltd
NTPC
Power Grid
Tata Power
Others
Arvind
Avenue Super.
BSE
Castrol India
Coromandel Intl
Delta Corp
Interglobe
Indo Count
1 Day (%)
-0.9
1.0
3.5
-1.2
-1.0
0.6
0.0
0.9
-0.1
1.2
-0.4
-1.4
1.8
1.3
-0.4
0.0
3.1
-1.1
-0.2
0.7
-0.5
0.3
-0.4
1.0
2.6
0.9
0.2
-0.3
1.1
-2.7
5.0
2.6
0.6
2.1
0.9
-0.4
1.2
2.2
0.5
-1.7
0.5
2.1
0.0
-0.3
0.5
-0.3
1.7
3.3
0.8
1M (%)
-12.2
-9.1
0.8
-8.9
-3.9
-12.3
-7.7
-7.5
-11.0
-4.7
-3.2
3.0
5.4
7.9
-5.3
-6.3
17.6
11.1
-6.7
7.1
1.5
22.7
4.1
7.7
0.8
-1.6
5.7
17.2
16.9
34.9
2.5
-2.6
-14.6
-9.4
3.8
7.9
4.2
5.9
6.8
3.5
7.1
-2.5
-3.9
-7.8
-3.6
-4.3
1.4
-12.6
-7.2
12M (%)
0.8
-32.0
32.0
-14.1
0.1
-46.1
-28.7
5.2
-24.1
-42.4
1.2
5.9
7.5
55.9
103.1
35.9
50.2
25.3
62.8
63.7
165.3
160.1
104.2
171.8
40.9
52.2
69.2
81.0
8.4
104.4
-1.7
-24.9
-41.9
-21.0
12.9
-3.4
4.3
-8.8
-0.1
-9.3
-3.3
-1.4
45.5
-26.5
-21.0
-5.5
45.1
-25.5
-36.8
10 September 2018
23
 Motilal Oswal Financial Services
MOSL Universe stock performance
Company
Info Edge
Kaveri Seed
MCX
Navneet Educat.
Oberoi Realty
Phoenix Mills
PI Inds.
Piramal Enterp.
Quess Corp
SRF
S H Kelkar
Tata Chemicals
Team Lease Serv.
Trident
UPL
1 Day (%)
-0.6
0.5
0.4
-2.0
1.1
0.0
-0.4
0.7
3.6
1.4
-1.4
2.4
0.7
-0.4
1.2
1M (%)
10.1
7.2
-12.5
9.2
-5.0
-6.5
1.3
4.7
-3.3
10.1
18.5
13.7
0.9
0.3
10.2
12M (%)
67.3
16.1
-30.4
-20.8
5.4
24.2
5.4
13.3
14.2
30.0
-12.5
23.3
48.1
-32.4
-13.4
10 September 2018
24
 Motilal Oswal Financial Services
THEMATIC/STRATEGY RESEARCH GALLERY
 Motilal Oswal Financial Services
REPORT GALLERY
RECENT INITIATING COVERAGE REPORTS
.
Rs
 Motilal Oswal Financial Services
DIFFERENTIATED PRODUCT GALLERY
 Motilal Oswal Financial Services
Explanation of Investment Rating
Investment Rating
BUY
SELL
NEUTRAL
UNDER REVIEW
NOT RATED
Expected return (over 12-month)
>=15%
< - 10%
> - 10 % to 15%
Rating may undergo a change
We have forward looking estimates for the stock but we refrain from assigning recommendation
*In case the recommendation given by the Research Analyst becomes inconsistent with the investment rating legend, the Research Analyst shall within 28 days of the inconsistency, take appropriate measures to make the recommendation consistent with the investment rating legend.
Disclosures:
The following Disclosures are being made in compliance with the SEBI Research Analyst Regulations 2014 (herein after referred to as the Regulations).
Motilal Oswal Securities Ltd. (MOSL*
)
is a SEBI Registered Research Analyst having registration no. INH000000412. MOSL, the Research Entity (RE) as defined in the Regulations, is engaged in the business of providing Stock broking services,
Investment Advisory Services, Depository participant services & distribution of various financial products. MOSL is a subsidiary company of Motilal Oswal Financial Service Ltd. (MOFSL). MOFSL is a listed public company, the details in respect of
which are available on
www.motilaloswal.com.
MOSL is registered with the Securities & Exchange Board of India (SEBI) and is a registered Trading Member with National Stock Exchange of India Ltd. (NSE) and BSE Limited (BSE), Multi
Commodity Exchange of India (MCX) & National Commodity & Derivatives Exchange Ltd. (NCDEX) for its stock broking activities & is Depository participant with Central Depository Services Limited (CDSL) & National Securities Depository Limited
(NSDL) and is member of Association of Mutual Funds of India (AMFI) for distribution of financial products. Details of associate entities of Motilal Oswal Securities Limited are available on the website at
http://onlinereports.motilaloswal.com/Dormant/documents/Associate%20Details.pdf
MOSL, it’s associates, Research Analyst or their relative may have any financial interest in the subject company. MOSL and/or its associates and/or Research Analyst may have actual/beneficial ownership of 1% or more securities in the subject
company at the end of the month immediately preceding the date of publication of the Research Report.
MOSL and its associate company(ies), their directors and Research Analyst and their relatives may; (a) from time to time, have a long or short
position in, act as principal in, and buy or sell the securities or derivatives thereof of companies mentioned herein. (b) be engaged in any other transaction involving such securities and earn brokerage or other compensation or act as a market maker
in the financial instruments of the company(ies) discussed herein or act as an advisor or lender/borrower to such company(ies) or may have any other potential conflict of interests with respect to any recommendation and other related information and
opinions.; however the same shall have no bearing whatsoever on the specific recommendations made by the analyst(s), as the recommendations made by the analyst(s) are completely independent of the views of the associates of MOSL even
though there might exist an inherent conflict of interest in some of the stocks mentioned in the research report.
Research Analyst may have served as director/officer, etc. in the subject company in the last 12 month period. MOSL and/or its
associates may have received any compensation from the subject company in the past 12 months.
In the last 12 months period ending on the last day of the month immediately preceding the date of publication of this research report, MOSL or any of its associates may have:
a)
managed or co-managed public offering of securities from subject company of this research report,
b)
received compensation for investment banking or merchant banking or brokerage services from subject company of this research report,
c)
received compensation for products or services other than investment banking or merchant banking or brokerage services from the subject company of this research report.
d)
Subject Company may have been a client of MOSL or its associates during twelve months preceding the date of distribution of the research report.
MOSL and it’s associates have not received any compensation or other benefits from the subject company or third party in connection with the research report. To enhance transparency, MOSL has incorporated a Disclosure of Interest Statement in
this document. This should, however, not be treated as endorsement of the views expressed in the report. MOSL and / or its affiliates do and seek to do business including investment banking with companies covered in its research reports. As a
result, the recipients of this report should be aware that MOSL may have a potential conflict of interest that may affect the objectivity of this report. Compensation of Research Analysts is not based on any specific merchant banking, investment
banking or brokerage service transactions.
Terms & Conditions:
This report has been prepared by MOSL and is meant for sole use by the recipient and not for circulation. The report and information contained herein is strictly confidential and may not be altered in any way, transmitted to, copied or distributed, in
part or in whole, to any other person or to the media or reproduced in any form, without prior written consent of MOSL. The report is based on the facts, figures and information that are considered true, correct, reliable and accurate. The intent of this
report is not recommendatory in nature. The information is obtained from publicly available media or other sources believed to be reliable. Such information has not been independently verified and no guaranty, representation of warranty, express or
implied, is made as to its accuracy, completeness or correctness. All such information and opinions are subject to change without notice. The report is prepared solely for informational purpose and does not constitute an offer document or solicitation
of offer to buy or sell or subscribe for securities or other financial instruments for the clients. Though disseminated to all the customers simultaneously, not all customers may receive this report at the same time. MOSL will not treat recipients as
customers by virtue of their receiving this report.
Analyst Certification
The views expressed in this research report accurately reflect the personal views of the analyst(s) about the subject securities or issues, and no part of the compensation of the research analyst(s) was, is, or will be directly or indirectly related to the
specific recommendations and views expressed by research analyst(s) in this report.
Disclosure of Interest Statement
Analyst ownership of the stock
Companies where there is interest
No
A graph of daily closing prices of securities is available at
www.nseindia.com, www.bseindia.com.
Research Analyst views on Subject Company may vary based on Fundamental research and Technical Research. Proprietary trading desk of MOSL or
its associates maintains arm’s length distance with Research Team as all the activities are segregated from MOSL research activity and therefore it can have an independent view with regards to subject company for which Research Team have
expressed their views.
Regional Disclosures (outside India)
This report is not directed or intended for distribution to or use by any person or entity resident in a state, country or any jurisdiction, where such distribution, publication, availability or use would be contrary to law, regulation or which would subject
MOSL & its group companies to registration or licensing requirements within such jurisdictions.
For Hong Kong:
This report is distributed in Hong Kong by Motilal Oswal capital Markets (Hong Kong) Private Limited, a licensed corporation (CE AYY-301) licensed and regulated by the Hong Kong Securities and Futures Commission (SFC) pursuant to the
Securities and Futures Ordinance (Chapter 571 of the Laws of Hong Kong) “SFO”. As per SEBI (Research Analyst Regulations) 2014 Motilal Oswal Securities (SEBI Reg No. INH000000412) has an agreement with Motilal Oswal capital Markets
(Hong Kong) Private Limited for distribution of research report in Hong Kong. This report is intended for distribution only to “Professional Investors” as defined in Part I of Schedule 1 to SFO. Any investment or investment activity to which this
document relates is only available to professional investor and will be engaged only with professional investors.” Nothing here is an offer or solicitation of these securities, products and services in any jurisdiction where their offer or sale is not
qualified or exempt from registration. The Indian Analyst(s) who compile this report is/are not located in Hong Kong & are not conducting Research Analysis in Hong Kong.
For U.S.
Motilal Oswal Securities Limited (MOSL) is not a registered broker - dealer under the U.S. Securities Exchange Act of 1934, as amended (the"1934 act") and under applicable state laws in the United States. In addition MOSL is not a registered
investment adviser under the U.S. Investment Advisers Act of 1940, as amended (the "Advisers Act" and together with the 1934 Act, the "Acts), and under applicable state laws in the United States. Accordingly, in the absence of specific exemption
under the Acts, any brokerage and investment services provided by MOSL, including the products and services described herein are not available to or intended for U.S. persons. This report is intended for distribution only to "Major Institutional
Investors" as defined by Rule 15a-6(b)(4) of the Exchange Act and interpretations thereof by SEC (henceforth referred to as "major institutional investors"). This document must not be acted on or relied on by persons who are not major institutional
investors. Any investment or investment activity to which this document relates is only available to major institutional investors and will be engaged in only with major institutional investors. In reliance on the exemption from registration provided by
Rule 15a-6 of the U.S. Securities Exchange Act of 1934, as amended (the "Exchange Act") and interpretations thereof by the U.S. Securities and Exchange Commission ("SEC") in order to conduct business with Institutional Investors based in the
U.S., MOSL has entered into a chaperoning agreement with a U.S. registered broker-dealer, Motilal Oswal Securities International Private Limited. ("MOSIPL"). Any business interaction pursuant to this report will have to be executed within the
provisions of this chaperoning agreement.
The Research Analysts contributing to the report may not be registered /qualified as research analyst with FINRA. Such research analyst may not be associated persons of the U.S. registered broker-dealer, MOSIPL, and therefore, may not be
subject to NASD rule 2711 and NYSE Rule 472 restrictions on communication with a subject company, public appearances and trading securities held by a research analyst account.
For Singapore
In Singapore, this report is being distributed by Motilal Oswal Capital Markets Singapore Pte Ltd (“MOCMSPL”) (Co.Reg. NO. 201129401Z) which is a holder of a capital markets services license and an exempt financial adviser in Singapore,
as per the approved agreement under Paragraph 9 of Third Schedule of Securities and Futures Act (CAP 289) and Paragraph 11 of First Schedule of Financial Advisors Act (CAP 110) provided to MOCMSPL by Monetary Authority of Singapore.
Persons in Singapore should contact MOCMSPL in respect of any matter arising from, or in connection with this report/publication/communication. This report is distributed solely to persons who qualify as “Institutional Investors”, of which some of
whom may consist of "accredited" institutional investors as defined in section 4A(1) of the Securities and Futures Act, Chapter 289 of Singapore (“the SFA”). Accordingly, if a Singapore person is not or ceases to be such an institutional investor, such
Singapore Person must immediately discontinue any use of this Report and inform MOCMSPL.
Disclaimer:
The report and information contained herein is strictly confidential and meant solely for the selected recipient and may not be altered in any way, transmitted to, copied or distributed, in part or in whole, to any other person or to the media or
reproduced in any form, without prior written consent. This report and information herein is solely for informational purpose and may not be used or considered as an offer document or solicitation of offer to buy or sell or subscribe for securities or
other financial instruments. Nothing in this report constitutes investment, legal, accounting and tax advice or a representation that any investment or strategy is suitable or appropriate to your specific circumstances. The securities discussed and
opinions expressed in this report may not be suitable for all investors, who must make their own investment decisions, based on their own investment objectives, financial positions and needs of specific recipient. This may not be taken in substitution
for the exercise of independent judgment by any recipient. Each recipient of this document should make such investigations as it deems necessary to arrive at an independent evaluation of an investment in the securities of companies referred to in
this document (including the merits and risks involved), and should consult its own advisors to determine the merits and risks of such an investment. The investment discussed or views expressed may not be suitable for all investors. Certain
transactions -including those involving futures, options, another derivative products as well as non-investment grade securities - involve substantial risk and are not suitable for all investors. No representation or warranty, express or implied, is made
as to the accuracy, completeness or fairness of the information and opinions contained in this document. The Disclosures of Interest Statement incorporated in this document is provided solely to enhance the transparency and should not be treated
as endorsement of the views expressed in the report. This information is subject to change without any prior notice. The Company reserves the right to make modifications and alternations to this statement as may be required from time to time
without any prior approval. MOSL, its associates, their directors and the employees may from time to time, effect or have effected an own account transaction in, or deal as principal or agent in or for the securities mentioned in this document. They
may perform or seek to perform investment banking or other services for, or solicit investment banking or other business from, any company referred to in this report. Each of these entities functions as a separate, distinct and independent of each
other. The recipient should take this into account before interpreting the document. This report has been prepared on the basis of information that is already available in publicly accessible media or developed through analysis of MOSL. The views
expressed are those of the analyst, and the Company may or may not subscribe to all the views expressed therein. This document is being supplied to you solely for your information and may not be reproduced, redistributed or passed on, directly or
indirectly, to any other person or published, copied, in whole or in part, for any purpose. This report is not directed or intended for distribution to, or use by, any person or entity who is a citizen or resident of or located in any locality, state, country or
other jurisdiction, where such distribution, publication, availability or use would be contrary to law, regulation or which would subject MOSL to any registration or licensing requirement within such jurisdiction. The securities described herein may or
may not be eligible for sale in all jurisdictions or to certain category of investors. Persons in whose possession this document may come are required to inform themselves of and to observe such restriction. Neither the Firm, not its directors,
employees, agents or representatives shall be liable for any damages whether direct or indirect, incidental, special or consequential including lost revenue or lost profits that may arise from or in connection with the use of the information.
The person
accessing this information specifically agrees to exempt MOSL or any of its affiliates or employees from, any and all responsibility/liability arising from such misuse and agrees not to hold MOSL or any of its affiliates or employees responsible for any
such misuse and further agrees to hold MOSL or any of its affiliates or employees free and harmless from all losses, costs, damages, expenses that may be suffered by the person accessing this information due to any errors and delays.
Registered Office Address: Motilal Oswal Tower, Rahimtullah Sayani Road, Opposite Parel ST Depot, Prabhadevi, Mumbai-400025; Tel No.: 022-3980 4263; www.motilaloswal.com. Correspondence Address: Palm Spring Centre, 2nd Floor, Palm
Court Complex, New Link Road, Malad (West), Mumbai- 400 064. Tel No: 022 3080 1000. Compliance Officer: Neeraj Agarwal, Email Id:
na@motilaloswal.com,
Contact No.:022-30801085.
Registration details of group entities: MOSL: SEBI Registration: INZ000158836 (BSE/NSE/MCX/NCDEX); CDSL: IN-DP-16-2015; NSDL: IN-DP-NSDL-152-2000; Research Analyst: INH000000412. AMFI: ARN 17397. Investment Adviser:
INA000007100. Motilal Oswal Asset Management Company Ltd. (MOAMC): PMS (Registration No.: INP000000670) offers PMS and Mutual Funds products. Motilal Oswal Wealth Management Ltd. (MOWML): PMS (Registration No.: INP000004409)
offers wealth management solutions. *Motilal Oswal Securities Ltd. is a distributor of Mutual Funds, PMS, Fixed Deposit, Bond, NCDs, Insurance and IPO products. * Motilal Oswal Commodities Broker Pvt. Ltd. offers Commodities Products. * Motilal
Oswal Real Estate Investment Advisors II Pvt. Ltd. offers Real Estate products. * Motilal Oswal Private Equity Investment Advisors Pvt. Ltd. offers Private Equity products
*MOSL
has been amalgamated with Motilal Oswal Financial Services Limited (MOFSL) w.e.f August 21, 2018 pursuant to order dated July 30, 2018 issued by Hon'ble National Company Law Tribunal, Mumbai Bench. The existing registration no(s) of
MOSL would be used until receipt of new MOFSL registration numbers.
10 September 2018
26