*
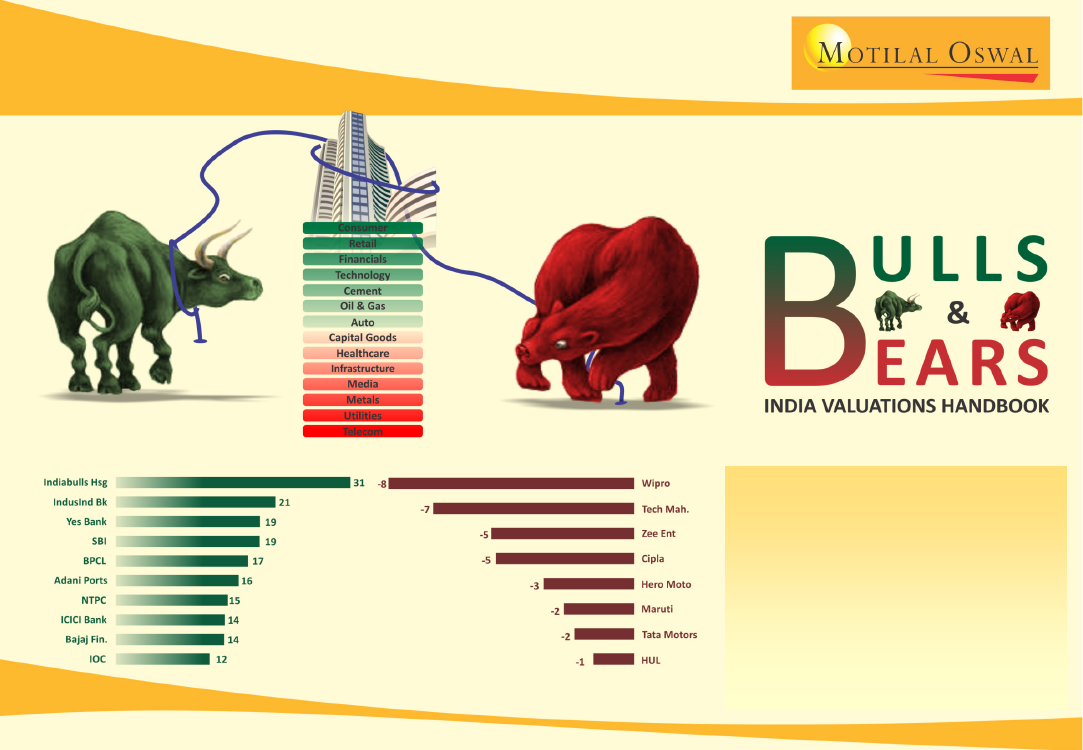
* Sectors in order of premium /
discount to historical averages
BEST PERFORMERS MoM (%)
WORST PERFORMERS MoM (%)
Highlights of Mar’19 edition
Nifty gains strength toward year-end —
up 15% in FY19
Banks and Technology top
outperformers of FY19
Mid-cap significantly underperform
large cap in FY19
FII flows weakest in 3 years
Research & Quant Team (Deven@MotilalOswal.com); +91 22 6129 1575
April 2019
 Motilal Oswal Financial Services
Contents
Strategy:
Markets – Nifty wraps up best month in three years
Valuation deep-dive for the month:
Consumer
Indian equities:
Nifty, sector performance and key valuation metrics
Global equities:
Performance and valuation snapshot
Valuations:
Nifty/Mid-cap companies
Sector highlights:
Overview and sector valuations
NOTES:
Prices as on 29
th
Mar’19
BULL icon:
Sectors trading
at a premium to
historical averages
BEAR icon:
Sectors trading
at a discount to historical
averages
AUTO
BANKS / FINANCIALS
CAPITAL GOODS
CEMENT
CONSUMER
HEALTHCARE
INFRASTRUCTURE
MEDIA
METALS
OIL & GAS
RETAIL
TECHNOLOGY
TELECOM
UTILITIES
Valuations are on
12-month forward basis
unless otherwise
mentioned
Sector valuations are
based on MOSL coverage
companies
Global equities data
sourced from Bloomberg;
Nifty valuations based on
MOSL estimates
Investors are advised to refer to important disclosures made at the end of this report.
BULLS & BEARS | April 2019
2
 Motilal Oswal Financial Services
Strategy:
Markets – Nifty wraps up best month in three years
Markets bid adieu to FY19 in style:
There couldn’t have been a better finish to FY19 as the Nifty rallied by an impressive 7.7% in March to close at 11,624
(+15% YoY), within a whisker of an all-time high. The last time the benchmark did this well in a month was way back three years ago. Supportive global
backdrop (dovish central bank narrative in the US), a deluge of FII flows and the rising confidence in the NDA making a comeback in the center post
elections all had enough spark to light the market rally. At USD4.8b, FII inflows in March were highest since Mar’17. DIIs, meanwhile, sold USD2b. In FY19,
the Nifty Midcap100 (-2.7% YoY) underperformed the Nifty (+14.9% YoY) significantly, largely due to the unsustainable valuation premium of mid-caps to
large-caps and the lack of pick-up in earnings growth. Currently, valuation premium of mid-caps versus large-caps stands at 5%.
Macros largely stable in March:
Indian macros have been stable, with currency, crude and 10-year bond yields moving in a narrow range. The dovish
global central bank narrative augurs well for emerging markets like India. Consistent low inflation print will likely lead to another rate cut in the RBI policy
decision on 4th April, in our view. Post the bold aerial strikes carried out by India in response to the Pulwama terror attack in Feb’19, Mr Modi’s popularity
ratings have seen an uptick and several opinion polls have predicted a return of the current government, albeit with a reduced majority. This has acted as
a trigger for markets, which is looking for continuity of policy reform initiatives and strong decision making, in our view.
India top performer among global markets:
In March, India (+8%), China (+5%), the UK (+3%), Taiwan (+2%), the US (+2%) and MSCI EM (+1%) were the
key global markets to close higher in local currency terms. On the other hand, Korea (-2%) and Japan (-1%) were down MoM. Over the last 12 months,
MSCI India (+12%) has outperformed MSCI EM (-10%). Notably, over the last five years, MSCI India has outperformed MSCI EM by 168%. MSCI India’s P/E
is at a premium of 106% to MSCI EM’s P/E, above its historical average premium of 47%.
Sectoral trends for FY19 – Banks, Technology, Consumer and Healthcare top performers:
Private Banks (+34%), PSU Banks (+28%), Technology (+26%),
Consumer (+14%) and Healthcare (+10%) were the top performers for FY19. Media (-25%), Autos (-22%) and Metals (-15%) were laggards in FY19. Bajaj
Finance (+71%), Reliance Industries (+54%), Axis Bank (+52%), ICICI Bank (+43%) and TCS (+40%) were the top performers. Vedanta (-14%), SBI (-8%),
Hindalco (-6%), M&M (-5%) and HPCL (-4%) were the top laggards. In this edition of ‘Bulls & Bears,’ we take a deep dive into the valuation metrics of the
Consumer sector.
Sectoral trends for March – Banks, Telecom, Real Estate, Utilities and Oil top performers:
PSU Banks (+22%), Telecom (+20%), Real Estate (+16%), Private
Banks (+11%), Utilities (+11%) and Oil (+11%) were the top positive performers for the month of March. Media (-1%) was only negative performer for the
month. Indiabulls Hsg (+31%), IndusInd Bank (+21%), Yes Bank (+19%), SBI (+19%) and BPCL (+17%) were the top performers on an MoM basis. Wipro (-
8%), Tech Mahindra (-7%), Zee Ent (-5%), Cipla (-5%) and Hero Moto (-3%) were the top laggards.
Politics to override fundamentals until May:
The near-term direction of the market will be decided by developments on the political front, in our view.
That said, we believe that the divergence of mid-caps v/s large-caps has gone too far, and accordingly, highlighted our view along with our preferred 15
mid- and small-cap ideas in our report published on
6
th
March.
Fundamentally, after tepid four years, earnings appear set for a recovery, especially led by
Banking (with credit growth pick-up, return of pricing power, moderation in fresh slippages and lower credit costs). This should drive profit and RoE
recovery for Corporate Banks, which remains our preferred bet. We maintain a positive view on Consumption, even as commentaries from consumer
companies have pointed toward incremental moderation. Automobile monthly numbers remain weak, but valuations have turned incrementally more
attractive for sectoral names and present an opportunity to increase exposure from a medium- to long-term perspective. We like IT given its sustained
healthy earnings growth, favorable deal activity and reasonable valuations. After the recent rally, a potential upside in some heavyweights like RIL appears
limited – we have accordingly downgraded our rating on RIL to Neutral.
Top ideas: Large-cap bets:
ICICI Bank, Axis Bank, Titan, Maruti, Bharti Airtel, Infosys, M&M, Coal India and SBI.
Mid-cap bets:
LIC Housing Finance, Federal
Bank, DCB, Godrej Agrovet, Indian Hotels, Page, Crompton Consumer, MMFS, Oberoi Realty and Ashoka Buildcon.
BULLS & BEARS | April 2019
3
 Motilal Oswal Financial Services
Valuation deep-dive for the month: Consumer
Valuation multiples of consumer companies have been contracting, with
P/E down 14% from its peak of 46.6x in Aug’18 to 40x in Mar’19.
Nevertheless, the P/E multiple is still above the five-year average and
also well above the 10- and 15-year averages. We note that, compared
to other sectors, consumer sector earnings are relatively less vulnerable
to shocks and companies command relatively high RoCEs and cash
flows. Against this backdrop, such high multiples are not surprising.
The sector has always traded at a premium to the Nifty (~77% average
premium over the past 15 years on a one-year forward P/E basis),
barring a brief convergence over Oct-Dec’07 and again in May’09. A
peak premium of ~142% was attained in July’13. Since Mar’18, the
consumer sector premium on a one-year forward P/E basis to the Nifty
has remained over 100% and peaked at 129.1% at end-Dec’18. While
Nifty P/E has remained largely flat over the past three months, the
appetite for defensives – albeit still healthy – has declined slightly from
the peak levels to 118.6% at end-Mar’19.
The sector’s earnings growth prospects remain attractive – we expect
average earnings growth of ~19% in FY20 for our coverage universe –
similar to FY19. A benign commodity cost environment will also support
EPS growth over the next few quarters. Pick-up in the pace of new
launches recently and the healthy pipeline are more of an indication of
stable demand. Rural continues to do well and is likely to be a big driver
of incremental growth, particularly once the budget proposals are
implemented. While the structural story for the sector remains strong,
factors like incremental INR depreciation (which will lead to more
interest in other defensives like IT and pharma), possible increase in ‘risk
on’, monsoon spread in the current year and the outcome of elections
could have an impact on the multiple premium to the Nifty, in our view.
Trend in Consumer PE (x) – one year forward
51.0
39.0
27.0
15.0
3.0
Consumer P/E (x)
5 Yr Avg (x)
10 Yr Avg (x)
15 Yr Avg (x)
40.0
29.0
38.4
32.8
Trend in Consumer v/s Nifty P/E (x)
62.0
47.0
32.0
17.0
2.0
Consumer P/E (x)
Nifty PE (x)
40.0
18.5
Consumer P/E relative to Nifty P/E
160.0
120.0
80.0
40.0
0.0
Consumer Relative to Nifty PE (%)
15 Yr Avg (x)
116.1
76.7
BULLS & BEARS | April 2019
4
 Motilal Oswal Financial Services
Key highlights
Indian equities:
Gains strength toward year-end — up 15% in FY19
After rallying by 6.7% (FY19 YTD) up to Feb’19, the Nifty extended its gains in Mar’19 (up meaningfully by
7.7% in the month – highest MoM rise in 36 months) to end FY19 at 11,624 (+14.9% YoY).
Sector-wise, Private Banks (+34%), PSU Banks (+28%), Technology (+26%), Consumer (+14%) and Healthcare
(+10%) were the top gainers for FY19. Media (-25%), Autos (-22%), Metals (-15%) were top losers for the
fiscal.
Stock performance:
Breadth mixed in FY19 – 28 Nifty stocks close higher
Bajaj Finance (+71%), Reliance Industries (+54%), Axis Bank (+52%), ICICI Bank (+43%) and TCS (+40%) were
the top performers.
Tata Motors (-47%), Vedanta (-34%), Indiabulls Hsg (-31%), Hero Moto (-28%) and Eicher (-28%) were the
top laggards.
Global equities:
India best-performing market in March
In March, India (+8%), China (+5%), the UK (+3%), Taiwan (+2%), the US (+2%) and MSCI EM (+1%) were the
key global markets to close higher in local currency terms. On the other hand, Korea (-2%) and Japan (-1%)
were down MoM.
Over the last 12 months, MSCI India (+12%) has outperformed MSCI EM (-10%). Notably, over the last five
years, MSCI India has outperformed MSCI EM by 168%. MSCI India’s P/E is at a premium of 106% to MSCI
EM’s P/E, above its historical average premium of 47%.
India’s share in the world market cap is at 2.8%, above its historical average of 2.5%.
Sector valuations:
Financials outperform; Technology, Autos underperform in March
PSBs are trading at a P/B of 1.0x, in line with the historical average of 0.9x. Valuations for PSBs have
recovered gradually on the back of recent capital infusion by the government and prospects of stronger
earnings. Overall valuations still remain in line with the long-term average. An earnings bounce-back is
anticipated from FY20.
Technology trades at a P/E of 18.5x, at a 13% premium to the historical average of 16.4x. Our interaction
with various companies last month indicates sustained momentum in deal activity as of now, but the threat
of unpleasant macros is also not unreal. Valuations for mid-cap IT have cooled off in comparison to larger
peers in 9MFY19. Tier-II IT trades at a 17% discount to Tier-I P/E (notably, it was trading at a peak premium
of 12% nine months ago).
About the product
As the tagline suggests,
BULLS & BEARS
is a
handbook on valuations in
India. Every month, it will
cover:
Valuations of Indian
markets vis-à-vis global
markets
Current valuation of
companies in various
sectors
Sectors that are
currently valued at
premium/discount to
their historical long-
period averages
BULLS & BEARS | April 2019
5
 Motilal Oswal Financial Services
Indian equities:
Nifty gains strength toward year-end — up 15% in FY19
After rallying by 6.7% (FY19 YTD) up to Feb’19, the Nifty
extended its gains in Mar’19 (up meaningfully by 7.7% in the
month – highest MoM rise in 36 months) to end FY19 at
11,624 (+14.9% YoY).
Notably, mid-caps (-2.7%, YoY) significantly underperformed
large-caps in FY19. This underperformance can largely be
attributed to their unsustainable valuation premium to
large-caps and the lack of pick-up in earnings growth.
DIIs remained buyers in FY19 – USD10.3b v/s USD17.7b in
FY18.
FII flows were muted at USD0.2b in FY19 – weakest in three
years.
Nifty YoY change (%)— ends with 15% positive return in FY19
5 years of negative return in
1990s cycle
4 year of negative return in
2000s cycle
2 year of negative return till
now in 2011 cycle
244
78
15
-16 0 -2
-3
42
-2
-25 -13
81
15
67
12 24
-36
74
11
-9
27
7 18
-9
19 10 15
-48
Institutional flows (USD b) — domestic flows remain strong
Net FII Flows (USD b)
5.1
23.4 25.0
13.1
-10.4
-4.1
8.5
-0.9
-12.7
25.8
4.5
13.7 18.1
-8.9
-3.7
12.1
-1.5
8.3
3.2
17.7
10.3
0.2
Net DII Flows (USD b)
Nifty MoM change (%) — highest MoM rise in 36 months
10.8
5.8
5.6
6.2
Nifty MoM Change (%)
6.0
2.9
7.7
4.7
4.0 4.2
1.7
1.4 1.6
4.6
3.7
3.3 3.4
1.4
0.2
0.5
4.7
4.7
3.0
2.0
1.0 1.6 1.3 1.1
3.6
4.9
0.0 0.2
5.0
6.4
0.10.30.4
FY09 FY10 FY11 FY12 FY13 FY14 FY15 FY16 FY17 FY18 FY19
BULLS & BEARS | April 2019
6
 Motilal Oswal Financial Services
Indian equities:
Banks (Private and PSU) and Technology outperformers
Private Banks (+34%), PSU Banks (+28%), Technology (+26%), Consumer (+14%) and Healthcare (+10%) were the top performers for FY19.
Private Banks delivered positive returns in 8 out of the 12 months, while PSU Banks and Technology delivered positive returns in 7 months.
Mid-caps (-2.7%, YoY) significantly underperformed large-caps in FY19.
Media (-25%), Autos (-22%) and Metals (-15%) were the biggest underperformers in FY19 – these sectors delivered 8, 6 and 8 months of negative
returns, respectively.
Sectoral performance—absolute and relative to Nifty (%)—Banks and Technology top outperformers
Sector
Banks-Pvt
Banks-PSU
Technology
Consumer
Healthcare
NBFC
Oil
Cap. Goods
Nifty Midcap
Cement
Utilities
Telecom
Real Estate
Metal
Auto
Media
Nifty-50
MoM Abs. Performance (%)
FY19
Apr- May- Jun- Jul- Aug- Sep- Oct- Nov- Dec- Jan- Feb- Mar- Chg
18
18
18 18 18
18
18
18
18
19
19
19
(%)
5
8
-2
4
3
-6
-1
8
1
1
-2
11
34
0
12
10
8
5
-1
6
8
5
5
0
9
7
7
3
6
4
-1
0
-8
-5
0
-4
-7
-10
-5
-8
-8
-5
-5
-2
0
-6
3
-1
8
1
-5
-7
-4
0
-9
0
-7
-4
-3
-8
0
15
4
7
1
6
10
5
4
8
1
1
1
-3
3
-3
6
4
7
6
12
-3
0
4
6
6
8
-2
2
9
1
-3
3
-18
1
-10
-6
-11
-1
-10
-14
-8
-10
-4
-20
-4
-13
-15
-6
9
-7
-3
-2
4
-11
2
0
-14
1
-11
-1
-6
-7
3
-5
1
-2
5
-3
9
0
7
2
10
-2
4
7
-6
5
2
5
7
-1
2
-3
3
4
1
2
0
5
1
0
0
0
-1
0
-2
8
-2
0
-4
-1
-8
-5
-11
-6
-6
-1
-7
-11
-17
0
-5
0
-2
-1
-1
1
-1
-1
6
-3
2
1
-2
2
18
0
22
0
3
5
8
11
8
9
9
11
20
16
5
0
-1
8
28
26
14
10
9
4
0
-3
-4
-4
-6
-7
-15
-22
-25
15
MoM Relative Performance (%)
FY19
Apr- May- Jun- Jul- Aug- Sep- Oct- Nov- Dec- Jan- Feb- Mar- Chg
18
18
18 18 18
18
18
18
18
19
19
19
(%)
-1
8
-2
-2
0
0
4
3
1
2
-1
4
19
-7
6
4
1
-1
-7
0
2
-2
-1
-6
3
1
1
-4
4
-1
0
-8
-5
0
-4
-7
-10
-5
-8
-8
-5
-5
-2
-6
4
0
8
1
-5
-7
-4
0
-8
0
-7
-4
-2
-8
9
-2
1
-5
0
4
-1
-2
2
-5
-5
-5
-9
-3
-9
1
4
3
9
-5
-2
1
3
3
6
-5
-1
6
-2
-6
-12
7
-4
1
-5
5
-4
-7
-1
-3
2
-14
2
-7
-8
14
-2
2
3
8
-6
7
5
-9
6
-6
4
-1
-2
8
-3
-6
0
-7
4
-5
2
-3
5
-7
-1
2
-10
0
-3
7
-1
2
-3
3
4
1
2
0
5
1
0
0
0
0
-1
9
-2
0
-4
-1
-8
-5
-10
-6
-6
-1
-7
-11
-17
-5
0
-2
-1
-1
2
-1
-1
6
-2
2
2
-1
2
18
15
-8
-4
-3
0
3
0
1
1
4
13
8
-2
-8
-8
13
11
-1
-5
-6
-10
-15
-18
-19
-19
-21
-22
-30
-37
-40
BULLS & BEARS | April 2019
7
 Motilal Oswal Financial Services
Indian equities:
Breadth mixed in FY19 – 28 Nifty stocks close higher
Nifty – best and worst performers in FY19:
Bajaj Finance (+71%), Reliance Industries (+54%), Axis Bank (+52%), ICICI Bank (+43%) and TCS (+40%)
were the top performers. Tata Motors (-47%), Vedanta (-34%), Indiabulls Hsg (-31%), Hero Moto (-28%) and Eicher (-28%) were the worst performers.
Nifty – best and worst performers in March:
Indiabulls Hsg (+31%), Indusind Bank (+21%), Yes Bank (+19%), SBI (+19%) and BPCL (+17%) were the top
performers on an MoM basis. Wipro (-8%), Tech Mahindra (-7%), Zee Ent (-5%), Cipla (-5%) and Hero Moto (-3%) were the top laggards.
71
Best and worst Nifty performers (YoY) in FY19 (%) – 28 companies in Nifty delivered positive returns
54 52
43 40 36
33 33 31 31 28 28 27
24 22 22 21 21
16
15
12
8 7 6 6 5 2 2 1
-1 -3 -3 -4 -4 -7 -7 -8
-9 -9 -10 -10 -16 -17
-19 -23 -25
-28 -28-31 -34
-47
Best and worst Nifty performers (MoM) in Mar’19 (%) – breadth positive, 86% of Nifty stocks traded higher
31
21 19 19
17 16 15
14 14 12
11 11 11 11 10 9 9 9 9 8
8
8 7 7 7 7 7 6 5 5 5
4 4 4 4 4 3 3
2 1 1 1 1
-1 -2 -2 -3
-5 -5 -7 -8
BULLS & BEARS | April 2019
8
 Motilal Oswal Financial Services
Indian equities:
Mid-caps underperform large-caps over last 12 months
Mid-caps have struggled in FY19, resulting in their underperformance v/s large-caps. Over the last 12 months, mid-caps have corrected by 2.7%, as
against the Nifty’s rise of 14.9%. However, over the last five years, mid-caps have outperformed by 39%.
In Mar’19, Nifty Midcap100 was up 9.2%, as against the Nifty’s rise of 7.7%. Mid-caps still trade at a 5% premium to the Nifty in terms of P/E.
Mid-caps outperformed large-caps in last five years
115
290
230
Nifty Rebased
Nifty Midcap 100 Rebased
5 Year CAGR |
Nifty: 11.6% |
Midcap: 16.2%
Mid-caps underperformed large-caps in the last 12 months
120
110
100
90
80
Nifty Rebased
Nifty Midcap 100 Rebased
212
173
97
170
110
50
12-month forward P/E (x)
34
28
22
16
10
Midcap PE (x)
Nifty Avg: 19.8x
Midcap Avg: 20.8x
Nifty PE (x)
Mid-caps’ premium to Nifty drops to historical average of 5%
Midcap Vs Nifty PE Prem/(Disc) (%)
65
40
Average: 5%
19.5
18.5
15
-10
-35
5
Source: MOSL, Bloomberg for Midcap valuation.
BULLS & BEARS | April 2019
9
 Motilal Oswal Financial Services
Indian equities:
Valuations inch above long-period averages
Valuations of Indian equities are marginally above their long-period averages. The Nifty trades at a 12-month forward P/E of 18.5x, 5% premium to its
long-period average of 17.6x. Nifty’s P/B of 2.8x is also above its historical average.
At the current trailing P/E of 23.4x and forward P/E of 18.5x, we see limited triggers for further re-rating, unless accompanied by a material surprise
in earnings.
12-month forward Nifty P/E (x)
25
21
17
13
9
12.3
10 Year Avg: 17.6x
18.5
22.5
12-month forward Nifty P/B (x)
3.5
3.0
10 Year Avg: 2.6x
2.5
2.0
1.5
3.0
2.8
1.8
Trailing Nifty P/E (x)
25
21
17
13
9
23.4
10 Year Avg: 19.1x
Trailing Nifty P/B (x)
3.5
3.0
2.5
2.0
1.5
10 Year Avg: 2.8x
3.1
BULLS & BEARS | April 2019
10
 Motilal Oswal Financial Services
Indian equities:
Market-cap-to-GDP above historical average
Nifty trades at a 12-month-forward RoE of 15%, marginally above its long-term average.
Market-cap-to-GDP ratio is at 81% (FY19E GDP), marginally above its long-term average.
Trend in Nifty RoE (%)
20.7
12-month forward Nifty RoE (%)
18.0
16.5
15.0
13.5
12.0
10 Year Avg: 14.8%
15.0
16.1
17.0
14.9
16.4
16.2
15.4
14.9
Average of 15.6%
13.2
13.6
12.9
13.1
Trend in India’s market-cap-to-GDP (%) – above its long-period averages
103
95
Average of 78% for the period
71
55
64
81
66
69
80
88
85
81
BULLS & BEARS | April 2019
11
 Motilal Oswal Financial Services
Global equities:
India best-performing market in March
In Mar’19, India (+8%), China (+5%), the UK (+3%), Taiwan (+2%), the US (+2%) and MSCI EM (+1%) were the key global markets to close higher in
local currency terms. On the other hand, Korea (-2%) and Japan (-1%) were down MoM.
Indian equities are trading at 23.4x FY19E earnings. All key markets continue trading at a discount to India. However, India’s RoE remains superior to
most EMs, an important differentiator for valuation premium.
India (Nifty) v/s other markets
CY19 YTD Chg (%)
Index
Value
India
US
Indonesia
Japan
Taiwan
UK
MSCI EM
China
Brazil
Korea
Russia
11,624
2,834
6,469
21,206
10,641
7,279
1,058
3,091
95,415
2,141
4,430
Mkt Cap Local
In USD
(USD T) Currency
2.2
30.4
0.5
5.7
1.2
3.3
14.2
7.2
0.9
1.4
0.6
7
13
4
6
9
8
10
24
9
5
6
8
13
6
6
8
10
10
27
8
3
12
PE (x)
CY18 / CY19 /
FY19 FY20
23.4
18.6
21.7
15.7
15.0
17.2
12.9
14.7
15.9
11.0
5.6
18.5
17.1
15.5
15.4
15.1
13.0
12.6
11.6
11.5
11.2
5.2
-20
-7
-33
-36
-27
-45
-37
-32
-53
-76
-8
-16
-16
-18
-30
-32
-37
-38
-39
-72
Prem / Disc to India
PE (%)
CY18 / CY19 /
FY19 FY20
PB (x)
CY18 /
FY19
3.1
3.3
2.4
1.6
1.6
1.7
1.6
1.6
2.0
0.9
0.8
CY19 /
FY20
2.8
3.1
2.3
1.6
1.7
1.7
1.5
1.4
1.7
0.9
0.7
RoE (%)
CY18 /
FY19
13.1
16.0
11.1
10.4
10.9
11.0
12.8
10.8
12.4
8.2
13.9
CY19 /
FY20
15.0
19.3
17.7
10.5
12.3
10.3
12.5
11.8
15.8
6.8
12.5
Source: Bloomberg/MOFSL
MoM Chg (%)
India
China
UK
Taiwan
US
MSCI EM
Indonesia
Russia
Brazil
Japan
Korea
0
-1
-2
1
0
0
3
2
2
5
8
BULLS & BEARS | April 2019
12
 Motilal Oswal Financial Services
Global equities:
MSCI India outperforms MSCI EM over last 12 months
Over the last 12 months, MSCI India (+12%) has outperformed MSCI EM (-10%). Notably, over the last five years, MSCI India has outperformed MSCI
EM by 168%.
MSCI India’s P/E is at a premium of 106% to MSCI EM’s P/E, above its historical average premium of 47%.
MSCI India outperformed MSCI EM by 168% over last five years
450
MSCI India Rebased
10 Year CAGR:
MSCI India: 13.5%
MSCI EM: 6.4%
5 Year CAGR:
MSCI India: 9.5%
MSCI EM: 1.2%
MSCI EM Rebased
MSCI EM v/s MSCI India performance over 12 months
123
111
99
87
75
MSCI India Rebased
MSCI EM Rebased
112
90
350
250
150
50
354
186
MSCI India v/s MSCI EM trailing P/E (x)
33.0
26.0
19.0
12.0
5.0
MSCI India Avg: 20.1x
MSCI India v/s MSCI EM P/E premium (%)
MSCI EM PE (x)
120
MSCI India Vs EM PE Premium (%)
MSCI India PE (x)
106
26.8
90
60
MSCI EM Avg: 13.7x
13.0
30
0
Average of 47%
Source: Bloomberg
BULLS & BEARS | April 2019
13
 Motilal Oswal Financial Services
Global equities:
India’s share in world market cap above historical average
India’s share in the world market cap is at 2.8%, above its historical average of 2.5%.
Over the last 12 months, the world’s market cap has decreased 3.5% (USD2.8t), while India’s market cap is down 1.6%.
Market cap change in last 12 months (%)
Mkt cap chg 12M (%)
Indonesia
Average of 2.5%
Curr Mcap (USD Tr)
4
3
0.5
30.4
2.2
7.2
0.6
1.2
0.9
3.3
5.7
1.4
Trend in India's contribution to world market cap (%)
3.5
3.0
2.5
2.0
1.5
1.6
India's Contribution to World Mcap (%)
3.3
2.8
US
India
China
Russia
-6
-7
-9
-10
-10
-11
-2
Global market-cap-to-GDP (%)
157
126
117
93
83
59
51
Current mkt cap to GDP (%)
Taiwan
Brazil
UK
44
38
Japan
Korea
-18
* Based on GDP for Dec 2017
Source: Bloomberg
BULLS & BEARS | April 2019
14
 Motilal Oswal Financial Services
Nifty:
Consumer – Valuations not relenting; premium moves up in March
Consumer sector P/E of 40x (up from 39.4x in Feb’19) is at a premium of 21.8% to its 10-year average of 32.8x. On a P/B basis, the sector trades at 12.8x, a
premium of 25.6% to its 10-year average multiple of 10.2x. Consumer P/E relative to Nifty P/E has declined to 116% in Mar’19 from 125.5% in Feb’19.
Consumer companies cited a stable demand environment, with rural growing ahead of urban in the recent quarter. Launch pipeline is strong compared to
the preceding two years.
Snapshot: Nifty companies’ valuations
Name
Bajaj Auto
Eicher Motors
Hero MotoCorp
Mahindra & Mahindra
Maruti Suzuki
Tata Motors
Axis Bank
HDFC Bank
ICICI Bank
IndusInd Bank
Kotak Mahindra Bank
Yes Bank
State Bank
Bajaj Finance
HDFC
Indiabulls Housing
Larsen & Toubro
Grasim Inds
Ultratech Cement
Asian Paints
Britannia Inds.
Hind. Unilever
ITC
Sector
Auto
Auto
Auto
Auto
Auto
Auto
Banks - Private
Banks - Private
Banks - Private
Banks - Private
Banks - Private
Banks - Private
Banks - PSU
Banks - NBFC
Banks - NBFC
Banks - NBFC
Capital Goods
Cement
Cement
Consumer
Consumer
Consumer
Consumer
Current
16.5
20.5
14.1
14.2
22.9
10.1
19.6
24.2
19.8
17.8
29.0
12.2
10.7
33.9
37.9
7.8
18.9
10.6
38.0
52.6
52.1
49.8
26.5
PE (x)
Relative to Nifty P/E (%)
Current
10 Yr Avg
10 Yr Avg Prem/Disc (%)
-11
-10
15.8
4
11
28
22.5
-9
-24
-1
17.4
-19
-23
-6
16.5
-14
24
13
19.9
15
-45
-38
11.0
-8
6
65
29.1
-32
31
17
20.5
18
7
1
17.8
11
-4
-1
17.4
2
57
28
22.6
28
-34
-32
11.9
2
-42
-13
15.2
-30
84
-9
15.9
113
105
65
29.0
31
-58
-46
9.4
-17
2
32
23.1
-19
-43
-39
10.7
-1
106
61
28.2
35
184
109
36.8
43
182
85
32.5
60
170
108
36.6
36
44
49
26.2
1
Current
3.6
5.2
3.8
2.1
4.1
0.8
2.6
3.7
2.2
3.2
3.8
1.9
1.2
7.4
4.2
1.9
2.5
1.2
3.2
14.9
18.1
50.7
6.7
PB (x)
10 Yr Avg Prem/Disc (%)
5.2
-31
6.0
-14
7.1
-46
3.0
-29
3.3
23
1.9
-57
2.0
29
3.4
10
1.7
27
2.7
19
2.9
34
2.1
-10
1.2
-3
3.0
147
4.6
-7
2.3
-17
3.0
-20
1.7
-29
3.1
4
10.8
38
12.4
46
31.1
63
7.2
-7
Relative to Nifty P/B (%)
Current
10 Yr Avg
28
101
85
133
36
174
-24
16
46
29
-70
-25
-7
-22
34
32
-21
-33
15
5
38
11
-32
-18
-58
-53
167
16
52
77
-31
-10
-12
18
-57
-35
16
20
436
320
550
382
1726
1108
142
181
BULLS & BEARS | April 2019
15
 Motilal Oswal Financial Services
Nifty:
50% companies trade at a discount to historical averages
Companies trading at a significant premium to their historical averages:
Britannia (+60%), Titan (+59%), UPL (+55%), Reliance Industries (+45%) and
Asian Paints (+43%).
Companies trading at a significant discount to their historical averages:
Tata Steel (-53%), ONGC (-47%), Coal India (-42%) and NTPC (-32%) and Sun
Pharma (-29%).
Sector
Healthcare
Healthcare
Healthcare
Media
Metals
Metals
Metals
Metals
Oil & Gas
Oil & Gas
Oil & Gas
Oil & Gas
Oil & Gas
Retail
Technology
Technology
Technology
Technology
Technology
Telecom
Telecom
Utilities
Utilities
Utilities
Others
Current
21.9
21.5
20.7
22.6
7.1
14.1
7.2
8.6
9.5
11.8
10.0
5.4
18.4
54.7
13.1
19.0
22.1
14.1
14.4
NA
23.5
8.2
9.8
9.5
20.0
18.5
PE (x)
10 Yr Avg Prem/Disc (%)
27.9
-21
25.9
-17
29.1
-29
26.9
-16
9.6
-26
13.1
8
15.3
-53
10.9
-21
10.1
-5
13.4
-12
8.9
13
10.2
-47
12.7
45
34.4
59
13.2
-1
17.2
10
18.4
20
12.6
12
14.9
-3
34.5
-
24.5
-4
14.0
-42
14.3
-32
12.9
-26
12.9
55
17.6
5
Relative to Nifty P/E (%)
Current
10 Yr Avg
19
59
16
47
12
65
22
53
-62
-45
-24
-26
-61
-13
-54
-38
-48
-43
-36
-24
-46
-50
-71
-42
0
-28
196
96
-29
-25
3
-2
20
4
-24
-28
-22
-15
-
96
27
39
-56
-20
-47
-19
-48
-27
8
-27
Current
2.5
2.9
2.6
4.1
1.0
2.0
1.1
1.1
1.7
1.6
1.2
0.8
2.2
17.0
3.2
5.2
8.5
3.2
2.5
2.3
3.7
6.6
1.1
1.5
3.7
2.8
PB (x)
10 Yr Avg Prem/Disc (%)
3.4
-27
3.9
-25
4.7
-45
5.5
-25
1.3
-27
1.4
46
1.7
-35
2.1
-49
1.6
7
1.7
-9
1.1
14
1.5
-44
1.5
46
9.7
76
3.1
1
4.1
27
6.2
36
2.7
21
2.9
-13
2.4
-5
3.4
8
6.5
1
1.6
-29
1.8
-16
2.6
42
2.6
8
Relative to Nifty P/B (%)
Current
10 Yr Avg
-11
32
5
52
-7
83
48
113
-66
-49
-27
-46
-60
-34
-62
-19
-38
-37
-43
-32
-56
-59
-70
-43
-21
-41
511
276
14
22
86
58
204
141
17
5
-10
11
-16
-5
32
32
136
153
-59
-38
-44
-29
35
3
Name
Cipla
Dr Reddy’ s Labs
Sun Pharma
Zee Ent.
Hindalco
JSW Steel
Tata Steel
Vedanta
BPCL
GAIL
IOCL
ONGC
Reliance Inds.
Titan Inds.
HCL Technologies
Infosys
TCS
Tech Mahindra
Wipro
Bharti Airtel
Bharti Infratel
Coal India
NTPC
Power Grid Corp.
UPL
Nifty
BULLS & BEARS | April 2019
16
 Motilal Oswal Financial Services
Mid-caps outperform Nifty by 1.5% in March
The Nifty Mid-cap 100 was up 9.2% in Mar’19, as against the Nifty’s rise of 7.7%.
Best mid-cap performers in March: Sadbhav Engg (+31%), Brigade (+27%), India Cement (+24%), MCX (+23%) and IPCA Labs (+21%).
Company
Sadbhav Engg.
Brigade Enterpr.
India Cements
MCX
Ipca Labs.
Trident
Federal Bank
Birla Corpn.
DCB Bank
Strides Pharma
LIC Housing Fin.
Indian Hotels
Blue Star
Engineers India
Tata Elxsi
CESC
M & M Financial
Phoenix Mills
Ajanta Pharma
Team Lease Serv.
Delta Corp
Sun TV Network
Emami
Jyothy Lab.
Aegis Logistics
Persistent Sys
Alembic Pharma
GE T&D India
PE (x)
Current 10 Yr Avg Prem/Disc (%)
18.6
25.0
-26
15.6
15.1
3
22.6
31.3
-28
26.8
35.0
-23
23.1
24.7
-6
7.4
8.5
-13
10.8
12.0
-10
10.8
16.6
-35
15.5
15.9
-3
19.4
60.1
-68
9.5
11.2
-15
50.0
58.0
-14
28.8
29.2
-1
15.7
19.1
-18
19.1
19.9
-4
9.1
13.3
-31
15.6
16.9
-8
30.4
32.8
-7
19.8
15.5
28
33.4
31.3
7
28.2
33.3
-15
14.9
19.8
-25
28.0
30.3
-7
27.9
34.8
-20
20.9
20.9
0
11.4
13.5
-16
17.9
16.8
7
24.8
64.0
-61
Relative to Nifty P/E (%)
Current
10 Yr Avg
1
42
-16
-14
22
78
45
99
25
40
-60
-51
-41
-32
-42
-6
-16
-10
5
242
-49
-36
171
230
56
66
-15
9
3
13
-51
-25
-16
-4
65
86
7
-12
81
78
52
89
-19
12
52
72
51
98
13
19
-39
-23
-3
-5
34
264
PB (x)
Current 10 Yr Avg Prem/Disc (%)
1.9
2.6
-29
1.3
1.1
15
0.6
0.7
-14
3.1
3.8
-16
3.5
3.1
13
1.0
0.9
11
1.3
1.2
8
0.9
1.1
-23
1.9
1.4
31
1.6
3.3
-52
1.4
1.9
-24
3.9
3.4
14
6.4
7.8
-18
2.9
3.9
-26
4.4
5.5
-21
1.0
0.9
11
2.2
2.2
-1
2.7
2.2
27
3.3
4.2
-21
7.2
5.6
28
3.4
2.5
39
4.4
5.1
-14
8.0
10.1
-21
5.1
4.4
17
4.2
3.1
34
2.0
2.3
-14
3.3
4.4
-26
4.6
6.9
-33
Relative to Nifty P/B (%)
Current
10 Yr Avg
-33
3
-54
-57
-78
-72
13
46
26
20
-63
-64
-54
-54
-69
-56
-32
-44
-44
26
-48
-26
40
33
131
203
4
51
57
114
-65
-66
-21
-13
-1
-16
19
62
159
119
24
-4
58
98
189
294
85
70
51
22
-29
-10
17
71
66
166
Price Chg (%)
MoM
CY19YTD
31
18
27
14
24
13
23
10
21
23
19
8
15
3
13
-12
12
21
12
2
12
9
11
5
10
9
9
-7
9
-6
8
9
6
-11
6
18
6
-13
5
5
4
0
3
3
2
-4
1
-15
1
-1
-3
1
-4
-11
-5
-7
BULLS & BEARS | April 2019
17
 Motilal Oswal Financial Services
Sector valuations:
Financials outperform; Technology, Autos underperform in March
PSBs are trading at a P/B of 1.0x, in line with the historical average of 0.9x. Valuations for PSBs have recovered gradually on the back of the recent
capital infusion by the government and the prospects of stronger earnings. Overall valuations still remain in line with the long-term average, and a
earnings bounce-back is anticipated from FY20.
Technology trades at a P/E of 18.5x, at a 13% premium to the historical average of 16.4x. Our interaction with various companies indicates sustained
momentum in deal activity as of now, but the threat of unpleasant macros is also not unreal. Valuations for mid-cap IT have cooled off in comparison
to larger peers in 9MFY19. Tier-II IT trades at a 17% discount to Tier-I P/E (notably, it was trading at a peak premium of 12% nine months ago).
Auto sector is trading at a P/E of 17.3x, at a 4% premium to its historical average of 16.6x. PV volumes remained weak for the ninth consecutive
month, with no signs of a broad-based recovery yet. While MSIL’s dispatches declined ~2% YoY, new product launches aided MM’s PV wholesales
(+9% YoY).
NBFCs trade at a P/B of 3.5x, above the historical average (16% premium). Debt MFs continue reducing their exposure to NBFCs. While HFC exposure
remains unchanged at the limit of 15%, exposure of MFs to NBFCs has declined from 25% pre-ILFS crisis to 15% now. In the HFC sector, players like
HDFC and LICHF continue growing unabated, while other players are witnessing some slowdown in loan growth.
Snapshot: Sector valuations
Sector
Auto
Banks - Private
Banks - PSU
NBFC
Capital Goods
Cement
Consumer
Healthcare
Infrastructure
Media
Metals
Oil & Gas
Retail
Technology
Telecom
Utilities
Current
17.3
21.0
11.4
23.7
23.9
23.8
40.0
20.8
10.4
18.6
10.0
12.2
54.1
18.5
Loss
9.5
Relative to Nifty
P/E (%)
10 Yr Avg Prem/Disc (%) Current 10 Yr Avg
16.6
4.3
-6
-8
14
0
17.8
17.8
-39
-50
8.8
29.1
28
8
19.2
23.6
30
49
26.8
-10.7
29
19
21.4
11.1
116
87
32.8
21.8
13
33
23.5
-11.6
-44
-30
12.3
-15.5
1
28
22.5
-17.2
-46
-31
12.2
-17.6
-34
-34
11.3
7.7
193
109
37.0
46.3
0
-6
16.4
13.1
-
-
-48
-21
13.5
-29.5
PE (x)
Current
2.8
3.0
1.0
3.5
2.8
2.4
12.8
3.1
1.2
3.5
1.2
1.7
16.4
5.1
1.6
1.1
Relative to Nifty
P/B (%)
10 Yr Avg Prem/Disc (%) Current 10 Yr Avg
3.2
-12.1
0
23
2.3
28.3
8
-10
0.9
6.5
-64
-64
3.0
16.0
27
18
3.4
-16.5
2
31
2.6
-8.1
-15
0
10.2
25.6
360
299
4.0
-24.1
10
58
1.7
-30.8
-57
-34
4.3
-18.5
25
66
1.4
-11.0
-57
-48
1.5
8.7
-40
-40
9.9
64.8
489
287
4.2
20.3
84
65
2.2
-27.4
-41
-12
1.5
-22.2
-59
-42
PB (x)
BULLS & BEARS | April 2019
18
 Motilal Oswal Financial Services
Autos:
Diverging trends in Mar’19 wholesales
Auto sector is trading at a P/E of 17.3x, at a 4%
premium to its historical average of 16.6x.
PV volumes remained weak for the ninth consecutive
month, with no signs of a broad-based recovery yet.
While MSIL’s dispatches declined ~2% YoY, new
product launches aided MM’s PV wholesales (+9%
YoY).
In 2Ws, wholesales were mixed – up 20% for BJAUT,
but down 20%/2% YoY for HMCL/TVS.
CV wholesales were mixed in Mar’19, as AL’s volumes
were in line (-4% YoY), while TTMT CV volumes were
above estimates (+1% YoY). M&HCV volumes
declined 2.5% YoY, while LCV volumes grew 2% YoY.
5
4
3
2
3.2
2.8
38
31
24
17
10
3
Auto P/E (x)
10 Yr Avg (x)
70
40
17.3
10
-20
-50
Auto Relative to Nifty PE (%)
-7.9
-6.2
16.6
Auto P/B (x)
10 Yr Avg (x)
70
40
10
-20
Auto Relative to Nifty PB (%)
23.0
Sector Performance
MoM: 0%
Company
Amara Raja Batt.
Ashok Leyland
Bajaj Auto
Bharat Forge
Bosch
CEAT
Eicher Motors
Escorts
Exide Inds.
Hero Motocorp
M&M
Maruti Suzuki
Motherson Sumi
Tata Motors
TVS Motor Co.
Current
20.0
12.5
16.5
18.7
28.7
13.6
20.5
13.2
20.1
14.1
14.2
22.9
19.8
10.1
21.6
PE (x)
10 Yr Avg
18.7
16.6
15.8
25.5
31.7
11.1
22.5
9.6
21.7
17.4
16.5
19.9
24.5
11.0
19.3
Prem/Disc (%)
7
-25
4
-27
-9
23
-9
37
-7
-19
-14
15
-19
-8
12
1
0.5
Relative to Nifty P/E (%)
Current
10 Yr Avg
8
6
-33
-5
-11
-10
1
45
55
80
-26
-37
11
28
-29
-45
9
24
-24
-1
-23
-6
24
13
7
39
-45
-38
17
10
Current
3.2
2.8
3.6
3.7
5.4
1.5
5.2
2.3
2.8
3.8
2.1
4.1
3.9
0.8
5.5
PB (x)
10 Yr Avg
3.8
2.9
5.2
4.2
5.3
1.2
6.0
1.1
3.2
7.1
3.0
3.3
5.0
1.9
4.3
Prem/Disc (%)
-15
-2
-31
-10
2
18
-14
108
-12
-46
-29
23
-22
-57
28
Relative to Nifty P/B (%)
Current
10 Yr Avg
15
46
1
11
28
101
34
62
94
105
-48
-52
85
133
-18
-57
2
25
36
174
-24
16
46
29
40
93
-70
-25
96
66
BULLS & BEARS | April 2019
19
 Motilal Oswal Financial Services
Private Banks:
Growth momentum strong; margins set to recover
Private banks are trading at 3.0x, a 28% premium to its
historical P/B average of 2.3x.
33
Private Banks P/E (x)
10 Yr Avg (x)
40
20
0
-20
-40
Private Banks Relative to Nifty PE (%)
13.6
0.0
26
Banks are witnessing strong loan growth
of ~14.5%, the
highest in the last five years , driven by the retail and
19
services segments. We believe that private banks will
continue reporting healthy ~20% YoY loan growth and gain
12
market share, not only from PSBs but also from NBFCs.
5
21.0
17.8
Margin cycle has bottomed out
and is likely to recover
from the current levels on the back of (a) improved pricing
power, (b) re-pricing of advances portfolio and (c) lower
interest reversals and declining net NPLs.
Asset quality trends are indicating a recovery,
as fresh
slippages have moderated across major corporate banks.
The coverage ratios have improved, and thus, we expect
normalization in credit cost for private corporate banks.
Resolutions in NCLT-1 accounts will drive healthy provision
write-backs.
4
3
2
1
Private Banks P/B (x)
10 Yr Avg (x)
30
Private Banks Relative to Nifty PB (%)
7.6
-9.7
3.0
2.3
10
-10
-30
-50
Sector Performance
MoM: 11%
PE (x)
Relative to Nifty P/E (%)
Prem/Disc (%)
-32
-3
-10
18
11
2
28
-23
2
Current
6
-16
-41
31
7
-4
57
-67
-34
10 Yr Avg
65
-10
-32
17
1
-1
28
-54
-32
Current
2.6
1.9
1.3
3.7
2.2
3.2
3.8
0.5
1.9
PB (x)
10 Yr Avg
2.0
1.4
1.2
3.4
1.7
2.7
2.9
0.9
2.1
Prem/Disc (%)
29
31
8
10
27
19
34
-38
-10
Relative to Nifty P/B (%)
Current
-7
-32
-54
34
-21
15
38
-81
-32
10 Yr Avg
-22
-44
-54
32
-33
5
11
-67
-18
Company
Axis Bank
DCB Bank
Federal Bank
HDFC Bank
ICICI Bank
IndusInd Bank
Kotak Mah. Bank
South Ind.Bank
Yes Bank
Current
19.6
15.5
10.8
24.2
19.8
17.8
29.0
6.2
12.2
10 Yr Avg
29.1
15.9
12.0
20.5
17.8
17.4
22.6
8.0
11.9
BULLS & BEARS | April 2019
20
 Motilal Oswal Financial Services
PSU Banks:
Asset quality woes easing; NCLT resolutions to aid recoveries
PSU Banks are trading at a P/B of 1.0x, in line with the
historical average of 0.9x.
Net stressed loans moderated further,
buoyed by healthy
recoveries and a decline in fresh slippages. However,
downgradation of the ILFS account may impact the
slippages trajectory for a few PSBs in 4QFY19. SBIN, PNB,
BOB and other PSBs appear well placed to benefit from
the upcoming resolutions in NCLT-1 accounts and power
accounts under ‘SAMADHAN’ scheme.
Operating performance improved
moderately, led by
better NII growth on a calibrated margin recovery, partially
offset by muted fee income.
Valuations for PSBs have recovered gradually
on the back
of the recent capital infusion by the government and the
prospects of stronger earnings. Valuations still remain in
line with the long-term average, and a earnings bounce-
back is anticipated from FY20, which will further support
the stock performance. Trends in NPL formation and loan
growth remain the key monitorables.
PE (x)
10 Yr Avg
9.2
8.0
6.8
7.8
7.5
15.2
7.9
2
1
1
0
PSU Banks P/B (x)
10 Yr Avg (x)
-40
PSU Banks Relative to Nifty PB (%)
0.9
1.0
-50
-60
-70
-80
-63.9
-64.3
Sector Performance
MoM: 22%
Company
Bank of Baroda
Bank of India
Canara Bank
Indian Bank
Punjab Natl.Bank
St Bk of India
Union Bank (I)
Current
8.2
NA
6.9
9.2
NA
10.7
NA
Prem/Disc (%)
-11
-
2
18
-
-30
-
Relative to Nifty P/E (%)
Current
10 Yr Avg
-56
-48
-55
-63
-61
-50
-56
-57
-42
-13
-55
Current
0.7
0.8
0.6
0.7
0.8
1.2
0.4
PB (x)
10 Yr Avg
1.0
0.8
0.7
0.7
1.0
1.2
0.8
Prem/Disc (%)
-29
-2
-18
-1
-19
-3
-49
Relative to Nifty P/B (%)
Current
10 Yr Avg
-74
-61
-71
-68
-78
-72
-74
-72
-71
-62
-58
-53
-86
-70
BULLS & BEARS | April 2019
21
 Motilal Oswal Financial Services
NBFCs:
Slowdown in auto sales a cause for concern
NBFCs trade at a P/B of 3.5x, above its historical average
(16% premium).
Debt MFs continue reducing their exposure to NBFCs.
While HFC exposure remains unchanged at the limit of
15%, exposure of MFs to NBFCs has declined from 25%
pre-ILFS crisis to 15% now.
In the HFC sector, players like HDFC and LICHF continue
growing unabated, while other players are witnessing
some slowdown in loan growth.
Auto OEMs continue witnessing sluggish numbers across
the spectrum. Dealer inventory, according to our channel
checks, has increased to 20-30 days now. In addition, new
norms for 2Ws starting from 1
st
Apr’19 are likely to further
pressurise sales.
Long-term borrowing costs for AAA-rated NBFCs have
declined by 30-40bp over past three months. Short-term
borrowing costs for them are now at pre-ILFS crisis levels.
NBFC P/E (x)
29
23
17
11
5
19.2
10 Yr Avg (x)
23.7
40
20
0
-20
-40
NBFC Relative to Nifty PE (%)
28.3
8.3
4
3
2
1
NBFC P/B (x)
10 Yr Avg (x)
3.5
3.0
45
30
15
0
-15
NBFC Relative to Nifty PB (%)
27.0
18.3
Sector Performance
MoM: 8%
Company
Bajaj Finance
Chola. Invst. & Fin.
HDFC
Indiabulls Housing
L&T Fin.Holdings
LIC Housing Fin.
M & M Financial
Muthoot Finance
PNB Housing
Shri.City Union.
Shriram Trans.
Current
33.9
16.4
37.9
7.8
11.5
9.5
15.6
10.8
11.1
11.8
9.6
PE (x)
10 Yr Avg
15.9
14.3
29.0
9.4
15.8
11.2
16.9
8.1
19.7
13.9
13.0
Prem/Disc (%)
113
15
31
-17
-27
-15
-8
33
-44
-15
-26
Relative to Nifty P/E (%)
Current
10 Yr Avg
84
-9
-11
-19
105
65
-58
-46
-38
-10
-49
-36
-16
-4
-42
-54
-40
12
-36
-21
-48
-26
Current
7.4
3.1
4.2
1.9
2.0
1.4
2.2
2.3
1.7
1.7
1.6
PB (x)
10 Yr Avg
3.0
2.1
4.6
2.3
1.9
1.9
2.2
1.6
2.8
2.0
2.0
Prem/Disc (%)
147
47
-7
-17
2
-24
-1
45
-38
-16
-21
Relative to Nifty P/B (%)
Current
10 Yr Avg
167
16
10
-19
52
77
-31
-10
-30
-25
-48
-26
-21
-13
-17
-38
-37
9
-39
-21
-43
-22
BULLS & BEARS | April 2019
22
 Motilal Oswal Financial Services
Capital Goods:
Election-led slowdown in business activity impacting valuations
Capital Goods trades at one-year forward P/E multiple of
67
23.9x, at a discount of 11% to the 10-year average of 26.8x.
Even on a P/B basis, the sector trades at a discount of 17% to
47
its 10-year average multiple of 3.4x.
Valuation premium relative to the Nifty on a P/B basis has
27
been eroded; it now trades at 2% discount v/s 10-year
average of 31%. On a P/E multiple basis, the premium has
7
narrowed to 30% from the 10-year average of 49%.
Valuations for the companies are impacted by near-term
issues like (a) slowdown in ordering on account of impending
elections, (b) pressure on margins given inability to increase
prices and rising cost pressures and (c) competition intensity
9
remains fierce in the industry given the paucity of orders in
the near term.
6
Expect ordering activity to resume post elections, which, in
4
turn, will lead to a pick-up in execution and business
momentum, leading to re-rating of stocks in the sector,
Capital Goods P/E (x)
10 Yr Avg (x)
190
140
Capital Goods Relative to Nifty PE (%)
26.8
23.9
90
40
-10
49.3
29.5
Capital Goods P/B (x)
10 Yr Avg (x)
210
145
Capital Goods Relative to Nifty PB (%)
3.4
2.8
80
15
-50
30.6
1.7
Sector Performance
MoM: 8%
Company
ABB
BHEL
Blue Star
Cummins India
Engineers India
GE T&D India
Havells India
K E C Intl.
Larsen & Toubro
Siemens
Solar Inds.
Thermax
Voltas
Current
76.0
19.8
28.8
24.3
15.7
24.8
47.7
12.1
18.9
36.5
28.7
26.7
36.0
PE (x)
10 Yr Avg
77.7
24.6
29.2
25.4
19.1
64.0
25.4
15.3
23.1
48.5
21.8
30.4
22.5
Prem/Disc (%)
-2
-20
-1
-4
-18
-61
88
-21
-19
-25
32
-12
60
1
Relative to Nifty P/E (%)
Current
10 Yr Avg
311
342
7
40
56
66
31
44
-15
9
34
264
158
45
-34
-13
2
32
97
176
55
24
45
73
95
28
Current
6.5
0.8
6.4
4.4
2.9
4.6
10.0
2.6
2.5
4.5
6.2
3.4
4.4
PB (x)
10 Yr Avg
6.8
2.3
7.8
5.7
3.9
6.9
5.9
2.2
3.0
6.1
4.4
4.2
3.3
Prem/Disc (%)
-4
-65
-18
-22
-26
-33
68
19
-20
-26
41
-19
36
Relative to Nifty P/B (%)
Current
10 Yr Avg
135
164
-70
-10
131
203
59
121
4
51
66
166
259
130
-6
-15
-12
18
61
136
124
72
21
61
60
27
BULLS & BEARS | April 2019
23
 Motilal Oswal Financial Services
Cement:
Price hikes in Feb’19 were not sustainable
Cement trades at EV/EBITDA of 15x, at a 6% discount to its
43
historical average.
33
On many instances now, price hikes in the north have
failed to sustain. Price hikes taken in south in Feb couldn’t
23
sustain because of selling pressure due to the year-end
and the lack of demand. As a result, prices corrected to the
13
extent of INR20/bag in Hyderabad, Kerala and Bangalore,
3
while they remained constant in Chennai.
Cement P/E (x)
10 Yr Avg (x)
150
105
23.8
Cement Relative to Nifty PE (%)
60
15
-30
-75
19.0
28.7
21.4
The eastern region witnessed a decline in prices by
INR3/bag in Mar’19. Prices increased by INR2/bag in the
central region and by INR5/bag in west.
RIL increased petcoke prices by INR300/ton on 1
st
March
and reduced by INR200/t on 18
th
March. Prices of
imported coal (in INR) reduced by 9.7% MoM. Diesel prices
increased 1% MoM.
5
4
3
2
1
1
Cement P/B (x)
10 Yr Avg (x)
30
10
Cement Relative to Nifty PB (%)
2.6
2.4
-10
-30
-50
0.4
-15.0
Sector Performance
MoM: 9%
PE (x)
Company
ACC
Ambuja Cem.
Birla Corpn.
Grasim
India Cements
Sanghi Inds.
Shree Cement
UltraTech
10 Yr
Current
Avg
21.2
25.8
34.6
10.8
10.6
22.6
28.4
40.0
38.0
28.5
16.6
10.7
31.3
19.4
27.0
28.2
Relative to Nifty
Relative to Nifty
PB (x)
EV/EBIDTA (x)
P/E (%)
P/B (%)
Prem/
10 Yr
10 Yr Prem/
10 Yr
10 Yr Prem/
Current
Current
Current
Current
Disc (%)
Avg
Avg Disc (%)
Avg
Avg Disc (%)
-18
15
47
2.7
2.9
-7
-4
12
9.6
13.4
-28
21
-35
-1
-28
46
48
35
87
-42
-43
22
54
116
106
62
-6
-39
78
11
54
61
2.2
0.9
1.2
0.6
0.9
5.8
3.2
2.6
1.1
1.7
0.7
0.9
4.3
3.1
-17
-23
-29
-14
6
37
4
-22
-69
-57
-78
-67
110
16
2
-56
-35
-72
-66
66
20
20.7
7.1
13.0
8.5
14.1
16.2
15.3
15.6
7.7
22.1
8.2
9.5
12.8
13.3
32
-8
-41
3
48
27
14
Cement EV/EBDITA (x)
22
17
12
7
2
13.8
10 Yr Avg (x)
14.6
BULLS & BEARS | April 2019
24
 Motilal Oswal Financial Services
Consumer:
Valuations not relenting
Consumer sector P/E of 40x (up from 39.4x in Feb’19) is at a
premium of 21.8% to its 10-year average of 32.8x. On a P/B
55
basis, the sector trades at 12.8x, a premium of 25.6% to its
45
10-year average multiple of 10.2x.
35
Consumer P/E relative to Nifty P/E has declined to 116% in
Mar’19 from 125.5% in Feb’19.
25
15
Consumer P/E (x)
10 Yr Avg (x)
40.0
32.8
150
110
70
30
-10
86.7
Consumer Relative to Nifty PE (%)
116.1
Consumer companies cited a stable demand environment,
with rural growing ahead of urban in the recent quarter.
Launch pipeline is strong compared to the preceding two
years. Raw material costs have been stable – even if there is
15
some inflation, favorable demand will help companies to
pass on the cost increases. Thus, while ad spends might rise
13
on new launches, the high margin trajectory can be
10
sustained due to operating leverage.
Consumer P/B (x)
10 Yr Avg (x)
480
380
280
180
80
Consumer Relative to Nifty PB (%)
12.8
10.2
360.1
298.7
8
5
Sector Performance
MoM: 3%
Company
Asian Paints
Britannia Inds.
Colgate-Palm.
Dabur India
Emami
GlaxoSmith C H L
Godrej Consumer
Hind. Unilever
ITC
Jyothy Lab.
Marico
Nestle India
P & G Hygiene
Page Industries
Pidilite Inds.
United Breweries
United Spirits
Current
52.6
52.1
39.2
42.7
28.0
32.2
38.9
49.8
26.5
27.9
38.8
55.7
64.3
52.8
55.5
52.1
38.9
PE (x)
10 Yr Avg
36.8
32.5
34.6
32.1
30.3
29.4
33.7
36.6
26.2
34.8
32.6
42.6
43.5
39.0
31.4
67.0
93.4
Prem/Disc (%)
43
60
13
33
-7
10
15
36
1
-20
19
31
48
35
77
-22
-58
Relative to Nifty P/E (%)
Current
10 Yr Avg
184
109
182
85
112
97
131
83
52
72
74
67
110
91
170
108
44
49
51
98
110
85
201
142
248
147
185
122
200
78
182
281
110
431
Current
14.9
18.1
21.2
9.9
8.0
7.5
9.4
50.7
6.7
5.1
14.0
28.5
31.4
28.4
14.5
9.6
10.2
PB (x)
10 Yr Avg
10.8
12.4
24.2
9.6
10.1
7.9
7.5
31.1
7.2
4.4
10.3
23.1
16.9
18.5
8.0
8.8
11.4
Prem/Disc (%)
38
46
-12
3
-21
-4
26
63
-7
17
36
23
86
54
81
10
-11
Relative to Nifty P/B (%)
Current
10 Yr Avg
436
320
550
382
661
839
257
274
189
294
171
205
239
191
1726
1108
142
181
85
70
402
298
924
799
1031
558
922
618
422
211
246
241
268
345
BULLS & BEARS | April 2019
25
 Motilal Oswal Financial Services
Healthcare:
Long way to reduce discount to 10-year average P/E multiple
Healthcare P/E multiple discount to its 10-year average was
stable at ~12% in Mar’19.
While the approval pace in the US market remains good, the
uncertainty about the outcome of the recent USFDA
inspections (e.g. OAI at Somerset facility of Lupin, Form 483
with 18 observations at Kurkumbh facility of Cipla) remains a
overhang and a drag on the sector P/E multiple.
Long-term growth prospects have turned unfavorable due to
a gradual downtrend in the domestic formulation segment
(led by the lower growth rate in major therapies – anti
infectives), putting pressure on P/E multiple of the sector.
We believe that the premium to long-term P/E multiple
would be skewed toward companies with a strong growth
outlook in the US through niche launches, consistency in
compliance and/or outperformance in DF through new
launches and better MR effort.
Only 6/18 stocks under our coverage enjoy premium to
sector PE (x) multiple, implying considerable effort required
by the companies to reduce the
Sector Performance
discount.
36
30
24
18
12
23.5
20.8
Healthcare P/E (x)
10 Yr Avg (x)
90
60
30
0
-30
Healthcare Relative to Nifty PE (%)
32.9
12.6
Healthcare P/B (x)
7
5
4
2
4.0
10 Yr Avg (x)
140
100
60
Healthcare Relative to Nifty PB (%)
58.2
3.1
20
-20
10.5
MoM: 5%
Company
Aurobindo Pharma
Ajanta Pharma
Biocon
Cadila Health.
Cipla
Divi's Lab.
Dr Reddy's Labs
Glaxosmit Pharma
Glenmark Pharma.
Granules India
Ipca Labs.
Jubilant Life
Lupin
Sanofi India
Sun Pharma.Inds.
Strides Shasun
Shilpa Medicare
Torrent Pharma.
Current
13.3
19.8
28.0
19.5
21.9
27.8
21.5
44.6
18.6
11.0
23.1
9.6
19.3
29.6
20.7
19.4
14.5
28.5
PE (x)
10 Yr Avg
13.6
15.5
24.6
21.6
27.9
21.1
25.9
48.4
23.2
10.8
24.7
13.1
24.5
28.7
29.1
60.1
23.3
18.5
Prem/Disc (%)
-2
28
14
-9
-21
32
-17
-8
-20
2
-6
-27
-21
3
-29
-68
-38
54
Relative to Nifty P/E (%)
Current
10 Yr Avg
-28
-23
7
-12
52
40
6
23
19
59
50
20
16
47
141
175
1
32
-40
-39
25
40
-48
-26
4
39
60
63
12
65
5
242
-21
32
54
5
Current
2.7
3.3
5.5
3.1
2.5
5.4
2.9
9.7
2.6
1.8
3.5
1.7
2.2
5.5
2.6
1.6
2.0
5.3
PB (x)
10 Yr Avg
2.8
4.2
3.1
4.9
3.4
4.7
3.9
10.4
4.1
1.6
3.1
1.6
4.5
4.6
4.7
3.3
2.8
4.3
Prem/Disc (%)
-6
-21
75
-36
-27
15
-25
-7
-35
8
13
7
-51
18
-45
-52
-29
24
Relative to Nifty P/B (%)
Current
10 Yr Avg
-4
10
19
62
96
21
13
92
-11
32
95
83
5
52
248
303
-5
58
-36
-36
26
20
-37
-37
-21
76
97
80
-7
83
-44
26
-29
8
92
66
BULLS & BEARS | April 2019
26
 Motilal Oswal Financial Services
Infrastructure:
Sectoral hurdles subsiding, to reflect in valuations
Infrastructure sector trades at a P/B of 1.2x, at a 31%
discount to the historical average.
Ordering activity for FY19 has remained subdued post
peak ordering in FY18, given slow progress on the
already awarded HAM projects and land acquisition
issues prevailing at the NHAI’s end.
Ordering activity is expected to resume post elections ,
which can lead to improved business momentum for the
players in the road sector.
Financing issues seem to be receding, with most of the
projects awarded by the NHAI in FY18 achieving financial
closure.
IRB Infra, Ashoka and Sadbhav trade at a discount to
historical P/B, while KNR trades at a premium.
32
24
16
8
0
Infrastructure P/E (x)
10 Yr Avg (x)
60
20
10.4
-20
-60
-100
-30.2
-43.9
Infrastructure Relative to Nifty PE (%)
12.3
Infrastructure P/B (x)
4
2
1
0
1.7
10 Yr Avg (x)
0
-25
-50
Infrastructure Relative to Nifty PB (%)
-33.5
1.2
-75
-100
-56.9
PE (x)
Company
Ashoka Buildcon
IRB Infra.Devl.
KNR Construct.
Sadbhav Engg.
Current
10.4
6.2
18.1
18.6
10 Yr Avg
13.9
11.3
8.4
25.0
Prem/Disc (%)
-
-45
116
-26
Relative to Nifty P/E (%)
Current
-
-67
-2
1
10 Yr Avg
-21
-36
-52
42
Current
1.4
0.7
2.4
1.9
PB (x)
10 Yr Avg
1.7
1.7
1.4
2.6
Prem/Disc (%)
-14
-61
71
-29
Relative to Nifty P/B (%)
Current
-49
-76
-15
-33
10 Yr Avg
-36
-33
-46
3
BULLS & BEARS | April 2019
27
 Motilal Oswal Financial Services
Media:
Pressure on broadcasters keeps valuations muted
Media sector P/E of 18.6x is at ~17% discount to its
10-year historical average 22.5x.
Impact on ad/subscription growth due to the on-
ground hiccups from the implementation of the
TRAI’s new tariff order has kept broadcasters’ and in
turn overall media sector’s valuations under
pressure.
Print companies’ valuations saw some uptick as
newsprint prices seemed to have reverted back to
normal. Screen adds continued driving premium
valuations for PVR.
Media P/E (x)
43
31
19
7
22.5
10 Yr Avg (x)
100
50
0
-50
Media Relative to Nifty PE (%)
27.9
0.8
18.6
Media P/B (x)
6
5
4
2
4.3
10 Yr Avg (x)
130
90
Media Relative to Nifty PB (%)
66.2
3.5
50
10
-30
25.1
Sector Performance
MoM: -1%
PE (x)
Company
Ent.Network
Jagran Prakashan
PVR
Sun TV Network
Zee Entertainmen
Current
28.3
9.3
45.9
14.9
22.6
10 Yr Avg
38.9
15.3
39.3
19.8
26.9
Prem/Disc (%)
-27
-39
17
-25
-16
1
Relative to Nifty P/E (%)
Current
53
-50
148
-19
22
10 Yr Avg
121
-13
123
12
53
Current
2.5
1.7
4.9
4.4
4.1
PB (x)
10 Yr Avg
3.0
3.3
3.3
5.1
5.5
Prem/Disc (%)
-17
-49
47
-14
-25
Relative to Nifty P/B (%)
Current
-9
-40
78
58
48
10 Yr Avg
18
28
30
98
113
BULLS & BEARS | April 2019
28
 Motilal Oswal Financial Services
Metals:
Zinc prices higher, domestic steel prices broadly stable
Metals trade at 1.2x, near its historical average P/B
of 1.4x. EV/EBITDA is at 6.5x, at an 11% discount to
historical average.
Domestic flat steel product prices were unchanged
during the month, while long prices were lower by
INR1,300/t.
Aluminum prices were lower by ~2%. Zinc prices
have increased by more than USD200/t in the
month.
We remain positive on JSW Steel, as it benefits from
higher steel spreads. Hindalco is well placed to
benefit from higher aluminum prices and low-cost
captive raw material.
25
20
15
10
5
12.2
10.0
Metals P/E (x)
10 Yr Avg (x)
15
-5
-25
-45
-65
-45.8
Metals Relative to Nifty PE (%)
-31.0
4
3
2
1
Metals P/B (x)
10 Yr Avg (x)
20
-5
Metals Relative to Nifty PB (%)
1.4
1.2
-30
-55
-80
-47.8
-56.6
Sector Performance
MoM: 5%
PE (x)
Company
Hind.Zinc
Hindalco Inds.
Jindal Steel
JSW Steel
Natl. Alum
NMDC
Rain Inds
SAIL
Tata Steel
Vedanta
Current
12.0
7.1
NA
14.1
10.8
10.4
7.5
NA
7.2
8.6
10 Yr
Avg
9.6
9.6
16.4
13.1
16.0
12.6
4.6
15.0
15.3
10.9
Prem/
Disc (%)
24
-26
8
-33
-18
64
-53
-21
Relative to Nifty
P/E (%)
Current
-35
-62
-24
-42
-44
-60
-61
-54
10 Yr
Avg
-45
-45
-7
-26
-9
-28
-74
-14
-13
-38
Current
2.9
1.0
0.6
2.0
1.1
1.2
0.7
0.5
1.1
1.1
0
PB (x)
10 Yr
Avg
2.2
1.3
1.6
1.4
1.3
2.9
0.7
1.0
1.7
2.1
Prem/
Disc (%)
35
-27
-66
46
-16
-58
-1
-46
-35
-49
Relative to Nifty
P/B (%)
Current
6
-66
-80
-27
-61
-56
-74
-81
-60
-62
10 Yr
Avg
-15
-49
-37
-46
-50
11
-71
-61
-34
-19
EV/EBIDTA (x)
Current
7.1
5.2
6.3
8.1
5.1
5.8
2.0
9.1
6.8
4.6
10 Yr
Avg
5.7
7.1
10.7
7.7
8.1
8.1
1.5
14.6
7.6
4.4
Prem/
Disc (%)
24
-27
-41
6
-37
-29
31
-38
-11
4
Metals EV/EBDITA (x)
10
8
5
3
10 Yr Avg (x)
7.3
6.5
BULLS & BEARS | April 2019
29
 Motilal Oswal Financial Services
Oil & Gas:
Refining margins improve
Oil & Gas trades at 1.7x P/B – 9% premium to its historical
averages and P/E of 12.2x (v/s 10-year average of 11.3x).
Crude oil prices have been stable at USD63-68/bbl.
Production disruptions in Venezuela and Iran appear to
have been countered by growing production from the US.
Due to several refinery shutdowns, SG GRM has improved
from a low of ~USD2.5/bbl in Jan-Feb’19 to USD4.5/bbl in
Mar’19.
Stable crude prices, favourable exchange rate, normalized
marketing margins and improving GRMs resulted in strong
rally in the OMCs.
With stability in oil prices and concerns ebbing on subsidy
sharing, ONGC has also shown a decent rally in the stock
price in the month.
Amidst talks of deleveraging, RIL has been stable despite
concern on its petrochemical segment due to contracting
global margins.
18
15
12
9
6
11.3
Oil & Gas P/E (x)
10 Yr Avg (x)
-12
12.2
-27
-42
-57
-72
-34.2
Oil & Gas Relative to Nifty PE (%)
-34.1
3
2
2
1
1
Oil & Gas P/B (x)
10 Yr Avg (x)
1.7
0
-25
-50
-75
Oil & Gas Relative to Nifty PB (%)
1.5
-39.9
-39.6
Sector Performance
MoM: 11%
Company
Aegis Logistics
BPCL
GAIL (India)
Guj.St.Petronet
HPCL
IOCL
Indraprastha Gas
MRPL
ONGC
Petronet LNG
Reliance Inds.
Current
20.9
9.5
11.8
12.8
6.7
10.0
23.9
7.0
5.4
14.4
18.4
PE (x)
10 Yr Avg
20.9
10.1
13.4
11.5
17.8
8.9
13.6
14.1
10.2
11.7
12.7
Prem/Disc (%)
0
-5
-12
11
-62
13
75
-50
-47
24
45
Relative to Nifty P/E (%)
Current
10 Yr Avg
13
19
-48
-43
-36
-24
-31
-35
-64
1
-46
-50
29
-22
-62
-20
-71
-42
-22
-34
0
-28
Current
4.2
1.7
1.6
1.6
1.3
1.2
4.5
1.0
0.8
3.2
2.2
PB (x)
10 Yr Avg
3.1
1.6
1.7
1.8
1.2
1.1
2.8
1.6
1.5
2.3
1.5
Prem/Disc (%)
34
7
-9
-7
11
14
62
-36
-44
36
46
Relative to Nifty P/B (%)
Current
10 Yr Avg
51
22
-38
-37
-43
-32
-41
-31
-52
-53
-56
-59
61
7
-63
-37
-70
-43
15
-9
-21
-41
BULLS & BEARS | April 2019
30
 Motilal Oswal Financial Services
Retail:
Rich valuations of 54x do not factor in downside risk
Our retail coverage trades at a P/E of 54.1x, at a 46%
premium to historical average of 37x.
On a P/B basis, the sector trades at 16.4x, a premium of 64.8%
to its 10-year average multiple of 9.9x.
Valuation premium relative to the Nifty on a P/E basis has
gone up to 192.9% (from 183.3% in Feb’ 19).
The two stocks under our retail coverage have reported strong
revenue growth in the recently reported quarter led by SSSG.
Even margins for both the companies continue expanding with
operating leverage kicking in. Valuations for Titan are expected
to remain at a premium due to its buoyant earnings prospects.
On the other hand, there are some uncertainties over
incremental earnings growth trajectory for Jubilant
Foodworks.
75
57
39
21
3
37.0
Retail P/E (x)
10 Yr Avg (x)
54.1
270
190
110
30
-50
Retail Relative to Nifty PE (%)
192.9
108.7
19
15
11
7
3
Retail P/B (x)
10 Yr Avg (x)
16.4
640
490
340
Retail Relative to Nifty PB (%)
488.8
286.7
9.9
190
40
Company
Jubilant Food
Titan Inds.
Current
51.3
54.7
PE (x)
10 Yr Avg
63.3
34.4
Prem/Disc (%)
-19
59
Relative to Nifty P/E (%)
Current
10 Yr Avg
178
260
196
96
Current
13.7
17.0
PB (x)
10 Yr Avg
12.3
9.7
Prem/Disc (%)
11
76
Relative to Nifty P/B (%)
Current
10 Yr Avg
393
379
511
276
BULLS & BEARS | April 2019
31
 Motilal Oswal Financial Services
Technology:
Currency playing a foul game
Technology sector trades at a P/E of 18.5x, at a 13%
premium to its historical average of 16.4x.
We met with various companies last month. Most of them
suggested continued momentum in deal activity as of now,
although the threat of unpleasant macros is also not unreal.
Higher cost in FY18 and 9MFY19 can primarily be attributed
to supply issues. Going ahead, lower dependency on visas
and addressing the hiring this year could alleviate concerns
around supply.
INR depreciation during the last three quarters acted as a
tailwind for the sector, providing relief on the margin front.
However, the recent INR appreciation has changed the
direction of cross-currency impact and will put some
pressure on margins if the current USD/INR level sustains.
Valuations for Mid cap IT has cooled off in comparison to
larger peers in 9MFY19. Tier-II IT trades at a 17% discount to
Tier-I’s P/E, after a high of 12% premium nine months ago.
We remain positive on INFO and
TECHM in Tier-I. In mid-caps,
Sector Performance
we remain positive on ZENT,
MoM: 0%
MTCL,and PSYS.
Company
Cyient
HCL Technologies
Hexaware Tech.
Infosys
MphasiS
NIIT Tech.
TCS
Tech Mahindra
Wipro
Zensar Tech.
Current
13.3
13.1
16.0
19.0
15.8
16.1
22.1
14.1
14.4
14.9
PE (x)
10 Yr Avg
12.0
13.2
13.3
17.2
12.5
9.7
18.4
12.6
14.9
9.4
Prem/Disc (%)
10
-1
21
10
26
66
20
12
-3
59
23
19
15
11
7
16.4
Technology P/E (x)
10 Yr Avg (x)
40
20
0
-20
-40
-5.8
Technology Relative to Nifty PE (%)
18.5
0.3
6
5
4
3
2
Technology P/B (x)
10 Yr Avg (x)
5.1
4.2
150
120
90
60
30
0
Technology Relative to Nifty PB (%)
83.9
65.3
Relative to Nifty P/E (%)
Current
10 Yr Avg
-28
-32
-29
-25
-13
-25
3
-2
-15
-29
-13
-45
20
4
-24
-28
-22
-15
-19
-46
Current
2.5
3.2
3.8
5.2
4.5
3.6
8.5
3.2
2.5
2.4
PB (x)
10 Yr Avg
2.0
3.1
3.1
4.1
2.5
1.7
6.2
2.7
2.9
1.8
Prem/Disc (%)
23
1
22
27
81
113
36
21
-13
31
Relative to Nifty P/B (%)
Current
10 Yr Avg
-9
-21
14
22
38
22
86
58
61
-4
30
-34
204
141
17
5
-10
11
-13
-28
BULLS & BEARS | April 2019
32
 Motilal Oswal Financial Services
Telecom:
Rights issue provides support to premium valuation
The telecom sector is trading at an EV/EBITDA of
11.3x, ~33% premium to its 10-year historical
average.
Valuations for Bharti Airtel saw an uptrend in
Mar’19, led by a positive surprise on MoM data
subscribers adds (according to TRAI). Further, much-
needed respite came in the form of rights issue by
both Bharti Airtel and Vodafone Idea, supporting
premium valuations.
4
3
3
2
2
1
1.6
2.2
Telecom P/B (x)
10 Yr Avg (x)
85
50
15
-20
-55
-11.8
-41.4
Telecom Relative to Nifty PB (%)
15
13
10
8
5
Telecom EV/EBDITA (x)
10 Yr Avg (x)
8.5
11.3
Sector Performance
MoM: 20%
Company
Bharti Airtel
Idea Cellular
Tata Comm
Current
NA
NA
54.8
PE (x)
10 Yr Avg
34.5
17.6
183.5
Prem/Disc (%)
NA
-
-70
Relative to Nifty P/E (%)
Current
10 Yr Avg
NA
96
-
0
197
943
Current
2.3
0.4
17.4
PB (x)
10 Yr Avg
2.4
1.1
12.5
Prem/Disc (%)
-5
-68
39
Relative to Nifty P/B (%)
Current
10 Yr Avg
-16
-5
-87
-56
524
385
BULLS & BEARS | April 2019
33
 Motilal Oswal Financial Services
Utilities:
Electricity generation declines in February
Utilities trade at a P/B of 1.1x, at a 22% discount to
historical average.
NTPC, NHPC, Power Grid, Tata Power and JSW
Energy trade at a discount to historical average P/B.
Short-term power prices were largely stable at
INR3.1/kWh in March.
Conventional electricity generation declined ~1%
YoY in Feb’19.
3
2
2
1
1.5
1.1
Utilities P/B (x)
10 Yr Avg (x)
24
20
16
12
8
9.5
13.5
Utilities P/E (x)
10 Yr Avg (x)
35
10
-15
-40
-65
-20.9
-48.5
Utilities Relative to Nifty PE (%)
35
10
-15
-40
-65
Utilities Relative to Nifty PB (%)
-42.4
-58.7
Sector Performance
MoM: 11%
Company
CESC
Coal India
JSW Energy
NHPC
NTPC
Power Grid Corpn
Torrent Power
Tata Power
Current
9.1
8.2
15.8
9.4
9.8
9.5
11.1
11.1
PE (x)
10 Yr Avg
13.3
14.0
16.5
11.7
14.3
12.9
16.2
23.9
Prem/Disc (%)
-31
-42
-4
-20
-32
-26
-31
-54
1
Relative to Nifty P/E (%)
Current
10 Yr Avg
-51
-25
-56
-20
-14
-6
-49
-34
-47
-19
-48
-27
-40
-8
-40
36
Current
1.0
6.6
1.0
0.8
1.1
1.5
1.3
1.1
PB (x)
10 Yr Avg
0.9
6.5
1.6
0.9
1.6
1.8
1.5
1.9
Prem/Disc (%)
11
1
-35
-14
-29
-16
-14
-44
Relative to Nifty P/B (%)
Current
10 Yr Avg
-65
-66
136
153
-63
-39
-71
-64
-59
-38
-44
-29
-52
-40
-61
-25
BULLS & BEARS | April 2019
34
 Motilal Oswal Financial Services
NOTES
 Motilal Oswal Financial Services
Motilal Oswal Securities Limited
MEMBER OF BSE AND NSE
Motilal Oswal Tower, Sayani Road, Prabhadevi, Mumbai 400 025, INDIA
BOARD: +91 22 3982 5500 | WEBSITE:
www.motilaloswal.com
Explanation of Investment Rating
Investment Rating
BUY
SELL
NEUTRAL
UNDER REVIEW
NOT RATED
Expected return (over 12-month)
>=15%
< - 10%
> - 10 % to 15%
Rating may undergo a change
We have forward looking estimates for the stock but we refrain from assigning recommendation
*In case the recommendation given by the Research Analyst becomes inconsistent with the investment rating legend, the Research Analyst shall within 28 days of the inconsistency, take appropriate
measures to make the recommendation consistent with the investment rating legend.
Disclosures:
The following Disclosures are being made in compliance with the SEBI Research Analyst Regulations 2014 (herein after referred to as the Regulations).
Motilal Oswal Securities Ltd. (MOSL*) is a SEBI Registered Research Analyst having registration no. INH000000412. MOSL, the Research Entity (RE) as defined in the Regulations, is engaged in the
business of providing Stock broking services, Investment Advisory Services, Depository participant services & distribution of various financial products. MOSL is a subsidiary company of Motilal Oswal
Financial Service Ltd. (MOFSL). MOFSL is a listed public company, the details in respect of which are available on
www.motilaloswal.com.
MOSL is registered with the Securities & Exchange Board of India
(SEBI) and is a registered Trading Member with National Stock Exchange of India Ltd. (NSE) and BSE Limited (BSE), Multi Commodity Exchange of India (MCX) & National Commodity & Derivatives
Exchange Ltd. (NCDEX) for its stock broking activities & is Depository participant with Central Depository Services Limited (CDSL) & National Securities Depository Limited (NSDL) and is member of
Association of Mutual Funds of India (AMFI) for distribution of financial products. Details of associate entities of Motilal Oswal Securities Limited are available on the website at
http://onlinereports.motilaloswal.com/Dormant/documents/Associate%20Details.pdf
MOSL, it’s associates, Research Analyst or their relative may have any financial interest in the subject company. MOSL and/or its associates and/or Research Analyst may have actual/beneficial ownership
of 1% or more securities in the subject company at the end of the month immediately preceding the date of publication of the Research Report. MOSL and its associate company(ies), their directors and
Research Analyst and their relatives may; (a) from time to time, have a long or short position in, act as principal in, and buy or sell the securities or derivatives thereof of companies mentioned herein. (b) be
engaged in any other transaction involving such securities and earn brokerage or other compensation or act as a market maker in the financial instruments of the company(ies) discussed herein or act as
an advisor or lender/borrower to such company(ies) or may have any other potential conflict of interests with respect to any recommendation and other related information and opinions.; however the same
shall have no bearing whatsoever on the specific recommendations made by the analyst(s), as the recommendations made by the analyst(s) are completely independent of the views of the associates of
MOSL even though there might exist an inherent conflict of interest in some of the stocks mentioned in the research report. Research Analyst may have served as director/officer, etc. in the subject
company in the last 12 month period. MOSL and/or its associates may have received any compensation from the subject company in the past 12 months.
In the last 12 months period ending on the last day of the month immediately preceding the date of publication of this research report, MOSL or any of its associates may have:
managed or co-managed public offering of securities from subject company of this research report,
received compensation for investment banking or merchant banking or brokerage services from subject company of this research report,
received compensation for products or services other than investment banking or merchant banking or brokerage services from the subject company of this research report.
Subject Company may have been a client of MOSL or its associates during twelve months preceding the date of distribution of the research report.
MOSL and it’s associates have not received any compensation or other benefits from the subject company or third party in connection with the research report. To enhance transparency, MOSL has
incorporated a Disclosure of Interest Statement in this document. This should, however, not be treated as endorsement of the views expressed in the report. MOSL and / or its affiliates do and seek to do
business including investment banking with companies covered in its research reports. As a result, the recipients of this report should be aware that MOSL may have a potential conflict of interest that may
affect the objectivity of this report. Compensation of Research Analysts is not based on any specific merchant banking, investment banking or brokerage service transactions.
 Motilal Oswal Financial Services
Terms & Conditions:
This report has been prepared by MOSL and is meant for sole use by the recipient and not for circulation. The report and information contained herein is strictly confidential and may not be altered in any way,
transmitted to, copied or distributed, in part or in whole, to any other person or to the media or reproduced in any form, without prior written consent of MOSL. The report is based on the facts, figures and
information that are considered true, correct, reliable and accurate. The intent of this report is not recommendatory in nature. The information is obtained from publicly available media or other sources believed
to be reliable. Such information has not been independently verified and no guaranty, representation of warranty, express or implied, is made as to its accuracy, completeness or correctness. All such
information and opinions are subject to change without notice. The report is prepared solely for informational purpose and does not constitute an offer document or solicitation of offer to buy or sell or subscribe
for securities or other financial instruments for the clients. Though disseminated to all the customers simultaneously, not all customers may receive this report at the same time. MOSL will not treat recipients as
customers by virtue of their receiving this report.
Analyst Certification
The views expressed in this research report accurately reflect the personal views of the analyst(s) about the subject securities or issues, and no part of the compensation of the research analyst(s) was, is, or
will be directly or indirectly related to the specific recommendations and views expressed by research analyst(s) in this report.
Disclosure of Interest Statement
Companies where there is interest
Analyst ownership of the stock
No
A graph of daily closing prices of securities is available at
www.nseindia.com, www.bseindia.com.
Research Analyst views on Subject Company may vary based on Fundamental research and Technical
Research. Proprietary trading desk of MOSL or its associates maintains arm’s length distance with Research Team as all the activities are segregated from MOSL research activity and therefore it can have an
independent view with regards to subject company for which Research Team have expressed their views.
Regional Disclosures (outside India)
This report is not directed or intended for distribution to or use by any person or entity resident in a state, country or any jurisdiction, where such distribution, publication, availability or use would be contrary to
law, regulation or which would subject MOSL & its group companies to registration or licensing requirements within such jurisdictions.
For Hong Kong:
This report is distributed in Hong Kong by Motilal Oswal capital Markets (Hong Kong) Private Limited, a licensed corporation (CE AYY-301) licensed and regulated by the Hong Kong Securities and Futures
Commission (SFC) pursuant to the Securities and Futures Ordinance (Chapter 571 of the Laws of Hong Kong) “SFO”. As per SEBI (Research Analyst Regulations) 2014 Motilal Oswal Securities (SEBI Reg
No. INH000000412) has an agreement with Motilal Oswal capital Markets (Hong Kong) Private Limited for distribution of research report in Hong Kong. This report is intended for distribution only to
“Professional Investors” as defined in Part I of Schedule 1 to SFO. Any investment or investment activity to which this document relates is only available to professional investor and will be engaged only with
professional investors.” Nothing here is an offer or solicitation of these securities, products and services in any jurisdiction where their offer or sale is not qualified or exempt from registration. The Indian
Analyst(s) who compile this report is/are not located in Hong Kong & are not conducting Research Analysis in Hong Kong.
For U.S.
Motilal Oswal Securities Limited (MOSL) is not a registered broker - dealer under the U.S. Securities Exchange Act of 1934, as amended (the"1934 act") and under applicable state laws in the United States.
In addition MOSL is not a registered investment adviser under the U.S. Investment Advisers Act of 1940, as amended (the "Advisers Act" and together with the 1934 Act, the "Acts), and under applicable state
laws in the United States. Accordingly, in the absence of specific exemption under the Acts, any brokerage and investment services provided by MOSL, including the products and services described herein
are not available to or intended for U.S. persons. This report is intended for distribution only to "Major Institutional Investors" as defined by Rule 15a-6(b)(4) of the Exchange Act and interpretations thereof by
SEC (henceforth referred to as "major institutional investors"). This document must not be acted on or relied on by persons who are not major institutional investors. Any investment or investment activity to
which this document relates is only available to major institutional investors and will be engaged in only with major institutional investors. In reliance on the exemption from registration provided by Rule 15a-6
of the U.S. Securities Exchange Act of 1934, as amended (the "Exchange Act") and interpretations thereof by the U.S. Securities and Exchange Commission ("SEC") in order to conduct business with
Institutional Investors based in the U.S., MOSL has entered into a chaperoning agreement with a U.S. registered broker-dealer, Motilal Oswal Securities International Private Limited. ("MOSIPL"). Any business
interaction pursuant to this report will have to be executed within the provisions of this chaperoning agreement.
The Research Analysts contributing to the report may not be registered /qualified as research analyst with FINRA. Such research analyst may not be associated persons of the U.S. registered broker-dealer,
MOSIPL, and therefore, may not be subject to NASD rule 2711 and NYSE Rule 472 restrictions on communication with a subject company, public appearances and trading securities held by a research
analyst account.
 Motilal Oswal Financial Services
For Singapore
In Singapore, this report is being distributed by Motilal Oswal Capital Markets Singapore Pte Ltd (“MOCMSPL”) (Co.Reg. NO. 201129401Z) which is a holder of a capital markets services license and an exempt financial adviser in Singapore,
as per the approved agreement under Paragraph 9 of Third Schedule of Securities and Futures Act (CAP 289) and Paragraph 11 of First Schedule of Financial Advisors Act (CAP 110) provided to MOCMSPL by Monetary Authority of Singapore. Persons
in Singapore should contact MOCMSPL in respect of any matter arising from, or in connection with this report/publication/communication. This report is distributed solely to persons who qualify as “Institutional Investors”, of which some of whom may
consist of "accredited" institutional investors as defined in section 4A(1) of the Securities and Futures Act, Chapter 289 of Singapore (“the SFA”). Accordingly, if a Singapore person is not or ceases to be such an institutional investor, such Singapore
Person must immediately discontinue any use of this Report and inform MOCMSPL.
Disclaimer:
The report and information contained herein is strictly confidential and meant solely for the selected recipient and may not be altered in any way, transmitted to, copied or distributed, in part or in whole, to any other person or to the media or reproduced in
any form, without prior written consent. This report and information herein is solely for informational purpose and may not be used or considered as an offer document or solicitation of offer to buy or sell or subscribe for securities or other financial
instruments. Nothing in this report constitutes investment, legal, accounting and tax advice or a representation that any investment or strategy is suitable or appropriate to your specific circumstances. The securities discussed and opinions expressed in
this report may not be suitable for all investors, who must make their own investment decisions, based on their own investment objectives, financial positions and needs of specific recipient. This may not be taken in substitution for the exercise of
independent judgment by any recipient. Each recipient of this document should make such investigations as it deems necessary to arrive at an independent evaluation of an investment in the securities of companies referred to in this document (including
the merits and risks involved), and should consult its own advisors to determine the merits and risks of such an investment. The investment discussed or views expressed may not be suitable for all investors. Certain transactions -including those involving
futures, options, another derivative products as well as non-investment grade securities - involve substantial risk and are not suitable for all investors. No representation or warranty, express or implied, is made as to the accuracy, completeness or fairness
of the information and opinions contained in this document. The Disclosures of Interest Statement incorporated in this document is provided solely to enhance the transparency and should not be treated as endorsement of the views expressed in the
report. This information is subject to change without any prior notice. The Company reserves the right to make modifications and alternations to this statement as may be required from time to time without any prior approval. MOSL, its associates, their
directors and the employees may from time to time, effect or have effected an own account transaction in, or deal as principal or agent in or for the securities mentioned in this document. They may perform or seek to perform investment banking or other
services for, or solicit investment banking or other business from, any company referred to in this report. Each of these entities functions as a separate, distinct and independent of each other. The recipient should take this into account before interpreting
the document. This report has been prepared on the basis of information that is already available in publicly accessible media or developed through analysis of MOSL. The views expressed are those of the analyst, and the Company may or may not
subscribe to all the views expressed therein. This document is being supplied to you solely for your information and may not be reproduced, redistributed or passed on, directly or indirectly, to any other person or published, copied, in whole or in part, for
any purpose. This report is not directed or intended for distribution to, or use by, any person or entity who is a citizen or resident of or located in any locality, state, country or other jurisdiction, where such distribution, publication, availability or use would
be contrary to law, regulation or which would subject MOSL to any registration or licensing requirement within such jurisdiction. The securities described herein may or may not be eligible for sale in all jurisdictions or to certain category of investors.
Persons in whose possession this document may come are required to inform themselves of and to observe such restriction. Neither the Firm, not its directors, employees, agents or representatives shall be liable for any damages whether direct or
indirect, incidental, special or consequential including lost revenue or lost profits that may arise from or in connection with the use of the information.
The person accessing this information specifically agrees to exempt MOSL or any of its affiliates or
employees from, any and all responsibility/liability arising from such misuse and agrees not to hold MOSL or any of its affiliates or employees responsible for any such misuse and further agrees to hold MOSL or any of its affiliates or employees free and
harmless from all losses, costs, damages, expenses that may be suffered by the person accessing this information due to any errors and delays.
Registered Office Address: Motilal Oswal Tower, Rahimtullah Sayani Road, Opposite Parel ST Depot, Prabhadevi, Mumbai-400025; Tel No.: 022-3980 4263;
www.motilaloswal.com.
Correspondence Address: Palm Spring Centre, 2nd Floor, Palm Court
Complex, New Link Road, Malad (West), Mumbai- 400 064. Tel No: 022 3080 1000. Compliance Officer: Neeraj Agarwal, Email Id:
na@motilaloswal.com,
Contact No.:022-30801085.
Registration details of group entities: MOSL: SEBI Registration: INZ000158836 (BSE/NSE/MCX/NCDEX); CDSL: IN-DP-16-2015; NSDL: IN-DP-NSDL-152-2000; Research Analyst: INH000000412. AMFI: ARN 17397. Investment Adviser: INA000007100.
Motilal Oswal Asset Management Company Ltd. (MOAMC): PMS (Registration No.: INP000000670) offers PMS and Mutual Funds products. Motilal Oswal Wealth Management Ltd. (MOWML): PMS (Registration No.: INP000004409) offers wealth
management solutions. *Motilal Oswal Securities Ltd. is a distributor of Mutual Funds, PMS, Fixed Deposit, Bond, NCDs, Insurance and IPO products. * Motilal Oswal Commodities Broker Pvt. Ltd. offers Commodities Products. * Motilal Oswal Real
Estate Investment Advisors II Pvt. Ltd. offers Real Estate products. * Motilal Oswal Private Equity Investment Advisors Pvt. Ltd. offers Private Equity products
*MOSL has been amalgamated with Motilal Oswal Financial Services Limited (MOFSL) w.e.f August 21, 2018 pursuant to order dated July 30, 2018 issued by Hon'ble National Company Law Tribunal, Mumbai Bench. The existing registration no(s) of
MOSL would be used until receipt of new MOFSL registration numbers.
 Motilal Oswal Financial Services
Quant Research & India Strategy Gallery