8 April 2019
Market snapshot
Equities - India
Sensex
Nifty-50
Nifty-M 100
Equities-Global
S&P 500
Nasdaq
FTSE 100
DAX
Hang Seng
Nikkei 225
Commodities
Brent (US$/Bbl)
Gold ($/OZ)
Cu (US$/MT)
Almn (US$/MT)
Currency
USD/INR
USD/EUR
USD/JPY
YIELD (%)
10 Yrs G-Sec
10 Yrs AAA Corp
Flows (USD b)
FIIs
DIIs
Volumes (INRb)
Cash
F&O
Note: *Average
Close
38,862
11,666
18,246
Close
2,893
7,939
7,447
12,010
11,692
21,808
Close
70
1,292
6,385
1,864
Close
69.2
1.1
111.7
Close
7.4
8.4
5-Apr
0.12
-0.05
5-Apr
329
6,238
Chg .%
0.5
0.6
0.8
Chg .%
0.5
0.6
0.6
0.2
0.0
0.4
Chg .%
1.6
0.0
-0.8
-0.4
Chg .%
0.1
0.0
0.1
1MChg
0.01
0.01
MTD
1.41
-0.14
MTD*
387
10,487
CYTD.%
7.7
7.4
2.1
CYTD.%
15.4
19.6
10.7
13.7
15.5
9.0
CYTD.%
31.6
0.7
7.3
0.1
CYTD.%
-0.8
-2.2
1.9
CYTDchg
0.0
-0.1
CYTD
8.14
-1.89
CYTD*
357
10,074
Today’s top research theme
India Strategy | 4QFY19 Preview—India's PE movement: Politics to
Economy; Banks dominate the earnings revival
The 4QFY19 earnings-report season will be a repeat of 3QFY19, with Financials
driving the performance singlehandedly. Global Cyclicals - the driver of earnings
growth over the last few quarters - have decelerated sharply and are expected to
post decline of 14% in profit.
Corporate banks will account for entire growth in the Nifty and the broader
MOFSL Universe's earnings performance.
We expect MOFSL Universe PAT to grow 29% YoY. Defensives are expected to
post flat profits YoY, whereas Domestic Cyclicals will post 4x YoY jump in PAT.
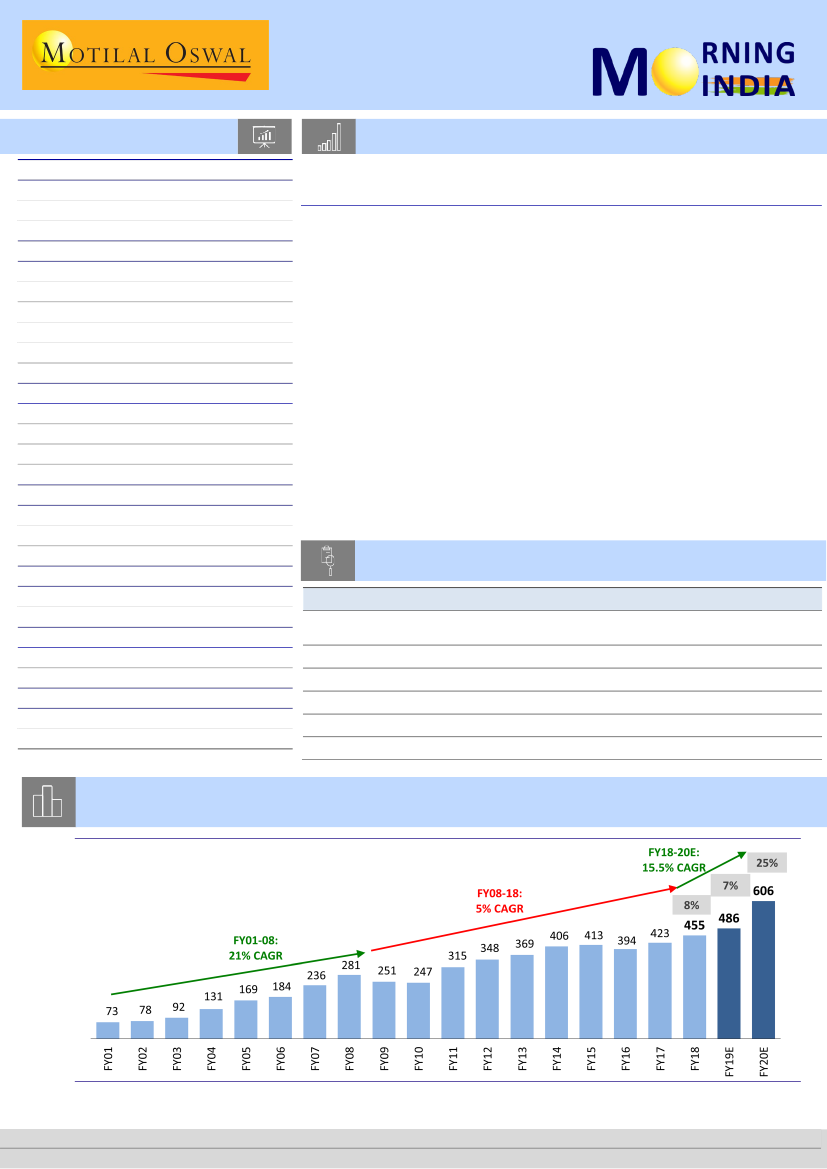
We expect Nifty sales, EBITDA and PAT to increase by 11%, 2% and 15% on a base
of 16%, 22% and 8% growth, respectively. Ex-Corporate Banks, Nifty profits are
expected to decline 2.7% YoY. Our Nifty EPS estimates for FY19/20 have been cut
by 2.1%/3.6% to INR486/INR606 (prior: INR496/INR629), building in EPS growth
of 6.8%/24.8% for the Nifty for FY19/20.
Our top ideas: Large-Caps: ICICI Bank, SBI, Maruti, Titan, Coal India, Bharti Airtel,
L&T, Infosys,ACC. Mid-Caps: Federal Bank, Shriram Transport, Godrej Agrovet,
Indian Hotels, Marico, IGL, Exide, Jindal Steel, Alkem Labs.
Research covered
Cos/Sector
India Strategy -
4QFY19 Preview
Indiabulls Hsg. Fin
HDFC Bank
Financials
Gujarat Gas
NIIT Tech.
Key Highlights
India's PE movement: Politics to Economy; Banks dominate the
earnings revival
Announces amalgamation with LVB- a marriage of convenience
Advances in line; Deposit growth improves sequentially
Decoding FY19 – The turning point!
Strong volume growth outlook
Baring Private Equity Asia to acquire NIIT Ltd’s 30% stake
Chart of the Day: Nifty EPS – expect 16% CAGR over FY18-20, significantly higher than the
5% CAGR over FY08-18
Research Team (Gautam.Duggad@MotilalOswal.com)
Motilal Oswal research is available on www.motilaloswal.com/Institutional-Equities, Bloomberg, Thomson Reuters, Factset and S&P Capital.
Investors are advised to refer through important disclosures made at the last page of the Research Report.