7 May 2019
Update
| Sector: Technology
Wipro
Neutral
BSE SENSEX
38,600
S&P CNX
11,598
CMP: INR294
TP: INR280 (-5%)
Trend of declining Legacy and expanding Digital is accelerating
We hosted Wipro’s CFO Mr Jatin Dalal for an interaction on the demand environment and
the company’s prospects. Key highlights:
n
Amid an otherwise healthy demand environment, there are pockets of slowness and
also instances of sales cycles elongating by 5-8 weeks.
n
The trend of slow Legacy and fast Digital is accelerating further.
n
Deal sizes in Digital have inched up to USD5-8m from USD2-5m. Small-sized deals are
not a bad phenomenon given the attractive price points.
n
Productivity demands in Legacy deals are only increasing (even more than 5%
annually), making it imperative to be Automation-ready.
n
Localization drive began around three years ago, helping WPRO operate stably in the
current supply crunch. The focus is on retaining lateral staff, as replacement is
costlier than higher wages for current employees.
n
Valuation view: We expect the IT Services EBIT to stabilize at 18-19% and the overall
margin to pick up as losses in smaller segments reduce. We expect a CAGR (FY19-21)
of 6.6% in USD revenue and 11% in earnings. The stock trades at 17.1/16.0x
FY20E/21E earnings. Our TP of INR280 discounts forward earnings by 15x and implies
that the stock is fairly valued. We maintain Neutral on the stock.
Stock Info
Bloomberg
Equity Shares (m)
M.Cap.(INRb)/(USDb)
52-Week Range (INR)
1, 6, 12 Rel. Per (%)
12M Avg Val (INR M)
Free float (%)
WPRO IN
5,701
1772.4 / 25.5
299 / 190
14/12/34
1653
26.2
Financials Snapshot (INR b)
2019 2020E
Y/E Mar
Net Sales
585.8 623.4
EBITDA
117.0 135.4
PAT
91.6
97.4
EPS (INR)
14.8
17.1
Gr. (%)
10.1
15.6
BV/Sh (INR)
94.5
86.4
RoE (%)
17.4
18.4
RoCE (%)
14.6
17.4
P/E (x)
25.5
17.1
P/BV (x)
4.0
3.4
2021E
677.1
147.1
104.7
18.4
7.5
92.7
20.6
20.1
16.0
3.2
Shareholding pattern (%)
As On
Mar-19 Dec-18 Mar-18
Promoter
73.9
74.3
74.3
DII
6.5
7.6
6.6
FII
9.4
8.9
9.8
Others
10.3
9.2
9.3
FII Includes depository receipts
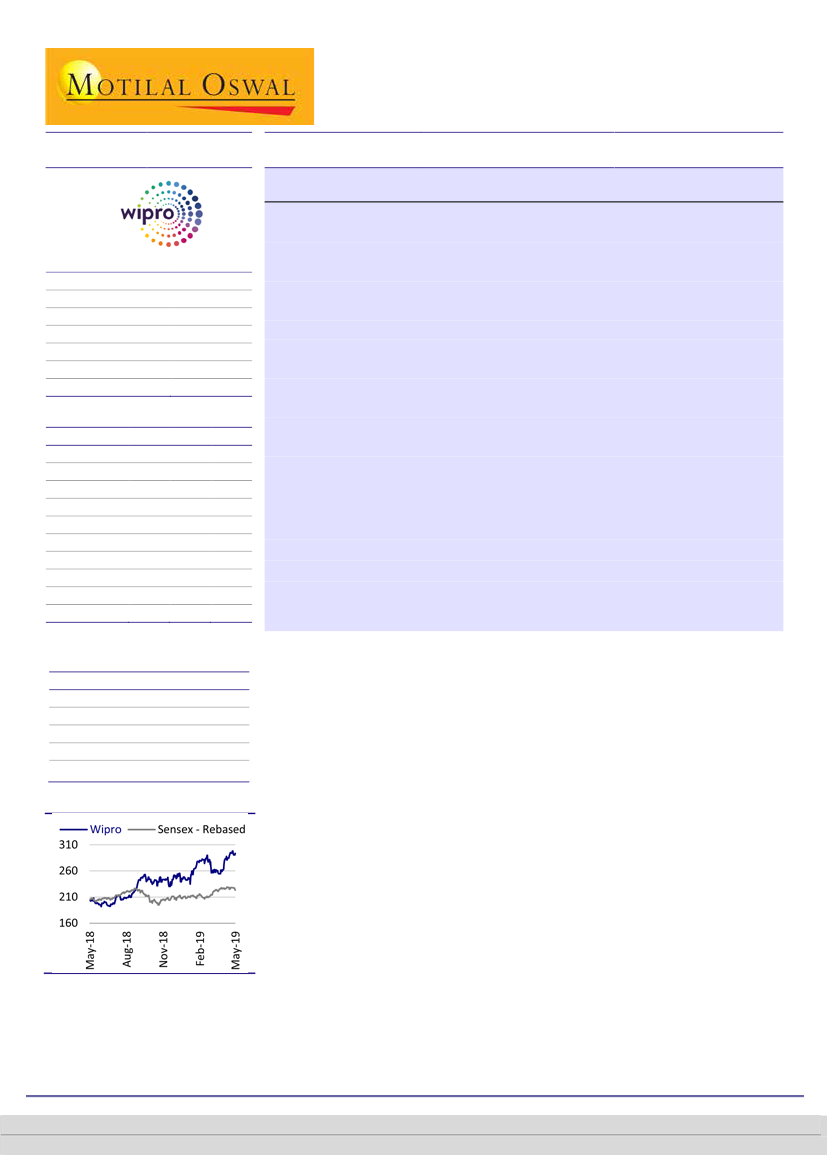
Stock Performance (1-year)
Healthy demand environment, but pockets of slowness elongating deal
cycles
n
n
The demand environment remains healthy, though the trend of slowness in
traditional and high growth in Digital is accelerating further. With that, sales
cycles are also stretching and being elongated by 5 to 8 weeks on an average.
WPRO is likely to start the year (1QFY20) on a flattish note – more due to
seasonality of passing on productivity benefits.
Verticals: BFS, Consumer BU should continue to lead the growth charge
n
BFS – WPRO will continue looking for more large deals like Alight Solutions for
growth. These are likelier to be in the US, given that Europe has some labor
law challenges. Top-client slowdown will not impact much. Overall, this
vertical is likely to grow above the company growth rate in FY20 too. Residual
impact from the Alight deal is ~3% on BFSI growth.
Ashish Chopra
– Research analyst
(Ashish.Chopra@MotilalOswal.com); +91 22 6129 1530
Research Analyst: Anmol Garg
(Anmol.Garg@MotilalOswal.com); +91 22 7193 4271 /
Mohit Sharma
(Mohit.Sharma@MotilalOswal.com)
Investors are advised to refer through important disclosures made at the last page of the Research Report.
Motilal Oswal research is available on www.motilaloswal.com/Institutional-Equities, Bloomberg, Thomson Reuters, Factset and S&P Capital.
 Motilal Oswal Financial Services
Wipro
Exhibit 1: BFSI growth rate remains strong
Finance Solutions (YoY CC %)
14.5%
8.1%
10.8%
14.5%
14.4%
16.0%
17.5%
15.9%
Source: Company, MOFSL
n
Healthcare – This vertical will come back slowly as HPS revenue (USD30m) is
now less significant. ‘Payer’ segment is seeing some slowness (60-65% of
Healthcare revenues). ‘Provider’ segment continues to do well (generally
comprises IMS deals but ticket sizes are not large).
Exhibit 2: Healthcare is making a comeback, albeit gradually, with HPS becoming
insignificant
0.0%
-2.0%
-4.0%
-6.0%
-8.0%
-10.0%
-12.0%
-10.5%
-8.5%
-6.3%
-7.7%
-4.4%
-4.1%
-2.3%
-0.6%
Healthcare, Life Sciences & Services
Source: Company, MOFSL
n
Communications – The segment should be able to mirror company average
growth this fiscal, with demand drivers led by 5G. Some client-specific issues
that marred FY19 are now behind.
Exhibit 3: Communications is reviving with client issues of FY19 largely behind
Communications (YoY CC %)
3.2%
-7.8%
-12.1%
-12.8%
-6.7%
-14.4%
-13.6%
-3.2%
Source: Company, MOFSL
7 May 2019
2
 Motilal Oswal Financial Services
Wipro
n
Manufacturing and Technology: Headwinds exist and both verticals may remain
sluggish in the foreseeable future. 4QFY19 was affected by seasonality, but even
going forward, volumes may be impacted in the Technology vertical.
Exhibit 4: Manufacturing and Technology continue facing headwinds and growth challenges
Manufacturing (YoY CC %)
4.6%
-0.2%
-3.2%
-6.0%
-1.6%
7.2%
Technology (YoY CC %)
0.1%
-5.3%
Source: Company, MOFSL
n
Consumer and Energy & Utilities are expected to grow at normal company
growth rates.
Exhibit 5: Traction in Consumer business unit continues
Consumer Business Unit (YoY CC %)
14.8%
7.7%
2.2%
4.8%
10.0%
2.9%
4.5%
5.6%
Source: Company, MOFSL
Exhibit 6: Energy, Natural Resources & Utilities is growing in higher-single-digits
Energy, Natural Resources & Utilities (YoY CC %)
7.0%
9.8%
5.2%
-2.7%
-3.1%
0.0%
-4.3%
9.4%
Source: Company, MOFSL
Digital – smaller deals are healthy from the pricing standpoint
n
Digital contributes 35% of revenues and growing at a high growth rate (35% YoY
in FY19).
3
7 May 2019
 Motilal Oswal Financial Services
Wipro
n
n
n
n
Digital services have lower deal sizes and deal duration when compared to
traditional IT services outsourcing deals. Average deal sizes were earlier in the
range of USD2-5m and have now increased to USD5-8m. They are expected to
remain low and management doesn’t see it increasing to USD20-30m in the
near future. Average deal duration is likely to be in the range of 9-15 months.
Smaller deal sizes are better for suppliers as it allows them to better price their
statement of work (SOW) component and is not complex like in large traditional
deals.
Wipro Digital’s acquisition of Cooper (SFO based) in Oct’17 was a USD5-7m deal.
Cooper is strongly connected to a large internet player’s marketing team. While
WIPRO was already connected to the CIO division through Apps and Infra, this
small acquisition is a way to expand in the account, and may help go beyond
traditional services like towards the engineering side.
Operating cash flow/EBTIDA ratio has considerably improved over the last four
years and will be 100% now with growth in Digital services (for Accenture, it is
115% mainly because it is 60% Digital already).
Exhibit 7: Digital revenues growing at high rate of 30%+ YoY
Digital as % of Total Revenue (%)
35
20
10
22
22
4
22
24
8
0
25
5
27
10
28
31
YoY (%)
40
38
33
35
31
11
Source: Company, MOFSL
Traditional deals remain under ever-increasing productivity pressure
n
n
Productivity demands in Legacy deals are increasing. Automation has now
become a key differentiator to win deals, as clients typically expect additional
5% productivity at the start of the deal itself. Hence, automation capability and
offerings like HOLMES are key.
WPRO is choosy when it comes to large deals and is chasing only the profitable
ones.
Margin outlook amid the supply situation
n
n
n
Margins are likely to remain at the current levels – the near-term range was
18.6%-19.8%. There is room to squeeze G&A further.
Localization:
WPRO has a good localization ratio. It has increased from 33% in
the US to 64% in three years. Supply situation overall has improved at onsite
locations.
Attrition:
Looking at retaining lateral employees by keeping salary hikes higher.
Salary hikes do not hurt the cost base as much as hiring of laterals from outside.
7 May 2019
4
 Motilal Oswal Financial Services
Wipro
Exhibit 8: EBIT margin improved in 2HFY19, should remain range-bound
IT Services. EBIT Margin (%)
16.8
17.3
17.2
16.0
17.2
19.8
15.0
19.0
Valuation view
A foreword on the long-term industry view:
Growth for Indian IT should gradually
pick up from current 6-7% as Digital services proliferate, which today are still small
to move the needle on the overall performance. India will remain the hotbed for
talent supply en masse, making a case for increasing shift of Digital business from
onsite. That said, with Automation the top priority of every Board, without
exceptions, delineation of revenue growth with headcount growth appears obvious
– and the only lever to stem the decline in profitability witnessed in recent years.
WPRO against that industry backdrop
n
n
New leadership:
The change in leadership at WPRO has been followed by some
tweaks to the organization structure, while role redundancies and senior exits
are a natural consequence of the process. WPRO to its credit got through with
most of those changes swiftly – to shift the focus on execution of the strategy
than the distraction from getting the team in place.
Several changes to realign organization:
It laid out six themes that define its
strategic direction.
[1] Digital
– now 35% of total revenue and growing significantly above company
average.
[2] Client mining
– growth in the top 10 customers has been picking up for
WPRO, with it bettering company average.
[3] Markets
– the company has ramped up its localization efforts and added
several sites across key markets.
[4] Non linearity
– focusing on R&D efforts, applying for patents and further
augmenting capabilities of HOLMES.
[5] Hyper-automation
– while significant progress was seen in automating L1
tasks, it has also started seeing productivity improvement in L2 activities.
[6] Partner ecosystem
– significant ramp-up seen in acquisitions, investments
and partnerships.
Despite these changes, WPRO has failed to lift overall growth because of industry-
and client-specific issues. As these near-term headwinds end, the company would
be able to see higher revenue and earnings growth – a convergence to industry
growth rates.
7 May 2019
5
 Motilal Oswal Financial Services
Wipro
Valuation and view – performance lacking broad-based traction
n
n
n
n
n
As WPRO’s new leader, Mr Abid Ali has chalked out an aggressive plan for the
company, targeting to reach USD15b revenues with 23% EBIT margin. That
implies revenue CAGR of ~20% over the next four years, and if the margins
attain the 300bp expansion, then even higher CAGR for earnings. However, as is
the case with INFO, this is far-fetched and they will do well to get anywhere
near these levels given the current momentum in the bread-n-butter business.
Much before that, WPRO expected to catch up with industry growth by 4QFY18.
However, revenue growth YoY has decelerated over the last six quarters. The
guidance of 2.6-4.7% YoY CC growth for 2QFY19 finally shows a reversal in
trajectory. However, issues continue to haunt WPRO and there’s more pain,
although lesser than earlier (as indicated from 1QFY20 guidance). A clean chit is
therefore still a while away.
Growth underperformance at WPRO is an outcome of persistent issues with the
portfolio mix, while Healthcare has turned the corner and Energy & Utilities has
started to stabilize (minus Utilities); performance in India and Middle East is
being impacted by restructuring. These issues make it difficult to make a case
for an immediate recovery in the performance.
WPRO has been active on the investment front, with spending aimed toward
building capabilities, training and incentivizing people, acquiring businesses, and
investing in strategic accounts. This has dragged margins over the past few
years. Although some benefits are expected to kick in with Automation stepping
in, the recovery in the near term can be ruled out because of the lack of revenue
growth and the continued weakness in certain pockets.
Valuation view:
We expect the IT Services EBIT to stabilize at 18-19% and the
overall margin to pick up as losses in smaller segments reduce. We expect a
CAGR (FY19-21) of 6.6% in USD revenue and 11% in earnings. The stock trades at
17.1/16.0x FY20E/21E earnings. Our TP of INR280 discounts forward earnings by
15x and implies that the stock is fairly valued. We maintain
Neutral
on the stock.
Key triggers
n
n
n
Seizure of issues in India and Middle East.
Broad-basing of growth across verticals.
Uptick in margins from automation and productivity initiatives.
Key risk factors
n
n
n
Prolonged weakness in Healthcare/Manufacturing verticals.
Weakness in top accounts.
Softness in the Americas and Europe.
7 May 2019
6
 Motilal Oswal Financial Services
Wipro
Story in charts
Exhibit 9: Growth guidance subdued on 1Q seasonality
Midpoint of QoQ CC growth guidance (%)
3.0
2.0
2.0
1.3
1.0
0.5
Exhibit 10: Expect revenue growth to accelerate in FY20
Revenue (USD m)
18.9
13.4
5.0
6.4
7.0
3.7
4.9
2.5
2.9
6.0
7.4
Growth (%)
0.0
-1.0
-1.0
Source: Company, MOFSL
Exhibit 11: IT Services EBIT margin expected to be in 19%
range
IT Services EBIT margin (%)
IT Services SGA as % of Sales
Exhibit 12: Improvement in margins supported by higher
utilization
Utilization % (incl. trainees)
Utilization % (excl. trainees)
Source: Company, MOFSL
Exhibit 13: Digital revenues growing at high rate of 30%+
Digital as % of Total Revenue (%)
35
20
22
22
4
22
24
8
0
25
5
27
10
28
31
33
40
YoY (%)
38
31
35
Exhibit 14: OCF/EBITDA ratio has improved on the back of
digital growth…
OCF/EBITDA (%)
85%
99%
77%
70%
75%
73%
10
11
Source: Company, MOFSL
7 May 2019
7
 Motilal Oswal Financial Services
Wipro
Exhibit 15: Operating metrics
Services Composition (%)
IMS
BPO
Product Engg and Mobility
Wipro Analytics
Application Services
Total
Verticals (%)
Finance Solutions
Manufacturing
Healthcare & LifeScience
Energy, Natural Resources & Utilities
Communications
Consumer
Technology
Geography (%)
Americas
Europe
ROW
Customer size distribution (TTM)
> $100M
> $75M
> $50M
> $20M
> $10M
> $5M
> $3M
> $1M
Customer metrics
Revenue from Existing customers %
Number of new customers
Total Number of active customers
EMPLOYEE METRICS
Closing Headcount - IT Services
Sales & Support staff - IT Services (average)
Utilization
Gross Utilization (%)
Net Utilization (excl. support) (%)
Net Utilization (excl. trainees) (%)
Attrition
Voluntary TTM
Voluntary Quarterly Annualized
BPO - Quarterly
BPO - Post training
Customer Concentration (%)
Top customer
Top 5
Top 10
2QFY18
27.2
12.4
7.1
7.2
46.1
100.0
27.6
8.9
14.0
13.5
6.60
15.10
14.30
54.80
25.60
19.60
9
16
39
89
170
261
358
591
99.1
40
1167
1,59,300
14,880
72.9
81.8
82.5
16.0
16.9
13.5
11.9
3.2
11.2
18.4
3QFY18
27.3
12.9
7.0
7.1
45.7
100.0
28.3
8.8
14.3
12.7
6.50
15.10
14.30
54.10
36.50
19.40
9
17
41
89
167
263
352
599
98.1
79
1201
1,58,865
14,881
71.0
80.0
81.9
16.1
16.2
12.8
11.1
3.2
11.5
18.2
4QFY18
27.6
12.4
7.4
7.1
45.5
100.0
28.7
8.9
14.2
12.7
5.90
15.00
14.60
53.80
27.50
18.70
8
20
39
94
171
268
357
595
97.4
57
1178
1,59,923
15,215
73.1
82.4
83.4
16.8
17.7
11.3
9.8
3.6
12.2
18.8
1QFY19
26.3
12.4
7.4
7.2
46.7
100.0
29.8
8.4
13.6
12.7
5.70
15.30
14.50
56.00
26.10
17.90
8
19
40
91
171
268
359
595
99.5
75
1184
1,60,846
15,076
74.5
83.9
85.2
17.1
17.8
10.8
9.5
3.7
11.9
18.7
2QFY19
25.6
12.9
7.4
7.8
46.3
100.0
30.5
8.3
13.0
12.8
5.80
15.70
13.90
56.10
25.70
18.20
9
19
39
92
177
265
348
584
98.6
76
1131
1,71,451
14,862
74.4
83.2
85.5
17.5
18.5
12.3
11.2
3.7
12.2
19.1
3QFY19
25.0
14.7
7.1
7.6
45.6
100.0
31.4
8.1
13.1
13.0
5.80
15.60
13.00
57.10
25.50
17.40
10
19
41
99
171
269
339
578
97.9
57
1132
1,72,379
14,575
73.4
81.9
83.2
17.9
17.5
10.5
9.4
3.7
13.0
19.7
4QFY19
25.2
14.9
7.2
7.6
45.1
100.0
31.5
8.0
13.2
12.8
5.82
16.2
12.6
58.2
24.6
17.2
10
22
41
96
172
262
339
571
97.6
63
1115
1,71,425
14,360
75.4
84.1
85.4
17.6
16.6
11.8
10.8
3.7
13.7
20.4
Source: MOFSL, Company
7 May 2019
8
 Motilal Oswal Financial Services
Wipro
Financials and Valuations
Key Assumptions
Y/E March
INR/USD Rate
Revenues (USD m)
Offshore Revenue (%)
Total Headcount
Net Addition
Per Capita Productivity (USD)
Gross Utilization (%)
IT Services EBIT Margin (%)
2014
60.4
6,618
45.9
1,46,053
241
45,312
66.4
22.6
2015
62.2
7,082
46.0
1,58,217
12,164
44,759
68.7
22.0
2016
66.3
7,346
45.9
1,72,912
14,695
42,486
68.9
20.5
2017
68.6
7,705
46.4
1,81,482
8,570
42,453
71.6
17.9
2018
66.9
7,895
46.8
1,59,923
-21,559
49,369
72.3
16.8
2019
70.5
8,120
47.7
1,71,425
11,502
47,369
74.4
17.8
2020E
70.5
8,604
47.7
1,82,675
11,250
47,098
73.3
18.5
2021E
71.5
9,240
48.1
1,92,625
9,950
47,971
74.8
18.5
Income Statement
Y/E March
Sales
Change (%)
Operating Costs
SG&A
EBITDA
% of Net Sales
Depreciation & Amort.
EBIT
Margins
Other Income
PBT
Tax
Rate (%)
PAT
Minority Interest
Adjusted PAT
Extraordinary items
Reported PAT
Change (%)
2014
4,34,269
16.0
2,84,383
52,787
97,099
22.4
11,106
85,993
19.8
15,012
1,01,005
22,601
22.4
78,404
0
78,404
0
78,404
27.1
2015
4,69,545
8.1
3,08,460
56,476
1,04,609
22.3
12,823
91,786
19.5
19,897
1,11,683
24,594
22.0
87,089
0
87,089
0
87,089
11.1
2016
5,12,440
9.1
3,41,759
62,562
1,08,119
21.1
14,965
93,154
18.2
21,565
1,14,719
25,305
22.1
89,414
0
89,414
0
89,414
2.7
2017
5,50,402
7.4
3,71,288
70,325
1,08,789
19.8
20,256
88,533
16.1
20,254
1,08,787
25,213
23.2
83,574
0
83,574
-1,702
81,872
-8.4
2018
5,44,871
-1.0
3,64,035
71,651
1,09,185
20.0
21,124
88,061
16.2
19,657
1,07,718
22,390
20.8
85,328
11
85,339
-4,612
80,727
-1.4
2019
5,85,845
7.5
3,93,559
75,320
1,16,966
20.0
19,474
97,492
16.6
20,578
1,18,070
26,379
22.3
91,691
-43
91,648
-2,612
89,036
10.3
2020E
6,23,422
6.4
4,06,933
81,085
1,35,404
21.7
22,850
1,12,555
18.1
13,242
1,25,796
28,304
22.5
97,492
-68
97,424
0
97,424
9.4
(INR Million)
2021E
6,77,113
8.6
4,38,196
91,846
1,47,071
21.7
24,143
1,22,928
18.2
12,252
1,35,180
30,416
22.5
1,04,765
-68
1,04,697
0
1,04,697
7.5
Balance Sheet
Y/E March
Share Capital
Reserves
Net Worth
Minority Interest & others
Loans
Capital Employed
Gross Block
Less : Depreciation
Net Block
Investments
Intangible Assets
Other non current assets
Curr. Assets
Debtors
Inventories
Cash & Bank Balance
Adv., Other Current Assets
Current Liab. & Prov
Net Current Assets
Application of Funds
Closing Cash Bal.
2014
4,932
3,38,567
3,43,499
11,440
51,592
4,06,531
1,27,586
76,137
51,449
60,843
65,358
30,525
2,94,129
1,24,726
2,293
1,17,862
49,248
95,773
1,98,356
4,06,531
1,17,862
2015
4,937
4,03,045
4,07,982
15,315
78,913
5,02,210
1,43,166
88,960
54,206
57,775
76,009
29,459
3,82,584
1,33,869
4,849
1,64,017
79,849
97,823
2,84,761
5,02,210
1,64,017
2016
4,941
4,61,137
4,66,078
22,921
1,25,221
6,14,220
1,68,877
1,03,925
64,952
1,37,851
1,17,832
31,639
3,72,647
1,50,653
5,390
1,04,724
1,11,880
1,10,701
2,61,946
6,14,220
1,04,724
2017
4,861
5,15,443
5,20,304
24,058
1,42,412
6,86,774
1,93,975
1,24,181
69,794
2,99,133
1,41,718
36,003
2,46,868
1,39,941
3,915
62,457
40,555
1,06,742
1,40,126
6,86,774
62,457
2018
9,048
4,73,888
4,82,936
25,141
1,38,259
6,46,336
2,09,748
1,45,305
64,443
2,56,762
1,35,697
73,877
2,29,861
1,43,476
3,370
46,157
36,858
1,14,304
1,15,557
6,46,336
46,157
2019
12,068
5,56,048
5,68,116
22,337
99,469
6,89,922
2,35,380
1,64,779
70,601
2,27,632
1,30,742
53,246
3,50,950
1,23,369
3,951
1,63,460
60,170
1,43,251
2,07,699
6,89,920
1,63,460
2020E
11,402
4,79,646
4,91,048
22,337
87,469
6,00,854
2,54,602
1,64,779
89,823
2,27,632
1,30,742
73,789
2,11,663
1,63,183
3,856
7,678
36,945
1,32,795
78,867
6,00,854
7,678
(INR Million)
2021E
11,402
5,15,516
5,26,918
22,337
75,469
6,24,724
2,67,982
1,64,779
1,03,203
2,27,632
1,30,742
75,924
2,29,935
1,77,198
4,188
10,244
38,304
1,42,711
87,223
6,24,724
10,244
7 May 2019
9
 Motilal Oswal Financial Services
Wipro
Financials and Valuations
Ratios
Y/E March
Basic (INR)
EPS
Cash EPS*
Book Value
DPS
Payout %
Valuation (x)
P/E
EV/EBITDA
EV/Sales
Price/Book Value
Dividend Yield (%)
Profitability Ratios (%)
RoE
RoCE
Turnover Ratios
Debtors (Days)
Asset Turnover (x)
Leverage Ratio
Debt/Equity Ratio(x)
2014
11.9
13.6
52.5
3.0
25.1
31.6
24.1
5.4
7.2
0.8
25.0
22.5
98
8.8
0.2
2015
13.2
15.2
62.3
4.5
34.0
28.5
22.2
5.0
6.1
1.2
23.2
20.2
101
9.3
0.2
2016
13.6
15.9
71.1
2.2
16.5
27.7
21.8
4.6
5.3
0.6
20.5
16.7
101
9.0
0.2
2017
12.5
15.8
79.4
0.7
5.9
30.2
20.7
4.1
4.7
0.2
16.9
13.6
96
8.5
0.3
2018
13.4
17.7
80.4
0.8
6.0
28.1
19.2
3.9
4.7
0.2
17.0
13.2
95
8.4
0.3
2019
14.8
18.4
94.5
1.0
6.8
25.5
16.9
3.4
4.0
0.3
17.4
14.6
83
9.0
0.2
2020E
17.1
21.1
86.4
10.0
58.5
17.1
14.7
3.2
3.4
2.7
18.4
17.4
84
7.9
0.2
2021E
18.4
22.6
92.7
10.0
54.5
16.0
13.5
2.9
3.2
2.7
20.6
20.1
92
7.1
0.2
Cash Flow Statement
Y/E March
CF from Operations
Cash for Wkg. Capital
Net Operating CF
2014
78,034
-10,134
67,900
-7,800
4,958
-2,842
-11,776
0
-23,289
-35,065
60,100
29,993
87,869
29,993
1,17,862
2015
85,633
-7,229
78,404
-11,413
-13,955
-25,368
22,609
0
-29,490
-6,881
66,991
46,155
1,17,862
46,155
1,64,017
2016
84,861
-5,988
78,873
-13,172
-1,24,435
-1,37,607
34,935
0
-35,494
-559
65,701
-59,293
1,64,017
-59,293
1,04,724
2017
88,262
4,511
92,773
-15,274
-1,02,421
-1,17,695
-8,611
0
-8,734
-17,345
77,499
-42,267
1,04,724
-42,267
62,457
2018
85,110
-877
84,233
-20,699
56,652
35,953
-1,31,066
0
-5,420
-1,36,486
63,534
-16,300
62,457
-16,300
46,157
2019
90,587
25,161
1,15,748
-25,632
20,631
-5,001
55,639
-41,821
-7,263
6,555
90,116
1,17,303
46,157
1,17,303
1,63,460
2020E
1,07,100
-26,950
80,150
-42,072
-20,543
-62,615
(INR Million)
2021E
1,16,655
-5,790
1,10,865
-37,523
-2,134
-39,657
12,109
-12,000
-68,752
-68,643
73,343
2,566
7,678
2,566
10,244
Net Purchase of FA
Net Pur. of Investments
Dividend from Subsidiary
Net Cash from Invest.
Issue of Shares/Other adj
Proceeds from LTB/STB
Dividend Payments
Net CF from Finan.
Free Cash Flow
Net Cash Flow
Opening Cash Bal.
Add: Net Cash
Closing Cash Bal.
12,435
-12,000
-1,73,752
-1,73,316
38,078
-1,55,781
1,63,460
-1,55,781
7,678
7 May 2019
10
 Motilal Oswal Financial Services
Wipro
Explanation of Investment Rating
Investment Rating
Expected return (over 12-month)
BUY
>=15%
SELL
< - 10%
NEUTRAL
< - 10 % to 15%
UNDER REVIEW
Rating may undergo a change
NOT RATED
We have forward looking estimates for the stock but we refrain from assigning recommendation
*In case the recommendation given by the Research Analyst is inconsistent with the investment rating legend for a continuous period of 30 days, the Research Analyst shall within
following 30 days take appropriate measures to make the recommendation consistent with the investment rating legend.
Disclosures
The following Disclosures are being made in compliance with the SEBI Research Analyst Regulations 2014 (herein after referred to as the Regulations).
Motilal Oswal Securities Ltd. (MOSL)* is a SEBI Registered Research Analyst having registration no. INH000000412. MOSL, the Research Entity (RE) as defined in the
Regulations, is engaged in the business of providing Stock broking services, Investment Advisory Services, Depository participant services & distribution of various financial
products. MOSL is a subsidiary company of Motilal Oswal Financial Service Ltd. (MOFSL). MOFSL is a listed public company, the details in respect of which are available on
www.motilaloswal.com.
MOSL is registered with the Securities & Exchange Board of India (SEBI) and is a registered Trading Member with National Stock Exchange of India Ltd.
(NSE) and Bombay Stock Exchange Limited (BSE), Multi Commodity Exchange of India (MCX) & National Commodity & Derivatives Exchange Ltd. (NCDEX) for its stock broking
activities & is Depository participant with Central Depository Services Limited (CDSL) & National Securities Depository Limited (NSDL) and is member of Association of Mutual
Funds of India (AMFI) for distribution of financial products. Details of associate entities of Motilal Oswal Securities Limited are available on the website at
http://onlinereports.motilaloswal.com/Dormant/documents/List%20of%20Associate%20companies.pdf
MOSL and its associate company(ies), their directors and Research Analyst and their relatives may; (a) from time to time, have a long or short position in, act as principal in, and
buy or sell the securities or derivatives thereof of companies mentioned herein. (b) be engaged in any other transaction involving such securities and earn brokerage or other
compensation or act as a market maker in the financial instruments of the company(ies) discussed herein or act as an advisor or lender/borrower to such company(ies) or may have
any other potential conflict of interests with respect to any recommendation and other related information and opinions.; however the same shall have no bearing whatsoever on the
specific recommendations made by the analyst(s), as the recommendations made by the analyst(s) are completely independent of the views of the associates of MOSL even
though there might exist an inherent conflict of interest in some of the stocks mentioned in the research report
MOSL and / or its affiliates do and seek to do business including investment banking with companies covered in its research reports. As a result, the recipients of this report should
be aware that MOSL may have a potential conflict of interest that may affect the objectivity of this report. Compensation of Research Analysts is not based on any specific merchant
banking, investment banking or brokerage service transactions. Details of pending Enquiry Proceedings of Motilal Oswal Securities Limited are available on the website at
https://galaxy.motilaloswal.com/ResearchAnalyst/PublishViewLitigation.aspx
A graph of daily closing prices of securities is available at
www.nseindia.com, www.bseindia.com.
Research Analyst views on Subject Company may vary based on Fundamental
research and Technical Research. Proprietary trading desk of MOSL or its associates maintains arm’s length distance with Research Team as all the activities are segregated from
MOSL research activity and therefore it can have an independent view with regards to Subject Company for which Research Team have expressed their views.
Regional Disclosures (outside India)
This report is not directed or intended for distribution to or use by any person or entity resident in a state, country or any jurisdiction, where such distribution, publication, availability
or use would be contrary to law, regulation or which would subject MOSL & its group companies to registration or licensing requirements within such jurisdictions.
For Hong Kong:
This report is distributed in Hong Kong by Motilal Oswal capital Markets (Hong Kong) Private Limited, a licensed corporation (CE AYY-301) licensed and regulated by the Hong
Kong Securities and Futures Commission (SFC) pursuant to the Securities and Futures Ordinance (Chapter 571 of the Laws of Hong Kong) “SFO”. As per SEBI (Research Analyst
Regulations) 2014 Motilal Oswal Securities (SEBI Reg No. INH000000412) has an agreement with Motilal Oswal capital Markets (Hong Kong) Private Limited for distribution of
research report in Hong Kong. This report is intended for distribution only to “Professional Investors” as defined in Part I of Schedule 1 to SFO. Any investment or investment activity
to which this document relates is only available to professional investor and will be engaged only with professional investors.” Nothing here is an offer or solicitation of these
securities, products and services in any jurisdiction where their offer or sale is not qualified or exempt from registration. The Indian Analyst(s) who compile this report is/are not
located in Hong Kong & are not conducting Research Analysis in Hong Kong.
For U.S.
Motilal Oswal Securities Limited (MOSL) is not a registered broker - dealer under the U.S. Securities Exchange Act of 1934, as amended (the"1934 act") and under applicable state
laws in the United States. In addition MOSL is not a registered investment adviser under the U.S. Investment Advisers Act of 1940, as amended (the "Advisers Act" and together
with the 1934 Act, the "Acts), and under applicable state laws in the United States. Accordingly, in the absence of specific exemption under the Acts, any brokerage and investment
services provided by MOSL , including the products and services described herein are not available to or intended for U.S. persons. This report is intended for distribution only to
"Major Institutional Investors" as defined by Rule 15a-6(b)(4) of the Exchange Act and interpretations thereof by SEC (henceforth referred to as "major institutional investors"). This
document must not be acted on or relied on by persons who are not major institutional investors. Any investment or investment activity to which this document relates is only
available to major institutional investors and will be engaged in only with major institutional investors. In reliance on the exemption from registration provided by Rule 15a-6 of the
U.S. Securities Exchange Act of 1934, as amended (the "Exchange Act") and interpretations thereof by the U.S. Securities and Exchange Commission ("SEC") in order to conduct
business with Institutional Investors based in the U.S., MOSL has entered into a chaperoning agreement with a U.S. registered broker-dealer, Motilal Oswal Securities International
Private Limited. ("MOSIPL"). Any business interaction pursuant to this report will have to be executed within the provisions of this chaperoning agreement.
The Research Analysts contributing to the report may not be registered /qualified as research analyst with FINRA. Such research analyst may not be associated persons of the U.S.
registered broker-dealer, MOSIPL, and therefore, may not be subject to NASD rule 2711 and NYSE Rule 472 restrictions on communication with a subject company, public
appearances and trading securities held by a research analyst account.
For Singapore
In Singapore, this report is being distributed by Motilal Oswal Capital Markets Singapore Pte Ltd (“MOCMSPL”) (Co.Reg. NO. 201129401Z) which is a holder of a capital markets
services license and an exempt financial adviser in Singapore.As per the approved agreement under Paragraph 9 of Third Schedule of Securities and Futures Act (CAP 289) and
Paragraph 11 of First Schedule of Financial Advisors Act (CAP 110) provided to MOCMSPL by Monetary Authority of Singapore. Persons in Singapore should contact MOCMSPL
in respect of any matter arising from, or in connection with this report/publication/communication. This report is distributed solely to persons who qualify as “Institutional Investors”,
of which some of whom may consist of "accredited" institutional investors as defined in section 4A(1) of the Securities and Futures Act, Chapter 289 of Singapore (“the
SFA”). Accordingly, if a Singapore person is not or ceases to be such an institutional investor, such Singapore Person must immediately discontinue any use of this Report and
inform MOCMSPL.
Specific Disclosures
1 MOSL, Research Analyst and/or his relatives does not have financial interest in the subject company, as they do not have equity holdings in the subject company.
2 MOSL, Research Analyst and/or his relatives do not have actual/beneficial ownership of 1% or more securities in the subject company
3 MOSL, Research Analyst and/or his relatives have not received compensation/other benefits from the subject company in the past 12 months
4 MOSL, Research Analyst and/or his relatives do not have material conflict of interest in the subject company at the time of publication of research report
5 Research Analyst has not served as director/officer/employee in the subject company
6 MOSL has not acted as a manager or co-manager of public offering of securities of the subject company in past 12 months
7 MOSL has not received compensation for investment banking/ merchant banking/brokerage services from the subject company in the past 12 months
8 MOSL has not received compensation for other than investment banking/merchant banking/brokerage services from the subject company in the past 12 months
9 MOSL has not received any compensation or other benefits from third party in connection with the research report
10 MOSL has not engaged in market making activity for the subject company
****************************************************************
****************************************************************
7 May 2019
11
 Motilal Oswal Financial Services
Wipro
The associates of MOSL may have:
- financial interest in the subject company
- actual/beneficial ownership of 1% or more securities in the subject company
- received compensation/other benefits from the subject company in the past 12 months
- other potential conflict of interests with respect to any recommendation and other related information and opinions.; however the same shall have no bearing whatsoever on the
specific recommendations made by the analyst(s), as the recommendations made by the analyst(s) are completely independent of the views of the associates of MOSL even
though there might exist an inherent conflict of interest in some of the stocks mentioned in the research report.
- acted as a manager or co-manager of public offering of securities of the subject company in past 12 months
- be engaged in any other transaction involving such securities and earn brokerage or other compensation or act as a market maker in the financial instruments of the
company(ies) discussed herein or act as an advisor or lender/borrower to such company(ies)
- received compensation from the subject company in the past 12 months for investment banking / merchant banking / brokerage services or from other than said services.
The associates of MOSL has not received any compensation or other benefits from third party in connection with the research report
Above disclosures include beneficial holdings lying in demat account of MOSL which are opened for proprietary investments only. While calculating beneficial holdings, It does not
consider demat accounts which are opened in name of MOSL for other purposes (i.e holding client securities, collaterals, error trades etc.). MOSL also earns DP income from
clients which are not considered in above disclosures.
Analyst Certification
The views expressed in this research report accurately reflect the personal views of the analyst(s) about the subject securities or issues, and no part of the compensation of the
research analyst(s) was, is, or will be directly or indirectly related to the specific recommendations and views expressed by research analyst(s) in this report.
Terms & Conditions:
This report has been prepared by MOSL and is meant for sole use by the recipient and not for circulation. The report and information contained herein is strictly confidential and
may not be altered in any way, transmitted to, copied or distributed, in part or in whole, to any other person or to the media or reproduced in any form, without prior written consent
of MOSL. The report is based on the facts, figures and information that are considered true, correct, reliable and accurate. The intent of this report is not recommendatory in nature.
The information is obtained from publicly available media or other sources believed to be reliable. Such information has not been independently verified and no guaranty,
representation of warranty, express or implied, is made as to its accuracy, completeness or correctness. All such information and opinions are subject to change without notice. The
report is prepared solely for informational purpose and does not constitute an offer document or solicitation of offer to buy or sell or subscribe for securities or other financial
instruments for the clients. Though disseminated to all the customers simultaneously, not all customers may receive this report at the same time. MOSL will not treat recipients as
customers by virtue of their receiving this report.
Disclaimer:
The report and information contained herein is strictly confidential and meant solely for the selected recipient and may not be altered in any way, transmitted to, copied or
distributed, in part or in whole, to any other person or to the media or reproduced in any form, without prior written consent. This report and information herein is solely for
informational purpose and may not be used or considered as an offer document or solicitation of offer to buy or sell or subscribe for securities or other financial instruments. Nothing
in this report constitutes investment, legal, accounting and tax advice or a representation that any investment or strategy is suitable or appropriate to your specific circumstances.
The securities discussed and opinions expressed in this report may not be suitable for all investors, who must make their own investment decisions, based on their own investment
objectives, financial positions and needs of specific recipient. This may not be taken in substitution for the exercise of independent judgment by any recipient. Each recipient of this
document should make such investigations as it deems necessary to arrive at an independent evaluation of an investment in the securities of companies referred to in this
document (including the merits and risks involved), and should consult its own advisors to determine the merits and risks of such an investment. The investment discussed or views
expressed may not be suitable for all investors. Certain transactions -including those involving futures, options, another derivative products as well as non-investment grade
securities - involve substantial risk and are not suitable for all investors. No representation or warranty, express or implied, is made as to the accuracy, completeness or fairness of
the information and opinions contained in this document. The Disclosures of Interest Statement incorporated in this document is provided solely to enhance the transparency and
should not be treated as endorsement of the views expressed in the report. This information is subject to change without any prior notice. The Company reserves the right to make
modifications and alternations to this statement as may be required from time to time without any prior approval. MOSL, its associates, their directors and the employees may from
time to time, effect or have effected an own account transaction in, or deal as principal or agent in or for the securities mentioned in this document. They may perform or seek to
perform investment banking or other services for, or solicit investment banking or other business from, any company referred to in this report. Each of these entities functions as a
separate, distinct and independent of each other. The recipient should take this into account before interpreting the document. This report has been prepared on the basis of
information that is already available in publicly accessible media or developed through analysis of MOSL. The views expressed are those of the analyst, and the Company may or
may not subscribe to all the views expressed therein. This document is being supplied to you solely for your information and may not be reproduced, redistributed or passed on,
directly or indirectly, to any other person or published, copied, in whole or in part, for any purpose. This report is not directed or intended for distribution to, or use by, any person or
entity who is a citizen or resident of or located in any locality, state, country or other jurisdiction, where such distribution, publication, availability or use would be contrary to law,
regulation or which would subject MOSL to any registration or licensing requirement within such jurisdiction. The securities described herein may or may not be eligible for sale in all
jurisdictions or to certain category of investors. Persons in whose possession this document may come are required to inform themselves of and to observe such restriction. Neither
the Firm, not its directors, employees, agents or representatives shall be liable for any damages whether direct or indirect, incidental, special or consequential including lost revenue
or lost profits that may arise from or in connection with the use of the information.
The person accessing this information specifically agrees to exempt MOSL or any of its affiliates
or employees from, any and all responsibility/liability arising from such misuse and agrees not to hold MOSL or any of its affiliates or employees responsible for any such misuse
and further agrees to hold MOSL or any of its affiliates or employees free and harmless from all losses, costs, damages, expenses that may be suffered by the person accessing
this information due to any errors and delays.
Registered Office Address: Motilal Oswal Tower, Rahimtullah Sayani Road, Opposite Parel ST Depot, Prabhadevi, Mumbai-400025; Tel No.: 022-3980
4263; www.motilaloswal.com. Correspondence Address: Palm Spring Centre, 2nd Floor, Palm Court Complex, New Link Road, Malad (West), Mumbai- 400 064. Tel No: 022 3080
1000. Compliance Officer: Neeraj Agarwal, Email Id:
na@motilaloswal.com,
Contact No.:022-38281085.
Registration details: MOSL: SEBI Registration: INZ000158836 (BSE/NSE/MCX/NCDEX); CDSL: IN-DP-16-2015; NSDL: IN-DP-NSDL-152-2000; Research Analyst: INH000000412.
AMFI: ARN 17397. Investment Adviser: INA000007100. Motilal Oswal Asset Management Company Ltd. (MOAMC): PMS (Registration No.: INP000000670) offers PMS and Mutual
Funds products. Motilal Oswal Wealth Management Ltd. (MOWML): PMS (Registration No.: INP000004409) offers wealth management solutions. *Motilal Oswal Securities Ltd.
is a distributor of Mutual Funds, PMS, Fixed Deposit, Bond, NCDs, Insurance and IPO products. *Motilal Oswal Real Estate Investment Advisors II Pvt. Ltd. offers Real Estate
products. * Motilal Oswal Private Equity Investment Advisors Pvt. Ltd. offers Private Equity products.
* MOSL has been amalgamated with Motilal Oswal Financial Services Limited (MOFSL) w.e.f August 21, 2018 pursuant to order dated July 30, 2018 issued by Hon'ble National
Company Law Tribunal, Mumbai Bench. The existing registration no(s) of MOSL would be used until receipt of new MOFSL registration numbers.
7 May 2019
12