*
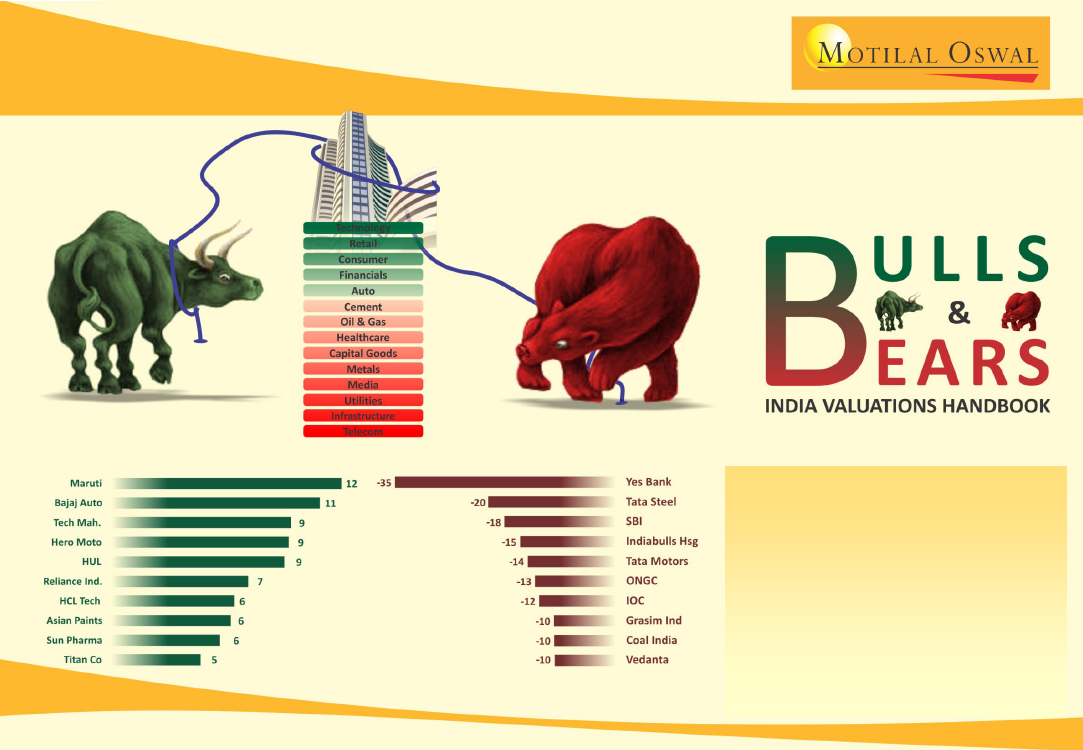
* Sectors in order of premium /
discount to historical averages
BEST PERFORMERS MoM (%)
WORST PERFORMERS MoM (%)
Highlights of Aug’19 edition
Market corrects for third straight
month – Nifty down 1% in August
Technology, Autos, NBFCs and
Healthcare outperforms
FIIs continue to be big seller for second
successive month
Research & Quant Team (Deven@MotilalOswal.com); +91 22 6129 1575
September 2019
 Motilal Oswal Financial Services
Contents
Strategy:
Pain continues; It’s a tale of caution and opportunity now
Valuation deep-dive for the month:
Technology
Indian equities:
Nifty, sector performance and key valuation metrics
Global equities:
Performance and valuation snapshot
Valuations:
Nifty/Mid-cap companies
Sector highlights:
Overview and sector valuations
NOTES:
Prices as on 30th Aug’19
BULL icon:
Sectors trading
at a premium to
historical averages
BEAR icon:
Sectors trading
at a discount to historical
averages
AUTO
BANKS / FINANCIALS
CAPITAL GOODS
CEMENT
CONSUMER
HEALTHCARE
INFRASTRUCTURE
MEDIA
METALS
OIL & GAS
RETAIL
TECHNOLOGY
TELECOM
UTILITIES
Valuations are on
12-month forward basis
unless otherwise
mentioned
Sector valuations are
based on MOSL coverage
companies
Global equities data
sourced from Bloomberg;
Nifty valuations based on
MOSL estimates
Investors are advised to refer to important disclosures made at the end of this report.
BULLS & BEARS | September 2019
2
 Motilal Oswal Financial Services
Strategy:
Pain continues; It’s a tale of caution and opportunity now
Nifty nearly back to square one as the year progresses:
The Nifty extended the previous month’s losses with a decline of 0.9% in Aug’19. In fact, market
sentiment has deteriorated to an extent that the benchmark has wiped off majority of its gains for the year (up just 1.5% now v/s 9.8% YTD CY19 in
May’19). This is a clear indication that after the election euphoria, investors have been dealt with a ‘reality check’. High frequency data (auto numbers, IIP
data, core sector growth) and the recent GDP print (5% for 1QFY20, and more importantly, the internals – PFCE growth of 3%, manufacturing growth of
0.6% and nominal GDP growth of just 8% – was well below expectations) point toward a tough near-term macro. Another distress is that FII selling has
continued (USD1.9b in July, USD2.2b in August) even post the rollback of FPI surcharge. DII inflows, however, remained robust at USD2.9b in the month.
Mid-caps continue underperforming large-caps. On a 12-month basis, mid-cap returns (-21.4%) lagged that of Nifty’s (-5.6%). The Nifty Midcap100 P/E
ratio has corrected from 25.6x in Aug’18 to 14.9x now. Mid-cap premium to the Nifty (13% in Aug’18) has also turned into a discount of 18% in Aug’19.
No cheer from reporting season, downgrades continue:
The first-quarter corporate earnings-report season was disappointing in that both the Nifty and
MOFSL Universe's performance was below our expectations – Nifty earnings growth stood at 5% v/s our estimate of 12%. Moreover, commentaries have
turned weaker across the board. The intensity of earnings downgrades increased with the downgrade/upgrade ratio at 3x. We have revised our Nifty
FY20 EPS down by 4% to INR560, implying 16% YoY growth (ex-corporate banks, we expect Nifty profits to grow just 3% in FY20).
India continues outperforming developed markets:
In Aug’19, MSCI EM (-5%), the UK (-5%), Japan (-4%), Korea (-3%), Taiwan (-2%), Russia (-2%), the
US (-2%), China (-2%), Indonesia (-1), India (-1%) and Brazil (-1%) were the key global markets to close lower in local currency terms. Over the last 12
months, MSCI India and MSCI EM are down 8% and 7%, respectively. Notably, over the last 10 years, MSCI India has outperformed MSCI EM by 86%.
MSCI India’s P/E is at a premium of 91% to MSCI EM’s P/E, above its historical average premium of 50%.
Big cuts in Metals/PSU banks; Auto rebounds from the lows:
Sector-wise, PSU Banks (-15%), Metals (-12%), Cement (-6%), Utilities (-4%) and Capital
Goods (-3%) featured among the top losers in August. Technology (+3%), Autos (+2%), Healthcare (+1%) and NBFCs (+1%) were the only positive
performers. Maruti Suzuki (+12%), Bajaj Auto (+11%), Tech Mahindra (+9%), Hero Moto (+9%) and HUL (+9%) were the top performers on an MoM basis.
Yes Bank (-35%), Tata Steel (-20%), SBI (-18%), Indiabulls Hsg (-15%) and Tata Motors (-14%) were the top laggards. In this edition of ‘Bulls & Bears,’ we
take a deep-dive into the valuation metrics of the Technology sector.
Long grind ahead:
Continued economic slowdown, as manifested in the recent GDP print, clearly points toward a challenging grind ahead for the long-
awaited recovery in earnings. In our view, government announcements to drive growth have not really pulled sentiment as yet, even though it augurs
well from liquidity viewpoint. Multi-year-low 8% nominal GDP growth in 1QFY20 underscores several challenges ahead: [1] government missing its FY20
tax collection targets and [2] continued moderation in top-line and earnings growth momentum for corporate sector. Commentaries from the 180
companies that participated in our 15th AGIC was muted, barring a few sectors like insurance, retail and cement. In particular, the emerging worries in
asset quality take some sheen off the banking earnings and point toward elevated risks of earnings downgrades ahead. The sharp underperformance of
mid-caps versus the Nifty does provide some respite in stock selection. Nevertheless, given the underlying weak economic momentum and our view of
earnings downgrade ahead, we continue preferring large-caps. Our portfolio strategy remains premised on earnings visibility and defensive orientation.
We believe that the Nifty is still expensive at 19.4x FY20E earnings, despite several of its constituents trading at a substantial 30-40% discount to their
respective long-period average valuations. Top bets: Large-cap: ICICI Bank, L&T, Infosys, Bharti Airtel, NTPC, Titan, HUL, HDFC, Ultratech, SBI, Maruti. Mid-
cap: Indian Hotels, Federal Bank, RBL, ABFRL, SRF, Mphasis.
BULLS & BEARS | September 2019
3
 Motilal Oswal Financial Services
Valuation deep-dive for the month: Technology
There has been a haul in growth acceleration after six-quarter upward
momentum. Growth in FY19 was driven by increased deal wins and
commoditization of digital, while the dip in growth in 1QFY20 is a result of
increased macro noises leading to delays in decision making.
While the sector saw some revival in BFSI in FY19 (+4.8% YoY v/s 0% YoY in
FY18), macro provides little confidence on the sustenance in momentum.
BFSI spending has mirrored the US yield rates – with the US 10-year G-sec
yield at an all-time low, there may be a case of status quo on sporadic
spending.
Among other segments, manufacturing is slowing down, while in telecom,
the 5G opportunity has to wait for another 2-3 years. Retail spending has
been modest, despite the underperformance of big-box retailers. E&U
companies have been consistent in their spending.
Most midcap companies have started reporting either vertical-specific or
client-related issues. The YoY growth gap between tier I and II was at its
lowest in the past eight quarters at 0.5%. Led by revenue
underperformance and aggravated contraction in margins, the valuation
gap between tier I and II is now at ~+24% v/s -8% two years ago.
Low unemployment levels in the US, high attrition, the tightening visa
regime and pricing pressure in traditional projects have led to a contraction
in the gross margins. However, there may be some cushion ahead on
margins on account of INR depreciation and rationalization of the pyramid
structure.
The sector is trading at valuations above the historical average and the
broader market index. While the growth rates are anticipated to be lower
than in the past, a high multiple comparable to LPA is still justified,
considering that payout/capital allocation policies have changed for the
better in companies such as INFO and TCS, pushing the rest of sector to
follow suit.
Revenue growth has gradually deteriorated
Aggregate CC organic revenue growth (YoY, %)
Trend in Technology P/E – one-year forward
Technology P/E (x)
27.0
19.0
11.0
3.0
16.8
17.7
17.2
20.0
5 Yr Avg (x)
10 Yr Avg (x)
15 Yr Avg (x)
Technology sector premium/discount to Nifty
160.0
80.0
0.0
-80.0
7.1
10.1
Technology Relative to Nifty PE (%)
15 Yr Avg (x)
BULLS & BEARS | September 2019
4
 Motilal Oswal Financial Services
Key highlights
Indian equities:
August was another harsh ride for the markets
The Nifty slid 0.9% MoM in August after a sharp 5.7% fall in the previous month. This was the third
consecutive month of the market closing in the red.
Sector-wise, PSU Banks (-15%), Metals (-12%), Cement (-6%), Utilities (-4%) and Capital Goods (-3%)
featured among the top losers in August.
Technology (+3%), Autos (+2%), Healthcare (+1%) and NBFCs (+1%) were the only positive performers.
FIIs continued to be big sellers for the second successive month (USD2.2b) in August. Domestic inflows were
robust at USD2.9b in the month.
Stock performance:
Breadth negative; 29 Nifty stocks end lower
Maruti Suzuki (+12%), Bajaj Auto (+11%), Tech Mahindra (+9%), Hero Moto (+9%) and HUL (+9%) were the top
performers on an MoM basis.
Yes Bank (-35%), Tata Steel (-20%), SBI (-18%), Indiabulls Hsg. (-15%) and Tata Motors (-14%) were the main
laggards.
About the product
As the tagline suggests,
BULLS & BEARS
is a
handbook on valuations in
India. Every month, it will
cover:
Valuations of Indian
markets vis-à-vis global
markets
Current valuation of
companies in various
sectors
Sectors that are
currently valued at
premium/discount to
their historical long-
period averages
Global equities:
All major economies end lower
In August, MSCI EM (-5%), the UK (-5%), Japan (-4%), Korea (-3%), Taiwan (-2%), Russia (-2%), the US (-2%),
China (-2%), Indonesia (-1), India (-1%) and Brazil (-1%) were the key global markets to close lower in local
currency terms.
Over the last 12 months, MSCI India and MSCI EM are down by 8/7%. Notably, over the last 10 years, MSCI
India has outperformed MSCI EM by 86%.
MSCI India’s P/E is at a premium of 91% to MSCI EM’s P/E, above its historical average premium of 50%.
Sector valuations:
Technology, Autos, NBFCs and Healthcare top performers
Technology sector trades at a P/E of 20.0x, at a 19% premium to its historical average of 16.8x. Macro noises
are creating some delays in decision making. Almost all companies highlighted that the macro uncertainty is
leading to weak spending in the BFSI space.
Auto sector is trading at a P/E of 17.4x, in line with the historical average of 17.4x. Auto sector’s P/E
multiples continue witnessing de-rating due to weak volumes and the increasing risk of EVs. Moreover,
weak volumes across segments resulted in higher inventory levels, despite production cuts. Feedback on
pre-festive demand is not encouraging as inquires remain tepid, partly impacted by floods in several parts of
the country and demand deferment in anticipation of some sops from the government.
BULLS & BEARS | September 2019
5
 Motilal Oswal Financial Services
Indian equities:
Another harsh ride for the markets
The Nifty slid 0.9% MoM in August after a sharp 5.7% fall in the
Nifty MoM change (%) — third consecutive month of a decline
previous month. This was the third consecutive month of the
Nifty MoM Change (%)
7.7
market closing in the red.
6.2
6.0
5.6
5.8
4.7
4.7
4.6
Sector-wise, PSU Banks (-15%), Metals (-12%), Cement (-6%),
3.73.3 3.4
3.0
2.9
1.5
Utilities (-4%) and Capital Goods (-3%) featured among the top
1.4
1.1
losers in August.
0.1 0.3 0.4
0.0 0.2
1.1
0.9
Technology (+3%), Autos (+2%), Healthcare (+1%) and NBFCs
1.0 1.61.3 1.1
(+1%) were the only positive performers.
3.6
5.0
4.9
5.7
Mid-caps underperformed large-caps by 1%.
6.4
For CY19 YTD, the Nifty is up 1%; Technology (+15%), Real
Estate (+14%), Private Banks (+9%) and NBFCs (+4%) are the top
performers.
Sectoral performance—absolute and relative to Nifty (%) — Technology, Auto,
Metals (-28%), Autos (-24%), Capital Goods (-10%) and
Healthcare and NBFCs only positive performers
Healthcare (-8%) are the key laggards in CY19 YTD.
CY19
CY19
FIIs continue to be big sellers for the second successive month
MoM Abs. Performance (%)
YTD
MoM Relative Perf. (%)
YTD
(USD2.2b) in August. Domestic inflows were robust at USD2.9b.
Ma
Ma
Chg
Chg
Sector
Jan Feb Mar Apr
8
-11
0
-4
-2
-1
-1
-5
1
-8
-6
-11
-7
-2
0
0
2
-1
-1
-2
1
1
-1
-2
-1
-3
6
-2
-5
0
0
0
5
8
3
11
16
9
11
8
11
9
5
25
8
6
0
0
-1
0
1
-3
-4
1
-2
-3
7
1
-3
1
Technology
Auto
Healthcare
NBFC
Consumer
Oil
Real Estate
Midcap100
Banks-Pvt
Cap. Goods
Utilities
Cement
Metal
Banks-PSU
Nifty-50
y
-3
-2
-7
8
-2
2
10
2
6
11
2
3
-7
11
1
Jun Jul
-1
-3
-3
1
-1
-6
0
-2
1
0
4
-4
3
2
-1
Aug
3
2
1
1
0
-1
-1
-2
-3
-3
-4
-6
-12
-15
-1
1
-14
-1
-6
-3
-11
-6
-10
-6
-12
-6
-6
-13
-11
-6
(%)
15
-24
-8
4
-6
-4
14
-12
9
-10
-6
-5
-28
-3
1
Jan Feb Mar Apr
9
-11
0
-4
-2
-1
-1
-5
2
-8
-6
-10
-7
-1
0
2
-1
-1
-2
2
2
-1
-1
-1
-2
6
-1
-5
-8
-8
-3
0
-4
3
8
1
4
0
4
1
-2
17
5
-1
-1
-2
-1
0
-4
-5
0
-3
-4
5
0
-4
y
-4
-4
-9
7
-4
1
8
1
4
9
1
1
-8
9
Jun Jul
0
-2
-2
2
0
-5
1
-1
2
1
5
-3
4
3
6
-8
4
-1
3
-5
0
-4
0
-6
0
-1
-7
-5
Aug
3
3
2
2
1
0
0
-1
-2
-3
-3
-5
-11
-14
(%)
13
-26
-9
2
-8
-6
12
-14
8
-11
-7
-6
-29
-5
Institutional flows (USDb) — second consecutive month of FII
outflows
FIIs (USDb)
DIIs (USDb)
2018
2019
BULLS & BEARS | September 2019
6
 Motilal Oswal Financial Services
Indian equities:
Breadth negative; 29 Nifty stocks end lower
performers on an MoM basis. Yes Bank (-35%), Tata Steel (-20%), SBI (-18%), Indiabulls Hsg. (-15%) and Tata Motors (-14%) were the main laggards.
Nifty – best and worst performers in August:
Maruti Suzuki (+12%), Bajaj Auto (+11%), Tech Mahindra (+9%), Hero Moto (+9%) and HUL (+9%) were the top
Nifty – best and worst performers in CY19YTD:
Bajaj Finance (+26%), Infosys (+23%), Bharti Airtel (+21%), TCS (+19%) and Titan (+19%) were the top performers.
Yes Bank (-67%), Indiabulls Hsg. (-47%), M&M (-34%), Tata Steel (-34%) and Tata Motors (-32%) were the worst performers.
Best and worst Nifty performers (MoM) in August’19 (%) – breadth negative, 58% of Nifty stocks traded lower
12 11 9 9 9
7 6 6 6 5 4
3 3 3 3 2 2 2 2 1 0
-1 -1
-1
-1 -1 -2 -3 -3 -3 -4 -4 -4 -4 -5 -6 -6
-7 -8 -9 -9 -10 -10 -10
-12 -13
-14 -15-18
-20
-35
Best and worst Nifty performers (YoY) in CY19 YTD (%) – 21 companies in Nifty have delivered positive returns so far
26 23 21
19 19 18 14 14 14
11 11 10 10 7
5 5 3 3 3
1
1 1
-2 -2 -2 -4 -4
-6 -7 -8 -9 -11
-13 -13 -13 -14 -17 -18 -18
-19 -21 -23
-28 -29 -30 -31 -32-34 -34
-47
-67
BULLS & BEARS | September 2019
7
 Motilal Oswal Financial Services
Indian equities:
Mid-caps continue underperforming; trade at a discount to large-caps
In Aug’19, the Nifty Midcap100 was down 1.7%, as against the Nifty’s fall of 0.9%. Notably, over the last 12 months, mid-caps were down 21.4%, as
against the Nifty’s fall of 5.6%.
The Nifty Midcap100 P/E ratio has corrected from 25.6x in Aug’18 to 14.9x currently. Mid-cap premium to the Nifty (13% in Aug 18) has turned into a
discount of 18% in Aug’19.
Mid-caps performance v/s large-caps in last five years
195
165
135
105
75
Nifty Rebased
Nifty Midcap 100 Rebased
5 Year CAGR |
Nifty: 6.7% |
Midcap: 7.1%
Mid-caps underperformed large-caps in the last 12 months
107
99
91
83
75
Nifty Rebased
Nifty Midcap 100 Rebased
94
141
139
79
12-month forward P/E (x)
34
28
22
16
10
Midcap PE (x)
Nifty Avg: 20.4x
Midcap Avg: 20.7x
Nifty PE (x)
Mid-caps’ premium to Nifty has turned to discount
Midcap Vs Nifty PE Prem/(Disc) (%)
45
25
Average: 1%
18.2
14.9
5
-15
-35
-18
Source: MOFSL, Bloomberg for Midcap valuation.
BULLS & BEARS | September 2019
8
 Motilal Oswal Financial Services
Indian equities:
Valuations near long-period averages
Valuations of Indian equities are near their long-period averages. The Nifty trades at a 12-month forward P/E of 18.2x, just a 1% premium to its long-
period average of 18.0x. The Nifty’s P/B of 2.5x is also near its historical average.
At the current trailing P/E of 21.4x and forward P/E of 18.2x, we see limited triggers for a further re-rating, unless accompanied by a material surprise
in earnings.
12-month forward Nifty P/E (x)
24
21
18
15
12
10 Year Avg: 18.0x
18.2
23.1
12-month forward Nifty P/B (x)
3.2
2.9
2.6
2.3
2.0
10 Year Avg: 2.6x
2.5
2.9
Trailing Nifty P/E (x)
25
22
19
16
13
10 Year Avg: 19.4x
21.4
Trailing Nifty P/B (x)
3.6
3.2
10 Year Avg: 2.8x
2.8
2.4
2.0
2.8
BULLS & BEARS | September 2019
9
 Motilal Oswal Financial Services
Indian equities:
Market cap-to-GDP below historical average
Nifty trades at a 12-month-forward RoE of 13.8%, below its long-term average of 14.6%.
Market cap-to-GDP ratio is at 67% (FY20E GDP), below its long-term average of 76%.
Trend in Nifty RoE (%)
17.0
16.1
14.9
10 Year Avg: 14.6%
13.8
13.5
12.0
12.5
13.2
16.3
16.1
15.4
14.9
Average of 14.8%
13.6
12.8
12.5
12-month forward Nifty RoE (%)
18.0
17.0
16.5
15.0
13.4
FY09 FY10 FY11 FY12 FY13 FY14 FY15 FY16 FY17 FY18 FY19 FY20E
Trend in India’s market cap-to-GDP (%) – below its long-period averages
95
88
71
Average of 76% for the period
64
66
81
69
79
83
79
67
55
BULLS & BEARS | September 2019
10
 Motilal Oswal Financial Services
Global equities:
All major economies end lower
In August, MSCI EM (-5%), the UK (-5%), Japan (-4%), Korea (-3%), Taiwan (-2%), Russia (-2%), the US (-2%), China (-2%), Indonesia (-1), India (-1%)
and Brazil (-1%) were the key global markets to close lower in local currency terms.
Indian equities are trading at 19.7x FY20E earnings. All key markets continue trading at a discount to India.
India (Nifty) v/s other markets
CY19 YTD Chg (%)
Index
Value
India
US
Taiwan
Indonesia
Japan
Brazil
MSCI EM
Korea
UK
China
Russia
11,023
2,926
10,618
6,328
20,704
101,135
984
1,968
7,207
2,886
4,708
Mkt Cap Local
In USD
(USD T) Currency
1.9
31.4
1.1
0.5
5.6
0.9
13.9
1.2
3.0
6.5
0.6
1
17
9
2
3
15
2
-4
7
16
12
-1
17
6
5
7
8
2
-11
2
11
17
PE (x)
CY18 /
FY19
22.9
19.3
15.0
21.5
15.2
17.2
11.9
10.0
17.1
14.2
5.4
CY19 /
FY20
19.7
17.7
16.1
15.4
14.9
13.2
12.9
12.6
12.5
11.3
5.2
-16
-34
-6
-34
-25
-48
-56
-25
-38
-76
-10
-18
-22
-24
-33
-35
-36
-36
-43
-74
Prem / Disc to India
PE (%)
CY18 /
FY19
CY19 /
FY20
PB (x)
CY18 /
FY19
2.9
3.5
1.6
2.3
1.6
2.1
1.5
0.8
1.7
1.5
0.8
CY19 /
FY20
2.6
3.2
1.7
2.3
1.5
1.8
1.5
0.8
1.6
1.3
0.7
RoE (%)
CY18 /
FY19
12.5
16.0
10.8
10.8
10.4
12.4
12.9
8.2
11.1
10.3
14.8
CY19 /
FY20
13.4
19.1
11.7
16.7
10.2
14.9
12.1
5.4
10.0
11.4
12.2
Source: Bloomberg/MOFSL
MoM Chg (%)
Brazil
India
Indonesia
China
US
Russia
Taiwan
Korea
Japan
UK
MSCI EM
-5
-5
-4
-3
-2
-2
-2
-2
-1
-1
-1
BULLS & BEARS | September 2019
11
 Motilal Oswal Financial Services
Global equities:
MSCI India and EM’s performance in line over last 12 months
Over the last 12 months, MSCI India and MSCI EM are down by 8% and 7%, respectively. Notably, over the last 10 years, MSCI India has
outperformed MSCI EM by 86%.
MSCI India’s P/E is at a premium of 91% to MSCI EM’s P/E, above its historical average premium of 50%.
MSCI India outperformed MSCI EM by 86% over the last five years
250
200
MSCI India Rebased
10 Year CAGR:
MSCI India: 7.4%
MSCI EM: 1.5%
5 Year CAGR:
MSCI India: 4.8%
MSCI EM: -2.0%
MSCI EM Rebased
MSCI EM v/s MSCI India performance over 12 months
106
100
94
88
82
MSCI India Rebased
MSCI EM Rebased
203
117
93
92
150
100
50
MSCI India v/s MSCI EM trailing P/E (x)
33.0
26.0
MSCI India Avg: 20.4x
MSCI India v/s MSCI EM P/E premium (%)
MSCI EM PE (x)
120
MSCI India Vs EM PE Premium (%)
MSCI India PE (x)
25.3
90
60
91
19.0
12.0
5.0
MSCI EM Avg: 13.6x
13.2
30
0
Average of 50%
Source: Bloomberg
BULLS & BEARS | September 2019
12
 Motilal Oswal Financial Services
Global equities:
India’s share in world market cap at its historical average
India’s share in the world market cap is at 2.5%, at its historical average of 2.5%.
Over the last 12 months, the world’s market cap has decreased by 3.9% (USD3.1t), while India’s market cap is down 14% YoY.
Market cap change in last 12 months (%)
Mkt cap chg 12M (%)
Brazil
Average of 2.5%
Curr Mcap (USD Tr)
26
13
12
10
-2
-6
-8
-14
-15
-23
0.9
0.6
0.5
6.5
31.4
1.1
5.6
1.9
3.0
1.2
Trend in India's contribution to world market cap (%)
3.5
3.0
2.5
2.0
1.5
1.6
India's Contribution to World Mcap (%)
3.3
2.5
Russia
Indonesia
China
US
Global market-cap-to-GDP (%)
153
114
108
76
70
49
49
48
39
Current mkt cap to GDP (%)
Taiwan
Japan
India
UK
Korea
* Based on GDP for Dec 2018
Source: Bloomberg
BULLS & BEARS | September 2019
13
 Motilal Oswal Financial Services
Nifty:
NBFCs – Auto dealer inventory declining
The NBFC sector trades at a P/B of 3.3x, marginally above its historical average of 3x. According to our recent interactions with auto managements,
inventory at dealer levels has come down over the past few months. This should result in uptick in growth in this segment. The festival season holds
the key for consumer durables and auto demand.
The liquidity position remains comfortable for NBFCs backed by strong parentage. However, the quest for alternative sources of funding remains for
the rest, with ECBs and retail NCDs being the most preferred routes.
Snapshot: Nifty companies’ valuations
Name
Bajaj Auto
Eicher Motors
Hero MotoCorp
Mahindra & Mahindra
Maruti Suzuki
Tata Motors
Axis Bank
HDFC Bank
ICICI Bank
IndusInd Bank
Kotak Mahindra Bank
State Bank
Bajaj Finance
HDFC
Indiabulls Housing
Larsen & Toubro
Grasim Inds
Ultratech Cement
Asian Paints
Britannia Inds.
Hind. Unilever
ITC
Sector
Auto
Auto
Auto
Auto
Auto
Auto
Banks - Private
Banks - Private
Banks - Private
Banks - Private
Banks - Private
Banks - PSU
Banks - NBFC
Banks - NBFC
Banks - NBFC
Capital Goods
Cement
Cement
Consumer
Consumer
Consumer
Consumer
Current
16.3
20.7
15.9
13.0
24.2
9.5
16.7
22.1
17.6
13.5
29.7
8.9
34.4
44.7
5.5
16.2
9.2
28.5
59.4
48.4
52.8
22.0
PE (x)
Relative to Nifty P/E (%)
10 Yr Avg Prem/Disc (%)
Current
10 Yr Avg
16.2
0
-11
-10
24.0
-14
14
33
17.7
-10
-13
-1
16.9
-23
-29
-6
20.9
16
33
16
12.0
-21
-48
-33
29.7
-44
-8
65
20.8
6
22
16
18.9
-7
-3
5
18.4
-27
-26
2
23.4
27
63
30
13.9
-36
-51
-23
13.8
148
89
-23
35.5
26
146
98
9.5
-42
-70
-47
23.0
-30
-11
28
11.0
-17
-50
-39
27.5
4
57
53
39.1
52
227
118
33.9
43
166
89
37.7
40
190
110
26.5
-17
21
48
Current
3.2
4.1
3.6
1.6
3.7
0.6
2.1
3.4
2.2
2.4
3.9
1.0
7.3
4.2
1.0
2.5
1.1
2.8
14.4
14.4
50.8
4.7
PB (x)
10 Yr Avg Prem/Disc (%)
5.1
-37
6.2
-34
6.9
-48
3.0
-47
3.4
10
1.9
-69
2.0
4
3.4
-1
1.8
23
2.8
-15
2.9
32
1.2
-22
2.6
176
4.5
-6
2.3
-55
3.0
-16
1.7
-38
3.1
-10
11.0
31
12.2
18
31.8
60
7.1
-34
Relative to Nifty P/B (%)
Current
10 Yr Avg
28
99
61
140
43
166
-37
15
48
31
-76
-25
-16
-21
35
33
-14
-32
-6
7
54
14
-62
-53
188
2
68
75
-59
-11
1
17
-58
-34
11
21
472
326
472
373
1917
1133
86
175
BULLS & BEARS | September 2019
14
 Motilal Oswal Financial Services
Nifty:
More than 55% companies are trading at a discount to historical averages
Companies trading at a significant premium to their historical averages:
Asian Paints (+52%), Titan (+44%), Britannia Inds. (+43%), HUL (+40%) and
Reliance Inds. (+29%).
Companies trading at a significant discount to their historical averages:
Tata Steel (-61%), ONGC (-54%), Coal India (-52%), NTPC (-39%) and Bharti
Infratel (-37%).
Sector
Healthcare
Healthcare
Healthcare
Media
Metals
Metals
Metals
Metals
Oil & Gas
Oil & Gas
Oil & Gas
Oil & Gas
Oil & Gas
Retail
Technology
Technology
Technology
Technology
Technology
Telecom
Telecom
Utilities
Utilities
Utilities
Others
Current
20.5
20.5
22.2
18.5
8.9
9.3
6.4
9.8
8.4
9.1
7.5
4.6
15.9
52.9
13.9
20.3
24.2
13.8
14.8
NA
14.8
6.6
8.5
9.4
13.4
18.2
PE (x)
10 Yr Avg Prem/Disc (%)
28.3
-27
25.4
-19
29.5
-25
26.6
-30
9.8
-9
13.3
-30
16.2
-61
11.0
-11
9.9
-16
14.0
-35
9.2
-18
10.1
-54
12.3
29
36.8
44
13.5
3
17.5
16
19.0
27
12.9
6
15.2
-3
32.8
-
23.6
-37
13.7
-52
13.9
-39
12.4
-25
12.9
3
18.0
1
Relative to Nifty P/E (%)
Current
10 Yr Avg
13
57
13
42
22
64
2
48
-51
-45
-49
-26
-65
-10
-46
-39
-54
-45
-50
-22
-59
-49
-75
-44
-13
-31
191
105
-24
-25
11
-3
33
6
-24
-28
-19
-15
-
82
-19
31
-64
-24
-53
-23
-49
-31
-26
-28
Current
2.2
2.4
2.3
3.2
0.9
1.3
0.6
0.8
1.6
1.2
0.9
0.6
1.7
14.8
3.0
5.5
9.3
2.6
2.9
2.0
3.2
4.0
1.0
1.5
2.5
2.5
PB (x)
10 Yr Avg Prem/Disc (%)
3.4
-36
3.9
-38
4.6
-50
5.5
-42
1.3
-31
1.4
-7
1.6
-64
2.1
-62
1.7
-6
1.8
-36
1.1
-20
1.4
-56
1.4
17
9.9
50
3.2
-5
4.1
34
6.4
45
2.7
-2
2.9
-2
2.1
-8
3.5
-8
6.1
-35
1.5
-36
1.8
-15
2.6
-3
2.6
-2
Relative to Nifty P/B (%)
Current
10 Yr Avg
-14
31
-4
51
-8
80
28
114
-64
-49
-49
-47
-77
-38
-69
-20
-38
-36
-54
-29
-64
-56
-75
-45
-34
-45
488
282
21
24
119
59
268
148
5
5
14
13
-22
-18
28
35
57
138
-61
-40
-39
-30
-2
-1
Name
Cipla
Dr Reddy’ s Labs
Sun Pharma
Zee Ent.
Hindalco
JSW Steel
Tata Steel
Vedanta
BPCL
GAIL
IOCL
ONGC
Reliance Inds.
Titan Co.
HCL Technologies
Infosys
TCS
Tech Mahindra
Wipro
Bharti Airtel
Bharti Infratel
Coal India
NTPC
Power Grid Corp.
UPL
Nifty
BULLS & BEARS | September 2019
15
 Motilal Oswal Financial Services
Mid-caps underperform Nifty by 1% in August
The Nifty Mid-cap 100 was down 1.7% in Aug’19, as against the Nifty’s decline of 0.9%.
Best mid-cap performers in Aug: MCX (+20%), Ajanta Pharma (+16%), Delta Corp (+16%), Brigade Ent (+14%) and Phoenix Mills (+8%).
Company
MCX
Ajanta Pharma
Delta Corp
Brigade Enterpr.
Phoenix Mills
DCB Bank
Trident
Blue Star
M & M Financial
CESC
Persistent Sys
Engineers India
Team Lease Serv.
Aegis Logistics
Ipca Labs.
Strides Pharma
Sadbhav Engg.
Indian Hotels
GE T&D India
Alembic Pharma
Sun TV Network
Jyothy Lab.
Emami
Birla Corpn.
Federal Bank
India Cements
LIC Housing Fin.
PE (x)
Current 10 Yr Avg Prem/Disc (%)
27.8
33.4
-17
19.8
16.3
21
19.0
33.1
-43
21.8
15.2
44
24.1
31.2
-23
15.4
16.0
-4
5.8
8.5
-32
26.4
29.2
-9
12.1
17.1
-29
8.2
12.3
-33
10.9
13.7
-21
14.9
19.7
-24
31.2
33.8
-8
17.7
21.4
-17
20.7
25.2
-18
13.0
61.9
-79
12.6
25.0
-50
40.3
57.4
-30
24.0
66.1
-64
16.0
17.8
-10
11.0
20.0
-45
21.7
35.8
-39
21.2
31.1
-32
9.2
15.6
-41
9.3
12.2
-24
11.1
25.2
-56
7.5
11.3
-34
Relative to Nifty P/E (%)
Current
10 Yr Avg
53
86
9
-9
4
84
20
-15
33
74
-15
-11
-68
-53
45
62
-33
-5
-55
-32
-40
-24
-18
9
72
88
-3
19
14
40
-29
245
-31
39
122
219
32
268
-12
-1
-40
11
19
99
16
73
-49
-13
-49
-32
-39
40
-59
-37
PB (x)
Current 10 Yr Avg Prem/Disc (%)
3.4
3.7
-6
3.2
4.3
-25
2.1
2.4
-13
1.7
1.2
46
2.7
2.2
20
1.8
1.5
24
0.8
0.9
-11
6.0
7.9
-23
1.6
2.3
-29
1.0
0.9
15
1.7
2.3
-26
2.7
3.9
-32
6.3
6.0
5
3.7
3.3
12
3.2
3.2
0
1.2
3.2
-64
1.0
2.6
-61
3.5
3.5
-1
2.5
6.6
-63
2.8
4.3
-35
2.5
5.0
-49
3.7
4.4
-18
5.7
10.3
-45
0.8
1.1
-26
1.1
1.2
-10
0.4
0.7
-41
1.1
1.9
-42
Relative to Nifty P/B (%)
Current
10 Yr Avg
36
42
29
68
-16
-6
-32
-55
5
-14
-28
-43
-66
-63
140
205
-36
-12
-60
-66
-33
-11
6
51
149
131
46
27
26
23
-53
26
-59
2
37
35
-3
158
11
66
1
93
45
72
125
298
-67
-57
-57
-53
-83
-73
-56
-26
Price Chg (%)
MoM
CY19YTD
20
33
16
-14
16
-30
14
36
8
23
6
23
6
-15
6
16
5
-32
4
16
4
-13
3
-18
2
-5
2
-7
1
20
-1
-17
-3
-35
-3
-6
-3
-49
-5
-17
-7
-28
-7
-33
-7
-29
-8
-11
-10
-11
-16
-23
-18
-13
BULLS & BEARS | September 2019
16
 Motilal Oswal Financial Services
Sector valuations:
Technology, Autos, NBFCs and Healthcare top performers
Technology sector trades at a P/E of 20.0x, at a 19% premium to its historical average of 16.8x. Macro noises are leading to some delays in decision
making. Almost all companies highlighted that the macro uncertainty is causing weak spending in the BFSI space. Most mid-caps reported pockets of
weakness, which were either client-specific or vertical-related. This led to weak sequential growth across the pack. With a reversal in the USD/INR
trend, there may be some cushion to margins, going forward.
Auto sector is trading at a P/E of 17.4x, in line with the historical average of 17.4x. Auto sector’s P/E multiples continue witnessing a de-rating due to
weak volumes and the increasing risk of EVs. Weak volumes across segments resulted in higher inventory levels, despite production cuts. Feedback
on pre-festive demand is not encouraging as inquires remain tepid, partly impacted by floods in several parts of the country and demand deferment
in anticipation of some sops from the government.
The NBFC sector trades at a P/B of 3.3x,marginally above its historical average. According to our interactions with auto managements, inventory at
dealer levels has come down over the past few months. This should result in uptick in growth in this segment. The festival season holds the key for
consumer durables and auto demand.
Snapshot: Sector valuations
PE (x)
Sector
Auto
Banks - Private
Banks - PSU
NBFC
Capital Goods
Cement
Consumer
Healthcare
Infrastructure
Media
Metals
Oil & Gas
Retail
Technology
Telecom
Utilities
Current
17.4
19.6
9.4
23.8
21.0
20.4
39.8
19.7
7.8
15.9
9.3
10.6
53.4
20.0
Loss
8.2
10 Yr Avg
17.4
18.6
8.1
19.6
27.0
21.7
33.8
24.2
12.4
22.8
12.4
11.3
44.9
16.8
-
12.9
Prem/Disc
(%)
0.0
5.4
17.3
21.7
-22.1
-6.2
17.7
-18.5
-36.6
-30.6
-24.8
-6.4
18.8
18.8
-
-36.1
Relative to Nifty
P/E (%)
Current 10 Yr Avg
-4
-6
8
2
-48
-55
31
8
16
48
12
19
119
88
8
34
-57
-31
-13
27
-49
-31
-42
-35
194
155
10
-5
-55
-26
Current
2.3
2.7
0.8
3.3
2.7
2.1
11.5
2.6
0.8
2.7
0.8
1.3
9.8
5.5
1.3
1.4
PB (x)
10 Yr Avg
3.2
2.4
0.9
3.0
3.3
2.5
10.2
4.1
1.7
4.3
1.3
1.5
6.0
4.3
2.1
2.0
Prem/Disc
(%)
-26.8
13.4
-17.0
9.4
-18.8
-16.5
12.4
-36.3
-54.5
-37.7
-35.8
-12.9
63.0
26.5
-37.2
-31.9
Relative to Nifty P/B
(%)
Current
-7
8
-69
31
8
-16
358
3
-69
6
-66
-48
288
118
-47
-46
10 Yr Avg
24
-8
-64
17
28
-1
301
58
-34
66
-50
-41
132
69
-17
-22
BULLS & BEARS | September 2019
17
 Motilal Oswal Financial Services
Autos:
Festival demand to be tepid, inventory correction continues
Auto sector is trading at a P/E of 17.4x,
in line with
the historical average of 17.4x.
P/E multiples continue witnessing de-rating due to
weak volumes and the increasing risk of EVs.
Weak volumes across segments resulted in higher
inventory levels, despite production cuts.
In Aug’19, volumes for 2Ws/PVs/CVs declined by
17.5% /34.3% /44.5% YoY.
Feedback on pre-festive demand is not encouraging as
inquires remain tepid, partly impacted by floods in
several parts of the country and demand deferment in
anticipation of some sops from the government. Most
OEMs continued their inventory cutting efforts through
production cuts in Aug’19.
5
4
3
2
1
3.2
Auto P/B (x)
10 Yr Avg (x)
38
31
24
17
10
3
17.4
17.4
Auto P/E (x)
10 Yr Avg (x)
70
40
10
-20
-50
-5.8
-4.3
Auto Relative to Nifty PE (%)
70
40
2.3
Auto Relative to Nifty PB (%)
23.7
10
-20
-6.8
Sector Performance
MoM: 2%
Company
Amara Raja Batt.
Ashok Leyland
Bajaj Auto
Bharat Forge
Bosch
CEAT
Eicher Motors
Escorts
Exide Inds.
Hero Motocorp
M&M
Mahindra CIE
Maruti Suzuki
Motherson Sumi
Tata Motors
TVS Motor Co.
Current
19.2
14.5
16.3
18.5
27.8
15.5
20.7
10.7
17.1
15.9
13.0
9.5
24.2
17.2
9.5
19.6
PE (x)
10 Yr Avg
19.6
18.4
16.2
25.0
32.8
12.1
24.0
10.0
22.2
17.7
16.9
29.3
20.9
25.7
12.0
21.0
Prem/Disc (%)
-2
-21
0
-26
-15
28
-14
7
-23
-10
-23
-68
16
-33
-21
-7
Relative to Nifty P/E (%)
Current
10 Yr Avg
6
9
-20
2
-11
-10
2
39
53
83
-15
-33
14
33
-41
-45
-6
24
-13
-1
-29
-6
-48
63
33
16
-5
43
-48
-33
8
17
Current
2.7
2.1
3.2
2.9
5.0
1.2
4.1
1.4
2.2
3.6
1.6
1.1
3.7
2.4
0.6
4.0
PB (x)
10 Yr Avg
3.8
2.9
5.1
4.2
5.6
1.3
6.2
1.1
3.2
6.9
3.0
2.8
3.4
5.0
1.9
4.5
Prem/Disc (%)
-29
-28
-37
-32
-10
-5
-34
27
-31
-48
-47
-60
10
-52
-69
-11
Relative to Nifty P/B (%)
Current
10 Yr Avg
9
49
-17
12
28
99
14
64
99
115
-52
-51
61
140
-44
-57
-11
25
43
166
-37
15
-55
10
48
31
-5
92
-76
-25
58
73
BULLS & BEARS | September 2019
18
 Motilal Oswal Financial Services
Private Banks:
Moderation in loan growth, challenging economic environment builds uncertainty
Private banks are trading at a P/B of 2.7x, at a 13%
premium to the historical average of 2.4x.
Private banks are witnessing a slight moderation in loan
growth, reflecting weakness in the economic
environment, with systemic loan growth moderating to
~11.6 for the fortnight ended 16
th
Aug (v/s 14.2% in
Apr’19). Banks have guided for a moderation in loan
growth due to slowdown in the economy/consumption.
The RBI has urged banks to introduce external benchmark-
linked loan products to ensure faster monetary
transmission. This, in our view, will likely impact the
margins as deposits re-price with a lag.
Asset quality reflected mix trends across banks, with a few
banks reporting a steady performance and others like RBK
and AXSB reporting an increase in stressed assets due to
recent downgrades and new stress names. Thus, a few
banks guided for elevated credit cost over FY20. PCR has
improved as banks continue making healthy provisions to
further strengthen their balance sheets.
33
26
19
12
5
19.6
18.6
Private Banks P/E (x)
10 Yr Avg (x)
40
20
0
-20
-40
Private Banks Relative to Nifty PE (%)
2.0
7.9
Private Banks P/B (x)
4
3
2
1
2.4
10 Yr Avg (x)
30
10
Private Banks Relative to Nifty PB (%)
7.7
-7.5
2.7
-10
-30
-50
Sector Performance
MoM: -3%
PE (x)
Company
Axis Bank
DCB Bank
Federal Bank
HDFC Bank
ICICI Bank
IndusInd Bank
Kotak Mah. Bank
South Ind.Bank
Current
16.7
15.4
9.3
22.1
17.6
13.5
29.7
4.8
10 Yr Avg
29.7
16.0
12.2
20.8
18.9
18.4
23.4
8.5
Prem/Disc (%)
-44
-4
-24
6
-7
-27
27
-43
Relative to Nifty P/E (%)
Current
-8
-15
-49
22
-3
-26
63
-74
10 Yr Avg
65
-11
-32
16
5
2
30
-53
Current
2.1
1.8
1.1
3.4
2.2
2.4
3.9
0.4
PB (x)
10 Yr Avg
2.0
1.5
1.2
3.4
1.8
2.8
2.9
0.8
Prem/Disc (%)
4
24
-10
-1
23
-15
32
-58
Relative to Nifty P/B (%)
Current
-16
-28
-57
35
-14
-6
54
-86
10 Yr Avg
-21
-43
-53
33
-32
7
14
-67
BULLS & BEARS | September 2019
19
 Motilal Oswal Financial Services
PSU Banks:
Mega consolidation announced, but near-term challenges remain
PSU Banks are trading at a P/B of 0.8x, in line with the
historical average of 0.9x.
India’s finance minister announced a mega merger of six
public sector banks (PSBs) with four relatively better
performing anchor banks. The merger will reduce the
number of PSBs to 12 from 18 currently.
We see the consolidation of PSBs as a positive move from a
long-term perspective as it will help improve their
competitiveness. However, this will come with its own set
of challenges in the near term related to credit growth,
integration issues, etc. Merging two weak PSBs will be a
negative for minority shareholders.
We estimate earnings to improve for BOB and SBI from
FY20, led by declining credit cost, higher treasury gains and
recoveries from NCLT resolutions .
PSBs trade in line with the long-term average. However,
we do not believe that there is value call apart from SBI
and BOB which are in a relatively better position.
2
1
1
0
PSU Banks P/B (x)
10 Yr Avg (x)
-40
-50
PSU Banks Relative to Nifty PB (%)
0.9
0.8
-60
-70
-80
-64.3
-69.5
Sector Performance
MoM: -15%
PE (x)
Company
Bank of Baroda
Bank of India
Canara Bank
Indian Bank
Punjab Natl.Bank
St Bk of India
Union Bank (I)
Current
5.8
NA
7.4
6.8
NA
8.9
NA
10 Yr Avg
9.9
7.9
8.4
9.8
7.8
13.9
8.1
Prem/Disc (%)
-41
-
-12
-31
-
-36
-
Relative to Nifty P/E (%)
Current
-68
-59
-63
-51
10 Yr Avg
-45
-56
-53
-46
-57
-23
-55
Current
0.5
0.4
0.5
0.5
0.6
1.0
0.4
PB (x)
10 Yr Avg
1.0
0.8
0.7
0.7
1.0
1.2
0.8
Prem/Disc (%)
-47
-47
-35
-30
-37
-22
-45
Relative to Nifty P/B (%)
Current
-79
-84
-81
-80
-75
-62
-83
10 Yr Avg
-62
-70
-72
-72
-61
-53
-70
BULLS & BEARS | September 2019
20
 Motilal Oswal Financial Services
NBFCs:
Auto dealer inventory declining
NBFCs trade at a P/B of 3.3x, marginally above its
historical average.
According to our recent interactions with managements,
inventory at dealer levels has come down over the past
few months. This should result in an uptick in growth in
this segment. The festival season holds the key for
consumer durables and auto demand.
Wholesale financiers continue consolidating their
portfolios. Stable asset quality is the key focus now.
Retail home loan growth remains strong.
Liquidity position remains comfortable for NBFCs backed
by strong parentage. However, the quest for alternative
sources of funding remains for the rest, with ECBs and
retail NCDS being the most preferred routes.
Incremental cost of funds has declined over the past few
months.
NBFC P/E (x)
29
23
17
11
5
19.6
10 Yr Avg (x)
23.8
40
20
0
-20
-40
NBFC Relative to Nifty PE (%)
31.0
8.3
5
4
3
2
NBFC P/B (x)
10 Yr Avg (x)
45
30
3.3
NBFC Relative to Nifty PB (%)
31.4
17.2
3.0
15
0
-15
Sector Performance
MoM: 1%
Company
Bajaj Finance
Chola. Invst. & Fin.
HDFC
Indiabulls Housing
IndoStar Capital
L&T Fin.Holdings
LIC Housing Fin.
M & M Financial
Muthoot Finance
PNB Housing
Shri.City Union.
Shriram Trans.
Current
34.4
14.1
44.7
5.5
7.8
7.0
7.5
12.1
10.1
8.4
7.9
7.9
PE (x)
10 Yr Avg
13.8
14.2
35.5
9.5
13.0
15.5
11.3
17.1
8.2
17.8
13.9
12.5
Prem/Disc (%)
148
0
26
-42
-40
-55
-34
-29
24
-53
-43
-37
Relative to Nifty P/E (%)
Current
10 Yr Avg
89
-23
-22
-21
146
98
-70
-47
-57
-28
-62
-14
-59
-37
-33
-5
-44
-54
-54
-1
-57
-23
-56
-30
Current
7.3
2.6
4.2
1.0
0.7
1.1
1.1
1.6
2.1
1.2
1.1
1.2
PB (x)
10 Yr Avg
2.6
2.2
4.5
2.3
1.1
1.9
1.9
2.3
1.6
2.6
2.0
2.0
Prem/Disc (%)
176
19
-6
-55
-33
-41
-42
-29
31
-54
-44
-43
Relative to Nifty P/B (%)
Current
10 Yr Avg
188
2
4
-15
68
75
-59
-11
-71
-57
-56
-27
-56
-26
-36
-12
-16
-38
-52
2
-55
-22
-54
-22
BULLS & BEARS | September 2019
21
 Motilal Oswal Financial Services
Capital Goods:
Improvement in operating performance key to re-rating
Capital goods sector trades at a one-year forward P/E multiple
of 21.0x, at a discount of 22% to the 10-year average of 27.0x.
Even on the P/B basis, the sector trades at a discount of 19%
to its 10-year average multiple of 3.3x.
Valuation premium relative to the Nifty on a P/B basis has
been eroded; it now trades at an 8% premium v/s 10-year
average premium of 28%. On a P/E multiple basis, the
premium has narrowed to 16% from the 10-year average
premium of 48%.
Valuations for companies have been impacted given (a) the
overall slowdown in business activity and (b) pressure on the
operational performance due to the prevailing competitive
intensity and cost headwinds (rise in input cost).
67
47
27
7
27.0
21.0
Capital Goods P/E (x)
10 Yr Avg (x)
190
140
90
40
-10
15.6
47.9
Capital Goods Relative to Nifty PE (%)
7
5
3
1
Capital Goods P/B (x)
10 Yr Avg (x)
170
115
60
Capital Goods Relative to Nifty PB (%)
3.3
2.7
5
-50
28.0
7.6
Sector Performance
Company
ABB
BHEL
Blue Star
Cummins India
Engineers India
GE T&D India
Havells India
K E C Intl.
Larsen & Toubro
Siemens
Solar Inds.
Thermax
Voltas
Current
66.7
13.6
26.4
21.6
14.9
24.0
43.6
9.5
16.2
36.2
29.9
29.4
31.4
MoM: -3%
PE (x)
10 Yr Avg
79.0
24.3
29.2
26.5
19.7
66.1
27.4
15.6
23.0
49.0
23.0
31.3
23.4
Prem/Disc (%)
-16
-44
-9
-18
-24
-64
59
-39
-30
-26
30
-6
34
Relative to Nifty P/E (%)
Current
10 Yr Avg
267
340
-25
35
45
62
19
48
-18
9
32
268
140
52
-48
-13
-11
28
99
173
65
28
62
74
73
30
Current
6.0
0.6
6.0
3.5
2.7
2.5
8.3
1.9
2.5
4.5
6.3
3.3
4.4
PB (x)
10 Yr Avg
6.8
2.1
7.9
5.8
3.9
6.6
6.2
2.2
3.0
6.1
4.7
4.1
3.3
Prem/Disc (%)
-13
-74
-23
-39
-32
-63
35
-11
-16
-26
34
-20
32
Relative to Nifty P/B (%)
Current
10 Yr Avg
136
165
-78
-18
140
205
39
124
6
51
-3
158
230
139
-23
-15
1
17
79
136
149
81
31
61
76
30
BULLS & BEARS | September 2019
22
 Motilal Oswal Financial Services
Cement:
Demand remains soft, pricing pressure continues
Cement trades at an EV/EBITDA of 12.5x, at a 10%
discount to its historical average.
Cement demand remained soft across India. Various
parts of the country have been affected by severe
floods.
Cement prices have remained stable in the central
region, while north and west have witnessed a
marginal decline of INR5/bag. The decline in east was
~INR10/bag, while that in south was ~INR15/bag.
South-based dealers have indicated the possibility of
price hikes from September. However, given the onset
of the festive season, the sustainability of the hikes
would have to be tested.
RIL reduced pet coke prices by INR235/ton on 1
st
Aug’19 to INR8,142/t. Diesel prices decreased 1%
MoM. Prices of imported coal were down 1% MoM.
Sector Performance
PE (x)
Company
ACC
Ambuja Cem.
Birla Corpn.
Grasim Inds
Current
18.7
26.3
9.2
9.2
10 Yr Prem/Disc
Avg
(%)
26.1
29.1
15.6
11.0
25.2
17.6
29.0
27.5
-28
-10
-41
-17
-56
-32
34
4
43
33
23
13
3
Cement P/E (x)
10 Yr Avg (x)
150
105
60
Cement Relative to Nifty PE (%)
21.7
20.4
15
-30
-75
18.8
12.0
4
3
2
1
Cement P/B (x)
10 Yr Avg (x)
Cement Relative to Nifty PB (%)
30
10
-10
-1.0
-15.8
2.5
2.1
-30
-50
MoM: -6%
Relative to Nifty
P/E (%)
10 Yr
Current
Avg
3
44
-49
-50
-39
-34
113
57
45
62
-13
-39
40
-2
62
53
PB (x)
Current
2.4
1.8
0.8
1.1
0.4
0.6
5.6
2.8
10 Yr
Avg
2.9
2.6
1.1
1.7
0.7
0.9
4.5
3.1
Prem/Disc
(%)
-19
-30
-26
-38
-41
-28
25
-10
Relative to Nifty
P/B (%)
Current 10 Yr Avg
-7
-27
-67
-58
-83
-75
122
11
12
1
-57
-34
-73
-66
73
21
EV/EBIDTA (x)
Current 10 Yr Avg
8.6
15.5
5.7
14.2
5.7
7.6
15.5
12.7
13.6
16.0
7.7
21.5
8.1
9.1
13.5
13.2
Prem/
Disc (%)
-37
-3
-26
-34
-30
-17
15
-4
Cement EV/EBDITA (x)
22
17
12
7
2
10 Yr Avg (x)
13.9
12.5
India Cements 11.1
Sanghi Inds.
Shree Cement
UltraTech
12.0
38.8
28.5
BULLS & BEARS | September 2019
23
 Motilal Oswal Financial Services
Consumer:
Valuations not relenting
Consumer sector P/E of 39.8x in Aug’19 (up from 38.4x in
Jul’19) is at a premium of 18% to its 10-year average of
33.8x. On a P/B basis, the sector trades at 11.5x, a premium
of 12% to its 10-year average multiple of 10.2x.
From the demand standpoint, 1QFY20 was a soft quarter
for consumer companies across categories . The situation is
expected to remain so for the following quarter as well. In
1QFY20 commentaries, companies were hopeful of a
recovery post 2QFY20 in anticipation of normal monsoon
and improving consumer sentiment.
Commodity costs are largely benign. While this is good for
margins, it is affecting realization growth. If volume growth
slowdown persists, promotional intensity could increase,
leading to weak sales growth.
55
45
35
25
15
33.8
Consumer P/E (x)
10 Yr Avg (x)
150
39.8
110
70
30
-10
88.4
Consumer Relative to Nifty PE (%)
118.7
15
13
10
8
5
Consumer P/B (x)
10 Yr Avg (x)
480
380
Consumer Relative to Nifty PB (%)
357.6
300.7
11.5
10.2
280
180
80
Sector Performance
Company
Asian Paints
Britannia Inds.
Colgate-Palm.
Dabur India
Emami
GlaxoSmith C H L
Godrej Consumer
Hind. Unilever
ITC
Jyothy Lab.
Marico
Nestle India
P & G Hygiene
Page Industries
Pidilite Inds.
United Breweries
United Spirits
Current
59.4
48.4
40.5
46.7
21.2
31.1
35.8
52.8
22.0
21.7
41.6
62.1
58.9
46.2
57.8
63.2
44.7
MoM: 0%
PE (x)
10 Yr Avg
39.1
33.9
35.7
33.2
31.1
29.6
34.7
37.7
26.5
35.8
33.9
44.0
46.0
41.9
33.1
69.9
94.8
Prem/Disc (%)
52
43
13
41
-32
5
3
40
-17
-39
23
41
28
10
75
-10
-53
Relative to Nifty P/E (%)
Current
10 Yr Avg
227
118
166
89
123
99
157
85
16
73
71
65
97
93
190
110
21
48
19
99
129
88
242
145
224
156
154
133
218
84
248
289
146
427
Current
14.4
14.4
25.9
12.2
5.7
7.0
8.0
50.8
4.7
3.7
12.8
62.7
25.5
22.6
13.2
9.4
10.8
PB (x)
10 Yr Avg
11.0
12.2
24.6
10.1
10.3
7.8
7.5
31.8
7.1
4.4
10.4
25.4
17.3
19.7
8.3
9.1
11.8
Prem/Disc (%)
31
18
5
20
-45
-10
6
60
-34
-18
24
146
47
15
60
3
-9
Relative to Nifty P/B (%)
Current
10 Yr Avg
472
326
472
373
929
855
383
292
125
298
180
203
216
190
1917
1133
86
175
45
72
410
302
2390
885
912
571
798
662
425
220
273
253
327
357
BULLS & BEARS | September 2019
24
 Motilal Oswal Financial Services
Healthcare:
Discount to its 10Y/3Y P/E multiple steady for three months now
The discount of healthcare P/E multiple to its 10-year/3-year
average has been steady for three months now at 20%/30%.
The discount relative to the Nifty has also reduced slightly.
The movement in the healthcare index for August was largely
dominated by 1QFY20 results of pharma companies, which
indicated healthy revenue growth in the domestic formulation
and API businesses.
The opportunistic US sales provided support to YoY growth in
earnings at the aggregate level. Even price erosion has been
receding for most companies focusing on US generics.
The outcomes of recent USFDA inspections provide limited
scope to lower the regulatory risk on US generics business.
Four out of 19 stocks are trading at a premium to their 10-year
average due to their lower exposure to US generics (Ajanta,
Sanofi, Torrent) and differentiated CRAMS model (Divis).
Sustained recovery in growth of the domestic formulation
market, the reduction in compliance and price erosion risk, and
better traction from new launches in US generics remain key for
a further reduction in the discount of healthcare multiple to its
10-year/3-year average.
36
30
24
18
12
24.2
Healthcare P/E (x)
10 Yr Avg (x)
90
60
30
19.7
0
-30
Healthcare Relative to Nifty PE (%)
34.0
8.4
Healthcare P/B (x)
7
5
4
2
4.1
10 Yr Avg (x)
140
100
60
20
2.6
Healthcare Relative to Nifty PB (%)
58.2
2.6
-20
Sector Performance
Company
Aurobindo Pharma
Ajanta Pharma
Biocon
Cadila Health.
Cipla
Divi's Lab.
Dr Reddy's Labs
Glaxosmit Pharma
Glenmark Pharma.
Granules India
Ipca Labs.
Jubilant Life
Laurus Labs
Lupin
Sanofi India
Sun Pharma.Inds.
Strides Shasun
Shilpa Medicare
Torrent Pharma.
Current
11.0
19.8
25.6
13.1
20.5
26.7
20.5
41.2
14.6
7.7
20.7
7.2
19.6
21.6
32.7
22.2
13.0
11.7
28.6
MoM: 1%
PE (x)
10 Yr Avg
14.1
16.3
25.7
21.7
28.3
21.9
25.4
49.3
24.0
11.0
25.2
13.4
35.5
25.8
29.6
29.5
61.9
25.3
20.8
Prem/Disc (%)
-22
21
0
-40
-27
22
-19
-16
-39
-30
-18
-47
-45
-16
10
-25
-79
-54
38
Relative to Nifty P/E (%)
Current
10 Yr Avg
-40
-22
9
-9
41
43
-28
21
13
57
47
22
13
42
127
174
-20
33
-58
-39
14
40
-61
-25
8
98
19
44
80
65
22
64
-29
245
-36
41
57
15
Current
1.9
3.2
3.9
1.9
2.2
5.1
2.4
9.0
1.7
1.3
3.2
1.1
1.9
2.2
5.6
2.3
1.2
1.3
5.1
PB (x)
10 Yr Avg
2.9
4.3
3.2
4.9
3.4
4.8
3.9
10.5
4.1
1.7
3.2
1.7
3.1
4.5
4.7
4.6
3.2
2.8
4.5
Prem/Disc (%)
-32
-25
23
-61
-36
6
-38
-15
-59
-24
0
-31
-37
-51
18
-50
-64
-56
13
Relative to Nifty P/B (%)
Current
10 Yr Avg
-23
12
29
68
56
23
-25
90
-14
31
101
84
-4
51
257
308
-33
59
-49
-35
26
23
-55
-36
-23
20
-12
76
122
84
-8
80
-53
26
-50
10
104
76
BULLS & BEARS | September 2019
25
 Motilal Oswal Financial Services
Infrastructure:
All eyes on government actions to bring infra back on track
Infrastructure sector trades at a P/B of 0.8x, at a 54.5%
discount to its historical average.
Post weak ordering activity in FY19 (-67% YoY), business
momentum is now likely to pick up massively given the
re-election of a stable government at the center. The
government has drawn out massive infrastructure
development plans with expected investment to the
tune of INR100t by 2024.
Pipeline of projects in the road infrastructure segment
remains strong, and players expect momentum to pick
up from 2HFY20.
If plans get implemented in a timely manner, we expect
strong business opportunity for all players in the sector.
This, in turn, will lead to an improvement in operational
performance, and thus, re-rating of the sector.
IRB Infra, Ashoka and Sadbhav trade at a discount to
the historical P/B, while KNR trades at a premium.
32
24
16
8
0
7.8
Infrastructure P/E (x)
10 Yr Avg (x)
60
20
-20
-60
-100
-30.9
-56.9
Infrastructure Relative to Nifty PE (%)
12.4
Infrastructure P/B (x)
4
2
1
0
1.7
10 Yr Avg (x)
0
-25
-50
Infrastructure Relative to Nifty PB (%)
-34.0
0.8
-75
-100
-68.9
PE (x)
Company
Ashoka Buildcon
IRB Infra.Devl.
KNR Construct.
Sadbhav Engg.
Current
8.4
4.3
12.5
12.6
10 Yr Avg
13.6
11.2
8.4
25.0
Prem/Disc (%)
-
-61
49
-50
Relative to Nifty P/E (%)
Current
-
-76
-31
-31
10 Yr Avg
-24
-38
-53
39
Current
1.1
0.4
1.7
1.0
PB (x)
10 Yr Avg
1.6
1.7
1.4
2.6
Prem/Disc (%)
-35
-78
20
-61
Relative to Nifty P/B (%)
Current
-58
-85
-32
-59
10 Yr Avg
-37
-35
-45
2
BULLS & BEARS | September 2019
26
 Motilal Oswal Financial Services
Media:
Advertisement revenue to remain muted
Media sector P/E of 15.9x is at ~31% discount to its
10-year historical average of 22.8x.
Advertisement revenue will be lower due to weak
spends by advertisers amidst slowing consumption
and the lack of reach post NTO’s slow execution.
Print companies continue witnessing lower
newsprint prices, which will likely help reduce opex.
However, radio and ad revenues are expected to be
lower owing to the slowdown in ad spends.
Media P/E (x)
43
31
19
7
15.9
-50
10 Yr Avg (x)
100
50
0
Media Relative to Nifty PE (%)
22.8
27.5
-12.8
Media P/B (x)
6
5
4
2
1
4.3
10 Yr Avg (x)
130
90
50
Media Relative to Nifty PB (%)
66.3
2.7
10
-30
5.8
Company
Ent.Network
Jagran Prakashan
PVR
Sun TV Network
Zee Entertainmen
Current
23.9
6.1
58.7
11.0
18.5
PE (x)
10 Yr Avg
39.8
15.4
40.7
20.0
26.6
Prem/Disc (%)
-40
-61
44
-45
-30
Relative to Nifty P/E (%)
Current
10 Yr Avg
32
122
-67
-14
223
126
-40
11
2
48
Current
1.7
0.9
4.6
2.5
3.2
PB (x)
10 Yr Avg
3.0
3.2
3.5
5.0
5.5
Prem/Disc (%)
-44
-72
30
-49
-42
Relative to Nifty P/B (%)
Current
10 Yr Avg
-32
18
-65
24
83
37
1
93
28
114
BULLS & BEARS | September 2019
27
 Motilal Oswal Financial Services
Metals:
Steel prices continue declining
Metals trade at 0.8x, below its historical average P/B
of 1.3x. EV/EBITDA is at 5.9x, at a 21% discount to
the historical average.
Avg. domestic flat steel and long steel product prices
trended lower during the month to ~INR37,400 and
~INR30,400, respectively.
Zinc and lead prices were higher for the month.
We remain positive on JSW Steel given its strong
growth outlook. Hindalco is well placed to benefit
from low-cost captive raw materials.
25
20
15
10
5
12.4
9.3
Metals P/E (x)
10 Yr Avg (x)
15
-5
-25
-45
-65
Metals Relative to Nifty PE (%)
-31.0
-48.9
4
3
2
1
0
Metals P/B (x)
10 Yr Avg (x)
20
-5
Metals Relative to Nifty PB (%)
1.3
0.8
-30
-55
-80
-49.5
-66.4
Sector Performance
MoM: -12%
PE (x)
Company
Hind.Zinc
Hindalco Inds.
Jindal Steel
JSW Steel
NALCO
NMDC
SAIL
Tata Steel
Vedanta
Current
11.2
8.9
NA
9.3
11.3
6.1
NA
6.4
9.8
10 Yr
Avg
10.1
9.8
17.1
13.3
15.9
11.4
15.6
16.2
11.0
-61
-11
-65
-46
-30
-29
-47
-49
-38
-66
Prem/Disc
(%)
11
-9
Relative to Nifty P/E
(%)
Current
-39
-51
10 Yr
Avg
-44
-45
-5
-26
-11
-36
-13
-10
-39
PB (x)
10 Yr
Current Avg
2.3
0.9
0.3
1.3
0.7
0.9
0.3
0.6
0.8
2.2
1.3
1.5
1.4
1.2
2.6
0.9
1.6
2.1
Prem/Disc
(%)
1
-31
-80
-7
-40
-65
-67
-64
-62
Relative to Nifty
P/B (%)
Current 10 Yr Avg
-10
-64
-88
-49
-71
-65
-88
-77
-69
-13
-49
-41
-47
-52
0
-63
-38
-20
EV/EBIDTA (x)
Prem/Dis
Current 10 Yr Avg c (%)
6.2
5.9
5.6
6.6
4.1
3.5
9.1
5.5
5
6.0
7.3
10.7
7.6
7.7
7.4
14.4
7.5
5
3
-19
-48
-14
-48
-52
-36
-27
4
Metals EV/EBDITA (x)
10
8
5
3
10 Yr Avg (x)
7.4
5.9
BULLS & BEARS | September 2019
28
 Motilal Oswal Financial Services
Oil & Gas:
Oil prices remain under pressure
Oil & Gas trades at a P/B of 1.3x (13% discount) and a P/E of
10.6x (6% discount to historical average).
Trade war between US and China escalated, drowning Brent
prices under USD60/bbl from ~USD65/bbl at the start of the
month.
Refining margins weakened averaging USD4.4/bbl v/s
USD6.8/bbl MoM. Oil marketing companies saw
normalization of marketing margins.
Weakness in petchem margin continues.
During the month, RIL hosted AGM with a couple of big
announcements, helping the stock to gain some
momentum.
CGDs performed well in the quarter with highest-ever
EBITDA margins. However, pressure of regulatory risk
remains.
18
15
12
9
6
11.3
10.6
Oil & Gas P/E (x)
10 Yr Avg (x)
-12
-27
-42
-57
-72
Oil & Gas Relative to Nifty PE (%)
-35.2
-41.6
3
2
2
1
Oil & Gas P/B (x)
10 Yr Avg (x)
0
-25
-50
-75
Oil & Gas Relative to Nifty PB (%)
1.5
1.3
-41.2
-47.5
Sector Performance
MoM: -1%
Company
Aegis Logistics
BPCL
GAIL (India)
Guj.St.Petronet
HPCL
IOCL
Indraprastha Gas
MRPL
ONGC
Petronet LNG
Reliance Inds.
Current
17.7
8.4
9.1
14.2
6.3
7.5
24.6
7.9
4.6
15.3
15.9
PE (x)
10 Yr Avg
21.4
9.9
14.0
11.9
17.4
9.2
15.8
15.6
10.1
12.8
12.3
Prem/Disc (%)
-17
-16
-35
20
-64
-18
56
-49
-54
20
29
1
Relative to Nifty P/E (%)
Current
10 Yr Avg
-3
19
-54
-45
-50
-22
-22
-34
-65
-3
-59
-49
36
-12
-56
-13
-75
-44
-16
-29
-13
-31
Current
3.7
1.6
1.2
1.8
1.1
0.9
4.6
0.7
0.6
3.6
1.7
PB (x)
10 Yr Avg
3.3
1.7
1.8
1.8
1.2
1.1
3.3
1.6
1.4
2.6
1.4
Prem/Disc (%)
12
-6
-36
3
-6
-20
41
-57
-56
37
17
Relative to Nifty P/B (%)
Current
10 Yr Avg
46
27
-38
-36
-54
-29
-28
-32
-55
-54
-64
-56
83
27
-73
-38
-75
-45
43
1
-34
-45
BULLS & BEARS | September 2019
29
 Motilal Oswal Financial Services
Retail:
Festival season to provide a further boost
Retail sector is trading at a P/E of 53.4x, which is ~19%
premium to its 10-year historical average.
92
Retail P/E (x)
10 Yr Avg (x)
590
53.4
44.9
430
270
110
-50
154.5
193.7
Retail Relative to Nifty PE (%)
Upcoming festive season is likely to drive higher footfall
70
and revenue for apparel and grocery retailers. However,
48
the performance may remain mixed across sectors,
26
given intensifying competition and pressure from the
discounting trend.
4
Valuations remain rich, despite correction in the stock
prices.
14
10
Retail P/B (x)
10 Yr Avg (x)
450
9.8
Retail Relative to Nifty PB (%)
287.8
132.0
300
150
0
-150
6.0
6
2
PE (x)
Company
Aditya Birla Fashion
Avenue Supermarts
Future Lifestyle
Future Retail
Jubilant
Shoppers Stop
Titan
Trent
V-Mart Retail
Current
51.4
73.9
36.5
24.6
41.8
28.5
52.9
99.0
51.3
10 Yr Avg
139.0
79.5
44.6
29.5
62.8
46.7
36.8
89.9
32.0
Prem/Disc (%)
-63
-7
-18
-16
-33
-39
44
10
60
Relative to Nifty P/E (%)
Current
182
307
101
35
130
57
191
444
182
10 Yr Avg
673
342
148
64
249
160
105
400
78
Current
8.1
13.2
3.9
4.0
12.9
3.1
14.8
5.6
7.2
PB (x)
10 Yr Avg
9.9
13.4
2.4
5.4
12.5
5.2
9.9
3.7
5.1
Prem/Disc (%)
-19
-1
63
-26
3
-41
50
50
41
Relative to Nifty P/B (%)
Current
220
426
56
58
411
23
488
121
184
10 Yr Avg
284
419
-7
110
385
102
282
43
96
BULLS & BEARS | September 2019
30
 Motilal Oswal Financial Services
Technology:
Expect reversal in margin trajectory, revenue growth may tapper off
Technology sector trades at a P/E of 20.0x, at a 19%
premium to its historical average of 16.8x.
Macro noises are creating some delays in decision
making. Almost all companies highlighted that the macro
uncertainty is causing weak spending in the BFSI space.
Most mid-caps reported pockets of weakness, which
were either client-specific or vertical-related. This led to
weak sequential growth across the pack.
With a reversal in the USD/INR trend, there may be some
cushion to margins. Further, there has been sporadic
hiring in 1QFY20, which could mean an attempt on
rationalizing the pyramid structure, giving charge to the
declining margin trend.
Dip in mid-caps is now represented in valuations with
valuation gap between large-caps and midcaps now at 24%
v/s mid-caps trading at a premium of 6% a year ago.
We remain positive on INFO and TECHM in Tier I. In mid-
caps, we remain positive on ZENT, MPHL, CYL, and PSYS.
23
19
15
11
7
16.8
Technology P/E (x)
10 Yr Avg (x)
20.0
40
20
0
-20
-40
Technology Relative to Nifty PE (%)
10.1
-5.1
6
5
4
3
2
Technology P/B (x)
4.3
10 Yr Avg (x)
5.5
150
100
50
0
Technology Relative to Nifty PB (%)
118.3
68.6
Sector Performance
MoM: 3%
PE (x)
Company
Cyient
HCL Technologies
Hexaware Tech.
Infosys
MphasiS
NIIT Tech.
TCS
Tech Mahindra
Wipro
Zensar Tech.
Current
9.0
13.9
17.2
20.3
14.5
18.4
24.2
13.8
14.8
12.8
10 Yr Avg
12.2
13.5
13.8
17.5
12.8
10.4
19.0
12.9
15.2
9.9
Prem/Disc (%)
-26
3
25
16
13
77
27
6
-3
29
Relative to Nifty P/E (%)
Current
-50
-24
-5
11
-20
1
33
-24
-19
-30
10 Yr Avg
-32
-25
-23
-3
-29
-42
6
-28
-15
-45
Current
1.6
3.0
4.0
5.5
2.9
3.7
9.3
2.6
2.9
2.1
PB (x)
10 Yr Avg
2.1
3.2
3.3
4.1
2.3
1.8
6.4
2.7
2.9
1.9
Prem/Disc (%)
-24
-5
22
34
28
108
45
-2
-2
11
Relative to Nifty P/B (%)
Current
-37
21
58
119
16
47
268
5
14
-16
10 Yr Avg
-19
24
27
59
-11
-31
148
5
13
-26
BULLS & BEARS | September 2019
31
 Motilal Oswal Financial Services
Telecom:
Earnings revival holding valuations of telecom players
The telecom sector is trading at an EV/EBITDA of
7.6x, ~7% discount to its 10-year historical average.
ARPU for incumbents is trending up on the back of
the minimum recharge plans and the consolidation
in subscriber base. This might drive growth in
earnings for telcos.
RJio’s broadband commercial launch at attractive
prices may be a trigger point impacting incumbents
in the broadband space.
15
13
10
8
5
8.1
7.6
4
3
2
1
Telecom P/B (x)
2.1
10 Yr Avg (x)
Telecom Relative to Nifty PB (%)
70
35
0
1.3
-16.6
-46.9
-35
-70
Telecom EV/EBDITA (x)
10 Yr Avg (x)
Company
Bharti Airtel
Idea Cellular
Tata Comm
Current
NA
NA
33.8
PE (x)
10 Yr Avg
32.8
16.1
28.8
Prem/Disc (%)
NA
-
17
Relative to Nifty P/E (%)
Current
10 Yr Avg
NA
82
-
-11
86
61
Current
2.0
0.2
46.4
PB (x)
10 Yr Avg
2.1
1.1
11.6
Prem/Disc (%)
-8
-78
299
Relative to Nifty P/B (%)
Current
10 Yr Avg
-22
-18
-90
-57
1741
350
BULLS & BEARS | September 2019
32
 Motilal Oswal Financial Services
Utilities:
Electricity generation increases 4.4% YoY in Jul’19
Utilities trade at a P/B of 1.4x, at a 32% discount to
historical average.
Barring CESC, all stocks under our coverage universe
are trading at a discount to historical average P/B.
Short-term power prices were slightly higher MoM
at INR3.38/kWh in Jul’19.
Conventional electricity generation increased 5.7%
YoY in Jul’19. Including RE, generation has grown
4.4% YoY in Jul’19.
3
2
2
1
1
1.4
19
16
13
10
7
12.9
8.2
Utilities P/E (x)
10 Yr Avg (x)
10
-15
-40
-65
-26.3
-54.7
Utilities Relative to Nifty PE (%)
Utilities P/B (x)
2.0
10 Yr Avg (x)
35
10
-15
-40
-65
Utilities Relative to Nifty PB (%)
-21.8
-45.9
Sector Performance
MoM: -4%
PE (x)
Company
CESC
Coal India
JSW Energy
NHPC
NTPC
Power Grid Corpn
Torrent Power
Tata Power
Current
8.2
6.6
13.0
7.8
8.5
9.4
11.4
12.9
10 Yr Avg
12.3
13.7
16.1
11.3
13.9
12.4
16.6
25.1
Prem/Disc (%)
-33
-52
-19
-31
-39
-25
-32
-48
Relative to Nifty P/E (%)
Current
-55
-64
-29
-57
-53
-49
-38
-29
10 Yr Avg
-32
-24
-10
-37
-23
-31
-7
40
Current
1.0
4.0
0.9
0.7
1.0
1.5
1.3
0.9
PB (x)
10 Yr Avg
0.9
6.1
1.5
0.9
1.5
1.8
1.5
1.9
Prem/Disc (%)
15
-35
-42
-23
-36
-15
-14
-55
Relative to Nifty P/B (%)
Current
-60
57
-65
-72
-61
-39
-48
-66
10 Yr Avg
-66
138
-41
-64
-40
-30
-41
-27
BULLS & BEARS | September 2019
33
 Motilal Oswal Financial Services
NOTES
 Motilal Oswal Financial Services
Motilal Oswal Securities Limited
MEMBER OF BSE AND NSE
Motilal Oswal Tower, Sayani Road, Prabhadevi, Mumbai 400 025, INDIA
BOARD: +91 22 3982 5500 | WEBSITE:
www.motilaloswal.com
Explanation of Investment Rating
Investment Rating
BUY
SELL
NEUTRAL
UNDER REVIEW
NOT RATED
Expected return (over 12-month)
>=15%
< - 10%
> - 10 % to 15%
Rating may undergo a change
We have forward looking estimates for the stock but we refrain from assigning recommendation
*In case the recommendation given by the Research Analyst is inconsistent with the investment rating legend for a continuous period of 30 days,the Research Analyst shall within following 30 days take appropriate measures to make the
recommendation consistent with the investment rating legend.
Disclosures:
The following Disclosures are being made in compliance with the SEBI Research Analyst Regulations 2014 (herein after referred to as the Regulations).
Motilal Oswal Financial Services Ltd. (MOFSL) is a SEBI Registered Research Analyst having registration no. INH000000412. MOFSL, the Research Entity (RE) as defined in the Regulations, is engaged in the business of providing Stock broking
services, Investment Advisory Services, Depository participant services & distribution of various financial products. MOFSL is a subsidiary company of Passionate Investment Management Pvt. Ltd.. (PIMPL). MOFSL is a listed public company, the
details in respect of which are available on
www.motilaloswal.com.
MOFSL (erstwhile Motilal Oswal Securities Limited - MOSL) is registered with the Securities & Exchange Board of India (SEBI) and is a registered Trading Member with National Stock
Exchange of India Ltd. (NSE) and Bombay Stock Exchange Limited (BSE), Multi Commodity Exchange of India Limited (MCX) and National Commodity & Derivatives Exchange Limited (NCDEX) for its stock broking activities & is Depository participant
with Central Depository Services Limited (CDSL) National Securities Depository Limited (NSDL),NERL, COMRIS and CCRL and is member of Association of Mutual Funds of India (AMFI) for distribution of financial products and Insurance Regulatory &
Development Authority of India (IRDA) as Corporate Agent for insurance products. Details of associate entities of Motilal Oswal Financial Services Limited are available on the website at
http://onlinereports.motilaloswal.com/Dormant/documents/Associate%20Details.pdf
Details of pending Enquiry Proceedings of Motilal Oswal Financial Services Limited are available on the website at
https://galaxy.motilaloswal.com/ResearchAnalyst/PublishViewLitigation.aspx
MOFSL, it’s associates, Research Analyst or their relative may have any financial interest in the subject company. MOFSL and/or its associates and/or Research Analyst may have actual/beneficial ownership of 1% or more securities in the past 12
months. MOFSL and its associate company(ies), their directors and Research Analyst and their relatives may; (a) from time to time, have a long or short position in, act as principal in, and buy or sell the securities or derivatives thereof of companies
mentioned herein. (b) be engaged in any other transaction involving such securities and earn brokerage or other compensation or act as a market maker in the financial instruments of the company(ies) discussed herein or act as an advisor or
lender/borrower to such company(ies) or may have any other potential conflict of interests with respect to any recommendation and other related information and opinions.; however the same shall have no bearing whatsoever on the specific
recommendations made by the analyst(s), as the recommendations made by the analyst(s) are completely independent of the views of the associates of MOFSL even though there might exist an inherent conflict of interest in some of the stocks
mentioned in the research report. Research Analyst may have served as director/officer, etc. in the subject company in the past 12 months. MOFSL and/or its associates may have received any compensation from the subject company in the past 12
months.
In the past 12 months, MOFSL or any of its associates may have:
a) managed or co-managed public offering of securities from subject company of this research report,
b) received compensation for investment banking or merchant banking or brokerage services from subject company of this research report,
c) received compensation for products or services other than investment banking or merchant banking or brokerage services from the subject company of this research report.
d) Subject Company may have been a client of MOFSL or its associates in the past 12 months.
MOFSL and it’s associates have not received any compensation or other benefits from the subject company or third party in connection with the research report. To enhance transparency, MOFSL has incorporated a Disclosure of Interest Statement in
this document. This should, however, not be treated as endorsement of the views expressed in the report. MOFSL and / or its affiliates do and seek to do business including investment banking with companies covered in its research reports. As a
result, the recipients of this report should be aware that MOFSL may have a potential conflict of interest that may affect the objectivity of this report. Compensation of Research Analysts is not based on any specific merchant banking, investment
banking or brokerage service transactions. Above disclosures include beneficial holdings lying in demat account of MOFSL which are opened for proprietary investments only. While calculating beneficial holdings, It does not consider demat accounts
which are opened in name of MOFSL for other purposes (i.e holding client securities, collaterals, error trades etc.). MOFSL also earns DP income from clients which are not considered in above disclosures.
 Motilal Oswal Financial Services
Terms & Conditions:
This report has been prepared by MOFSL and is meant for sole use by the recipient and not for circulation. The report and information contained herein is strictly confidential and may not be altered in any way, transmitted to, copied or distributed, in part or
in whole, to any other person or to the media or reproduced in any form, without prior written consent of MOFSL. The report is based on the facts, figures and information that are considered true, correct, reliable and accurate. The intent of this report is not
recommendatory in nature. The information is obtained from publicly available media or other sources believed to be reliable. Such information has not been independently verified and no guaranty, representation of warranty, express or implied, is made as
to its accuracy, completeness or correctness. All such information and opinions are subject to change without notice. The report is prepared solely for informational purpose and does not constitute an offer document or solicitation of offer to buy or sell or
subscribe for securities or other financial instruments for the clients. Though disseminated to all the customers simultaneously, not all customers may receive this report at the same time. MOFSL will not treat recipients as customers by virtue of their
receiving this report.
Analyst Certification
The views expressed in this research report accurately reflect the personal views of the analyst(s) about the subject securities or issues, and no part of the compensation of the research analyst(s) was, is, or will be directly or indirectly related to the specific
recommendations and views expressed by research analyst(s) in this report.
Disclosure of Interest Statement
Companies where there is interest
Analyst ownership of the stock
No
A graph of daily closing prices of securities is available at
www.nseindia.com, www.bseindia.com.
Research Analyst views on Subject Company may vary based on Fundamental research and Technical Research. Proprietary trading desk of MOFSL or its
associates maintains arm’s length distance with Research Team as all the activities are segregated from MOFSL research activity and therefore it can have an independent view with regards to subject company for which Research Team have expressed
their views.
Regional Disclosures (outside India)
This report is not directed or intended for distribution to or use by any person or entity resident in a state, country or any jurisdiction, where such distribution, publication, availability or use would be contrary to law, regulation or which would subject MOFSL
& its group companies to registration or licensing requirements within such jurisdictions.
For Hong Kong:
This report is distributed in Hong Kong by Motilal Oswal capital Markets (Hong Kong) Private Limited, a licensed corporation (CE AYY-301) licensed and regulated by the Hong Kong Securities and Futures Commission (SFC) pursuant to the Securities and
Futures Ordinance (Chapter 571 of the Laws of Hong Kong) “SFO”. As per SEBI (Research Analyst Regulations) 2014 Motilal Oswal Financial Services Limited(SEBI Reg No. INH000000412) has an agreement with Motilal Oswal capital Markets (Hong
Kong) Private Limited for distribution of research report in Hong Kong. This report is intended for distribution only to “Professional Investors” as defined in Part I of Schedule 1 to SFO. Any investment or investment activity to which this document relates is
only available to professional investor and will be engaged only with professional investors.” Nothing here is an offer or solicitation of these securities, products and services in any jurisdiction where their offer or sale is not qualified or exempt from
registration. The Indian Analyst(s) who compile this report is/are not located in Hong Kong & are not conducting Research Analysis in Hong Kong.
For U.S:
Motilal Oswal Financial Services Limited (MOFSL) is not a registered broker - dealer under the U.S. Securities Exchange Act of 1934, as amended (the"1934 act") and under applicable state laws in the United States. In addition MOFSL is not a registered
investment adviser under the U.S. Investment Advisers Act of 1940, as amended (the "Advisers Act" and together with the 1934 Act, the "Acts), and under applicable state laws in the United States. Accordingly, in the absence of specific exemption under
the Acts, any brokerage and investment services provided by MOFSL, including the products and services described herein are not available to or intended for U.S. persons. This report is intended for distribution only to "Major Institutional Investors" as
defined by Rule 15a-6(b)(4) of the Exchange Act and interpretations thereof by SEC (henceforth referred to as "major institutional investors"). This document must not be acted on or relied on by persons who are not major institutional investors. Any
investment or investment activity to which this document relates is only available to major institutional investors and will be engaged in only with major institutional investors. In reliance on the exemption from registration provided by Rule 15a-6 of the U.S.
Securities Exchange Act of 1934, as amended (the "Exchange Act") and interpretations thereof by the U.S. Securities and Exchange Commission ("SEC") in order to conduct business with Institutional Investors based in the U.S., MOFSL has entered into
a chaperoning agreement with a U.S. registered broker-dealer, Motilal Oswal Securities International Private Limited. ("MOSIPL"). Any business interaction pursuant to this report will have to be executed within the provisions of this chaperoning agreement.
The Research Analysts contributing to the report may not be registered /qualified as research analyst with FINRA. Such research analyst may not be associated persons of the U.S. registered broker-dealer, MOSIPL, and therefore, may not be subject to
NASD rule 2711 and NYSE Rule 472 restrictions on communication with a subject company, public appearances and trading securities held by a research analyst account.
 Motilal Oswal Financial Services
For Singapore
In Singapore, this report is being distributed by Motilal Oswal Capital Markets Singapore Pte Ltd (“MOCMSPL”) (Co.Reg. NO. 201129401Z) which is a holder of a capital markets services license and an exempt financial adviser in Singapore,
as per the approved agreement under Paragraph 9 of Third Schedule of Securities and Futures Act (CAP 289) and Paragraph 11 of First Schedule of Financial Advisors Act (CAP 110) provided to MOCMSPL by Monetary Authority of Singapore. Persons
in Singapore should contact MOCMSPL in respect of any matter arising from, or in connection with this report/publication/communication. This report is distributed solely to persons who qualify as “Institutional Investors”, of which some of whom may
consist of "accredited" institutional investors as defined in section 4A(1) of the Securities and Futures Act, Chapter 289 of Singapore (“the SFA”). Accordingly, if a Singapore person is not or ceases to be such an institutional investor, such Singapore
Person must immediately discontinue any use of this Report and inform MOCMSPL.
Disclaimer: The report and information contained herein is strictly confidential and meant solely for the selected recipient and may not be altered in any way, transmitted to, copied or distributed, in part or in whole, to any other person or to the media or
reproduced in any form, without prior written consent. This report and information herein is solely for informational purpose and may not be used or considered as an offer document or solicitation of offer to buy or sell or subscribe for securities or other
financial instruments. Nothing in this report constitutes investment, legal, accounting and tax advice or a representation that any investment or strategy is suitable or appropriate to your specific circumstances. The securities discussed and opinions
expressed in this report may not be suitable for all investors, who must make their own investment decisions, based on their own investment objectives, financial positions and needs of specific recipient. This may not be taken in substitution for the
exercise of independent judgment by any recipient. Each recipient of this document should make such investigations as it deems necessary to arrive at an independent evaluation of an investment in the securities of companies referred to in this document
(including the merits and risks involved), and should consult its own advisors to determine the merits and risks of such an investment. The investment discussed or views expressed may not be suitable for all investors. Certain transactions -including those
involving futures, options, another derivative products as well as non-investment grade securities - involve substantial risk and are not suitable for all investors. No representation or warranty, express or implied, is made as to the accuracy, completeness
or fairness of the information and opinions contained in this document. The Disclosures of Interest Statement incorporated in this document is provided solely to enhance the transparency and should not be treated as endorsement of the views expressed
in the report. This information is subject to change without any prior notice. The Company reserves the right to make modifications and alternations to this statement as may be required from time to time without any prior approval. MOFSL, its associates,
their directors and the employees may from time to time, effect or have effected an own account transaction in, or deal as principal or agent in or for the securities mentioned in this document. They may perform or seek to perform investment banking or
other services for, or solicit investment banking or other business from, any company referred to in this report. Each of these entities functions as a separate, distinct and independent of each other. The recipient should take this into account before
interpreting the document. This report has been prepared on the basis of information that is already available in publicly accessible media or developed through analysis of MOFSL. The views expressed are those of the analyst, and the Company may or
may not subscribe to all the views expressed therein. This document is being supplied to you solely for your information and may not be reproduced, redistributed or passed on, directly or indirectly, to any other person or published, copied, in whole or in
part, for any purpose. This report is not directed or intended for distribution to, or use by, any person or entity who is a citizen or resident of or located in any locality, state, country or other jurisdiction, where such distribution, publication, availability or use
would be contrary to law, regulation or which would subject MOFSL to any registration or licensing requirement within such jurisdiction. The securities described herein may or may not be eligible for sale in all jurisdictions or to certain category of
investors. Persons in whose possession this document may come are required to inform themselves of and to observe such restriction. Neither the Firm, not its directors, employees, agents or representatives shall be liable for any damages whether direct
or indirect, incidental, special or consequential including lost revenue or lost profits that may arise from or in connection with the use of the information. The person accessing this information specifically agrees to exempt MOFSL or any of its affiliates or
employees from, any and all responsibility/liability arising from such misuse and agrees not to hold MOFSL or any of its affiliates or employees responsible for any such misuse and further agrees to hold MOFSL or any of its affiliates or employees free
and harmless from all losses, costs, damages, expenses that may be suffered by the person accessing this information due to any errors and delays.
Registered Office Address: Motilal Oswal Tower, Rahimtullah Sayani Road, Opposite Parel ST Depot, Prabhadevi, Mumbai-400025; Tel No.: 022 71934200/ 022-71934263; Website
www.motilaloswal.com.
CIN No.: L67190MH2005PLC153397.Correspondence Office Address: Palm Spring Centre, 2nd Floor, Palm Court Complex, New Link Road, Malad(West), Mumbai- 400 064. Tel No: 022 7188 1000.
Registration Nos.: Motilal Oswal Financial Services Limited (MOFSL)*: INZ000158836(BSE/NSE/MCX/NCDEX); CDSL and NSDL: IN-DP-16-2015; Research Analyst: INH000000412. AMFI: ARN - 146822; Investment Adviser: INA000007100; Insurance
Corporate Agent: CA0579 ;PMS:INP000006712. Motilal Oswal Asset Management Company Ltd. (MOAMC): PMS (Registration No.: INP000000670); PMS and Mutual Funds are offered through MOAMC which is group company of MOFSL. Motilal Oswal
Wealth Management Ltd. (MOWML): PMS (Registration No.: INP000004409) is offered through MOWML, which is a group company of MOFSL. Motilal Oswal Financial Services Limited is a distributor of Mutual Funds, PMS, Fixed Deposit, Bond,
NCDs,Insurance Products and IPOs.Real Estate is offered through Motilal Oswal Real Estate Investment Advisors II Pvt. Ltd. which is a group company of MOFSL. Private Equity is offered through Motilal Oswal Private Equity Investment Advisors Pvt.
Ltd which is a group company of MOFSL. Research & Advisory services is backed by proper research. Please read the Risk Disclosure Document prescribed by the Stock Exchanges carefully before investing. There is no assurance or guarantee of the
returns. Investment in securities market is subject to market risk, read all the related documents carefully before investing. Details of Compliance Officer: Name: Neeraj Agarwal, Email ID: na@motilaloswal.com, Contact No.:022-71881085.
* MOSL has been amalgamated with Motilal Oswal Financial Services Limited (MOFSL) w.e.f August 21, 2018 pursuant to order dated July 30, 2018 issued by Hon'ble National Company Law Tribunal, Mumbai Bench.
 Motilal Oswal Financial Services
Quant Research & India Strategy Gallery