19 September 2019
India Strategy
BSE Sensex: 36,093
Refer our latest India Strategy
report on - A peek into market-
cap changes since peak
Nifty-50: 10,705
The ‘In And Out’ of Institutional Flows
Institutional ownership of Indian equities has gone up by 900bp in a decade to
~35%. However, the color of institutional flows has transformed distinctly of late,
with domestic institutional investor (DII) flow significantly outpacing foreign
institutional investor (FII) flows over the last five years. Our analysis of the last 15
years also suggests a strong positive correlation of market returns with FII flows. In
this note, we discuss in detail various aspects of institutional flows and the relative
sectoral positioning.
Contrasting trends in DII and FII flows over the last decade
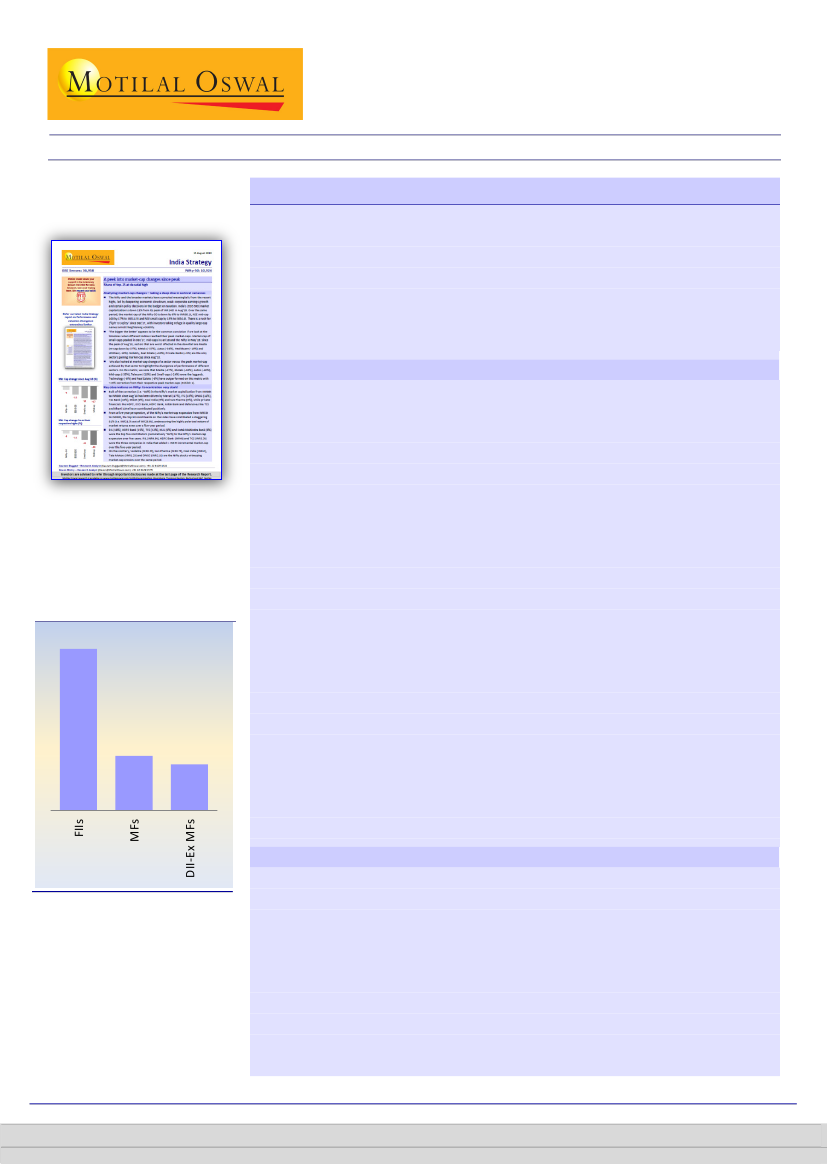
Institution value in India stands at
USD678b
418
141
119
Contrasting trends can be noticed in the dynamics of FII and DII flows in India
with a large part of the period under study being dominated by FII flows. While
FII flows tapered off post CY14, only then did DII flows pick up meaningfully,
especially mutual fund (MF) inflows. If we divide the decade (CY09-19) into two
blocks, FII flows dominated during CY09-14 with inflows of USD107b v/s DII
outflows of USD22b; DII flows dominated during CY15-19 YTD with inflows of
USD51b while FII inflows were a tepid USD16b.
FIIs:
Over the last 27 years beginning CY93, FIIs have invested USD178b in the
Indian Equity markets. The six-year period between CY09-14 was the peak with
cumulative FII inflows of USD107b. After peaking in CY14, FII inflows since then
have tapered off to a cumulative USD9.3b over CY15-18. CY19 has seen a revival
with CY19 YTD flows at USD6.5b, despite an outflow of USD4.9b since July’19.
DIIs:
Data on DII flows was made available in CY06; since then, DIIs have
invested USD55b in the Indian markets. While USD59.6b came in from Indian
mutual funds, there were outflows of USD4.6b from other domestic funds – ex
MFs. A large part of the USD55b DII flows – USD46.4b – came over the last five
years (CY14-19 YTD).
As a consequence of this, DII ownership of Indian Equities has increased from
10.5% in Mar’14 to 13.3% in Sep’19; while FII ownership has inched down
marginally from 21.8% to 21.3% over the same period. In terms of ownership of
free-float, FII ownership has decreased from 44.9% to 42.6% over a similar
period, while DII ownership has shown a meaningful jump from 21.6% to 26.6%.
Our analysis of the Nifty’s annual performance over the last 15 years v/s annual
FII flows shows that Nifty returns have a positive co-relation with FII flows.
In the 15-year period over CY04-18, FII flows have been positive in 12 calendar
years with just CY08, CY11 and CY18 witnessing outflows. Out of these 12 years,
Nifty has delivered positive annual returns in 11 out of 12 occasions, with CY15
being an exception.
On the contrary, the Nifty delivered negative returns in CY11 and CY15 despite
strong DII inflows of USD5.9b and USD10.2b, respectively. Similarly, despite DII
outflows of USD4.7b, USD10.9b, USD13b and USD4.9b in CY10, CY12, CY13 and
CY14, respectively, Nifty delivered positive returns in each of those years.
FII flows v/s market returns – strong positive co-relation
Gautam Duggad – Research Analyst
(Gautam.Duggad@MotilalOswal.com); +91 22 6129 1522
Deven Mistry – Research Analyst
(Deven@MotilalOswal.com); +91 22 6129 1575
Investors are advised to refer through important disclosures made at the last page of the Research Report.
Motilal Oswal research is available on www.motilaloswal.com/Institutional-Equities, Bloomberg, Thomson Reuters, Factset and S&P Capital.
 Motilal Oswal Financial Services
India Strategy | Flows
FII value (USD b) – Nifty-50 stocks
form 74% of total holdings in India
Anatomy of FII holdings – USD418b, Top-10 stocks account for 49%
418
410
311
At a cumulative investment of USD178b, the total market value of FII holdings in
India stands at USD418b as of Sep’19. The ratio of total market value of FII
holdings to cumulative investments of FIIs in India stands at 2.3x with a bottom
of 1.8x in CY13 and peak of 2.7x in CY09. Peak market value of FII holdings stood
at USD462b in CY17.
Over CY14-19 (YTD Sep’19), market value of FII holdings has grown at CAGR of
3% in USD terms and 6% in INR terms. Over a longer term horizon, say CY06-19
(YTD Sep’19), market value of FII holdings has grown 8% in USD terms and 12%
in INR terms.
Sector-wise holdings: Nifty-50 stocks form 74% of total FII holdings in India
while Nifty-500 accounts for 98%.
As on Sep’19 and on a sectoral basis, Private
Banks at USD103b, account for 25% of the USD418b market value of FII
holdings. NBFCs with 14% of the holdings are second with USD59b. Including
Insurance (2%) and PSU Banks (1% - with SBI at 0.8%), Financials form 42% of
the FII holdings in India. Technology, Oil & Gas (Reliance is 71% of total O&G
holdings of FIIs), Consumer and Automobiles follow with 12%, 9%, 8% and 5% of
holdings, respectively. Cumulatively these five sectors contribute 76% to the
total FII holdings in India.
Top-10 stocks form 49% of total FII holdings:
From a top-down perspective, FII
holdings seem concentrated – the top-25 stocks account for 65% of total India
holdings with the top-10 stocks alone accounting for 49%. In fact, the HDFC
twins – HDFC Bank and HDFC Ltd – the top two FII positions in India, form 19%
of total FII holdings in terms of market value. The rest eight stocks in the top-10
holdings are
RIL, ICICI BANK, TCS, INFOSYS, KOTAK MAHINDRA BANK, AXIS
BANK, INDUSIND BANK and ITC.
DII Value (USD b) – Nifty-50
accounts for 66% of the value of
total holdings in India
Anatomy of DII holdings – USD261b, Top-10 stocks account for 40%
261
253
171
The total value of DII holdings in India stands at USD261b as of Sep’19. Nifty
accounts for 2/3
rd
of these holdings while Nifty-500 accounts for 97%.
Sector-wise holdings:
On a sectoral basis, at USD40b, Private Banks accounted
for 15% of this USD261b market value of DII holdings as on Sep’19. Including
NBFCs (7%), PSU Banks (4%) and Insurance (1%), Financials form 27% of DII
holdings. Consumer comes second with USD32b (ITC alone accounts for 50% of
the USD32b holding) and accounts for 12% of DII holdings. Technology, Oil &
Gas, and Capital Goods follow with 10%, 10% and 8% of holdings, respectively.
Cumulatively, these five sectors contribute 67% to the total DII holdings in India.
Infrastructure, Logistics, Media and Real Estate are at the bottom with <1% each
of the DII holdings.
Top-10 stocks form 40% of total DII holdings:
DII holdings seem relatively less
concentrated v/s FII holdings; top-25 stocks account for 57% of the holdings
with the top-10 stocks alone accounting for 40%. ITC is the single largest holding
of DIIs with USD15.9b of holdings. The other stocks in the top-10 holdings are
ICICI BANK, RIL, HDFC BANK, INFOSYS, L&T, TCS, SBI, HDFC & AXIS BANK.
The
HDFC twins – HDFC Bank and HDFC Ltd – form 8% of the total DII holdings in
terms of market value.
Note: FII figures are actual numbers reported by NSDL, DII figures are provisional numbers reported by the NSE as available
since 2006, Mutual Fund figures are actual numbers reported by SEBI since 2000, DII Ex-MFs are derived numbers (DII
Provisional less actuals of MFs). Exhibit data is sourced from NSDL, SEBI, NSE, Capitaline and MOFSL database.
19 September 2019
2
 Motilal Oswal Financial Services
India Strategy | Flows
FII flows: Led the baton till CY14; Tapered off subsequently
In our detailed analysis of Institutional flows over the last fifteen years, we see
contrasting trends in the dynamics of FII and DII flows in India with a large part
of the period under study dominated by FII flows.
While FII flows tapered off post CY14, only then did DII flows pick up
meaningfully, especially Mutual Fund inflows.
If we divide the decade (CY09-19) into two blocks, FII flows dominated during
CY09-14 with inflows of USD107b v/s DII outflows of USD22b; DII flows
dominated during CY15-19 YTD with inflows of USD51b while FII inflows were a
tepid USD16b.
Over the last 27 years beginning CY93, FIIs have invested USD178b in the Indian
Equity markets. The six-year period between CY09-14 was the peak with
cumulative FII inflows of USD107b. After peaking in CY14, FII inflows since then
have tapered off to a cumulative USD9.3b over CY15-18. CY19 has seen a revival
with CY19 YTD flows at USD6.5b.
Exhibit 1:
FII investments in Indian Equity markets YTD stands at USD178b with only four years of outflows
Cumulative Flows: USD178.1b
CY93-CY08:
USD55.2b
CY09-CY19:
USD122.9b
Exhibit 2:
Cumulative FII flows since 2014 – till date v/s Markets
FII (USDb)
43.0
31.0
19.0
7.0
-5.0
Nifty Index (RHS)
12000
10500
9000
7500
6000
10,705
32
19 September 2019
3
 Motilal Oswal Financial Services
India Strategy | Flows
FII flows v/s market returns – strong positive co-relation
Our analysis of the Nifty’s annual performance over the last 15 years v/s annual
FII flows shows that Nifty returns have a positive co-relation with FII flows.
In the 15-year period over CY04-18, FII flows have been positive in 12 calendar
years with just CY08, CY11 and CY18 witnessing outflows. Out of these 12 years,
Nifty has delivered positive annual returns in 11 out of 12 occasions, with CY15
being an exception.
On the contrary, the Nifty delivered negative returns in CY11 and CY15 despite
strong DII inflows of USD5.9b and USD10.2b, respectively. Similarly, despite DII
outflows of USD4.7b, USD10.9b, USD13b and USD4.9b in CY10, CY12, CY13 and
CY14, respectively, Nifty delivered positive returns in each of those years.
Exhibit 4:
Years of weak FII flows v/s Market Returns (%)
FII Flows (USDb)
37
6
-1
Nifty return (%,YoY)
Exhibit 3:
Years of strong FII flows v/s Market Returns (%)
FII Flows (USDb)
72
55
36
40
29
18
8
18
18
25
28
31
20
7
16
8
29
76
Nifty return (%,YoY)
1
1
0
-18
-23
1
1
3
-1
-15
-12
-25
-52
-5
3
7
9
11
11
Exhibit 5:
Monthly FII flows – of late the trend has been negative
6.00
FII (USDb)
3.00
0.00
-3.00
-6.00
19 September 2019
4
 Motilal Oswal Financial Services
India Strategy | Flows
Anatomy of FII holdings – USD418b, Top-10 stocks account for 49%
At a cumulative investment of USD178b, the total market value of FII holdings in
India stands at USD418b as of Sep’19. The ratio of total market value of FII
holdings to cumulative investments of FIIs in India stands at 2.3x with a bottom
of 1.8x in CY13 and peak of 2.7x in CY09.
Peak market value of FII holdings stood at USD462b in CY17. Since then, the
correction in the markets, especially in broader markets, has resulted in
depletion of USD44b in the overall market value of FII holdings in India.
Over CY14-19 (YTD Sep’19), market value of FII holdings has grown at CAGR of
3% in USD terms and 6% in INR terms. Over a longer term horizon, say CY06-19
(YTD Sep’19), market value of FII holdings has grown 8% in USD terms and 12%
in INR terms.
Sector-wise holdings: Nifty-50 stocks form 74% of total FII holdings in India
while Nifty-500 accounts for 98%.
As on Sep’19 and on a sectoral basis, Private
Banks at USD103b, account for 25% of the USD418b market value of FII
holdings. NBFCs with 14% of the holdings are second with USD59b. Including
Insurance (2%) and PSU Banks (1% - with SBI at 0.8%), Financials form 42% of
the FII holdings in India. Technology, Oil & Gas (Reliance is 71% of total O&G
holdings of FIIs), Consumer and Automobiles follow with 12%, 9%, 8% and 5% of
holdings, respectively. Cumulatively these five sectors contribute 76% to the
total FII holdings in India. Metals, PSU banks, Real Estate, Infrastructure are at
the bottom and form just 1% each of the FII holdings.
Top-10 stocks form 49% of total FII holdings:
From a top-down perspective, FII
holdings seem concentrated – the top-25 stocks account for 65% of total India
holdings with the top-10 stocks alone accounting for 49%. In fact, the HDFC
twins – HDFC Bank and HDFC Ltd – the top two FII positions in India, form 19%
of total FII holdings in terms of market value. The rest eight stocks in the top-10
holdings are
RIL, ICICI BANK, TCS, INFOSYS, KOTAK MAHINDRA BANK, AXIS
BANK, INDUSIND BANK and ITC.
Exhibit 6:
The total market value of FII holdings in India stands at USD418b
Mkt Value of FII holdings (USDb)
15.9
17.3
16.9
19.1
21.5
22.3
162.3
Cummulative FII Investments (USDb)
21.0
165.6
20.3
168.5
19.9
176.2
20.3
171.6
21.3
178.1
146.1
126.1
102.1
72.8
199
276
101.6
462
359
192
246
258
328
320
429
418
CY09
CY10
CY11
CY12
CY13
CY14
CY15
CY16
CY17
CY18
CY19*
FII Holding in Indian Market (%)
* Market value as of Sep 2019
19 September 2019
5
 Motilal Oswal Financial Services
India Strategy | Flows
Exhibit 7:
Sector Value of FII market holdings – Top five contributes ~70%
103
FII Value (USDb)
FII Value (USDb)
418
410
311
59
51
39
35
23
17
12 11 9
8
7
6
6
6
6
5
4
3
3
3
2
Exhibit 8:
Top-25 FII stocks by market value – HDFC twins account for 19% of total FII holdings in India
Company
HDFC Bank
HDFC
Reliance Inds.
ICICI Bank
TCS
Infosys
Kotak Mah. Bank
Axis Bank
IndusInd Bank
ITC
HUL
Bajaj Finance
Maruti Suzuki
HCL Technologies
Larsen & Toubro
Bharti Airtel
Power Grid Corpn
SBI
M&M
Tech Mahindra
Asian Paints
Bharti Infra.
Titan Company
UltraTech Cem.
Godrej Consumer
FII Holding (%)
50.2
74.7
26.2
56.8
15.9
33.8
40.5
49.6
56.7
16.9
12.1
21.7
23.2
28.6
21.3
22.1
28.0
12.0
41.9
39.0
16.7
43.8
19.6
18.7
28.0
FII Value (USD b) CY19YTD returns (%) 5 Year CAGR (%)
43.1
36.3
27.9
20.2
17.9
16.9
16.1
11.8
7.2
7.0
6.8
6.0
5.9
5.8
5.6
5.5
4.2
4.2
3.9
3.8
3.5
2.9
2.9
2.8
2.7
3.7
0.2
5.1
7.4
11.0
24.4
15.8
3.0
-19.8
-15.9
-0.3
27.3
-20.4
9.0
-9.6
17.6
1.1
-7.3
-35.4
-2.4
13.2
-3.9
24.0
-3.5
-19.4
20.7
13.1
18.8
6.2
9.2
12.2
22.3
9.4
15.3
-0.2
19.7
65.8
14.0
4.7
4.9
-2.4
8.0
1.3
-5.5
2.6
18.4
-4.2
24.3
7.9
13.9
10 Year CAGR (%)
21.9
14.6
8.4
9.7
21.8
10.8
23.0
13.3
28.1
12.1
21.4
65.3
13.7
20.0
5.9
-1.8
6.4
2.5
8.9
12.0
27.5
NA
33.7
17.3
23.1
Note: FII value and holding includes Custodians (against Depository Receipts)
19 September 2019
6
 Motilal Oswal Financial Services
India Strategy | Flows
Exhibit 9:
Nifty-50: Stocks held by number of FIIs
Company
HDFC
TCS
HDFC Bank
Reliance Inds.
ICICI Bank
Infosys
ITC
Hind. Unilever
HCL Technologies
Axis Bank
Maruti Suzuki
Tech Mahindra
Larsen & Toubro
Power Grid Corpn
SBI
Bajaj Fin.
Titan Company
Number of FIIs
1,683
1,348
1,259
1,237
1,199
1,169
1,098
1,033
1,025
1,014
1,002
907
878
792
769
755
754
Company
Asian Paints
Hero Motocorp
GAIL (India)
M&M
UPL
UltraTech Cem.
ONGC
Wipro
BPCL
Bharti Infra.
Kotak Mah. Bank
Bharti Airtel
Hindalco Inds.
Eicher Motors
Indiabulls Hous.
Dr Reddy's Labs
Coal India
Number of FIIs
752
749
726
718
695
687
684
683
676
654
637
636
630
623
617
615
611
Company
IOCL
Zee Entertainment
Sun Pharma
Bajaj Auto
Tata Steel
Britannia Inds.
IndusInd Bank
NTPC
Adani Ports
Vedanta
Yes Bank
Cipla
JSW Steel
Grasim Inds
Tata Motors
Bajaj Finserv
Number of FIIs
601
593
592
589
575
569
568
543
540
534
531
525
488
485
480
453
Source: BSE
Exhibit 10:
Trend in FII & DII holding (%)
24.0
21.5
19.0
16.5
14.0
FII Holding (%)
DII Holding (%) - RHS
15.0
21.3
13.3
13.5
12.0
10.5
9.0
Exhibit 11:
In terms of ownership of free float, FII has decreased, while DII ownership has shown a meaningful jump
FII Proportion of Free Float (%)
47.0
44.0
41.0
38.0
35.0
DII Proportion of Free Float (%) - RHS
26.6
28.0
42.6
26.0
24.0
22.0
20.0
19 September 2019
7
 Motilal Oswal Financial Services
India Strategy | Flows
DII: Gathered momentum post CY14; Solid run continues
DII:
Data on DII flows was made available in CY06; since then, DIIs have invested
USD55b in the Indian markets. While USD59.6b came in from Indian Mutual
Funds, there were outflows of USD4.6b from domestic funds – ex MFs
(Insurance).
A large part of the USD55b DII flows – USD46.4b – came over the last five years
(CY14-19 YTD), while DII flows over CY06-13 amounted to just USD8.7b.
MFs:
Within DII flows, Mutual Fund flows picked up significantly in the last five
years. Over CY14-19 YTD, total Domestic MF flows stood at USD64.8b while
CY00-13 cumulatively resulted in an outflow of USD4.2b. We believe that the
beginning of the SIP cult has catalyzed this to a large extent. In fact, CY17/CY18
together accounted for 60% of total flows with USD18.4b/USD17.5b of inflows.
DIIs – ex-MFs:
After six consecutive years of inflows amounting to USD30b over
CY06-11, DII flow – ex-MFs have seen seven consecutive years of outflows
amounting to USD34b over CY12-18. Even CY19 YTD has seen an outflow of
USD0.9b.
Cumulative Flows: USD55b
CY06-CY13:
USD8.7b
CY14-CY19:
USD46.4b
Exhibit 12:
DIIs have invested USD55b till date; contributed majorly by MFs post CY15
Exhibit 13:
MF flows have picked up momentum post CY14; CY17 + CY18 contributed 70% to total flows of the last decade
Cumulative Flows: USD60.6b
CY00-CY08:
USD9.5b
CY09-CY19:
USD51.2b
Note: DII figures are provisional numbers reported by the NSE as available since 2006, Mutual Fund figures are actual numbers
reported by SEBI since 2000, DII Ex-MFs are derived numbers (DII Provisional less actuals of MFs).
19 September 2019
8
 Motilal Oswal Financial Services
India Strategy | Flows
Exhibit 14:
DIIs ex-MFs have seen outflows for eight years in a row
Eight consecutive years of outflows
amounting to USD35b
Six consecutive years of inflows
amounting to USD30b
Exhibit 15:
Monthly MF flows – Only two months of outflows in last three years
4.0
3.0
2.0
1.0
0.0
-1.0
-2.0
Domestic MF (USDb)
Only 2 months of outflows in last 3 years
Exhibit 16:
Monthly DIIs ex-MFs flows
1.0
DIIs ex-MFs (USDb)
USD1.4b inflows
in last 3 months
0.0
-1.0
-2.0
19 September 2019
9
 Motilal Oswal Financial Services
India Strategy | Flows
Anatomy of DII holdings – US$ 261bn, Top-10 accounts for 40%
DII Value in India stands at
USD261b
141
119
The total value of DII holdings in India stands at USD261b as of Sep’19. Nifty
accounts for 2/3rd of these holdings while Nifty-500 accounts for 97%.
Sector-wise holdings:
On a sectoral basis, at USD40b, Private Banks accounted
for 15% of this USD261b market value of DII holdings as on Sep’19. Including
NBFCs (7%), PSU Banks (4%) and Insurance (1%), Financials form 27% of DII
holdings. Consumer comes second with USD32b (ITC alone accounts for 50% of
the USD32b holding) and accounts for 12% of DII holdings. Technology, Oil &
Gas, and Capital Goods follow with 10%, 10% and 8% of holdings, respectively.
Cumulatively, these five sectors contribute 67% to the total DII holdings in India.
Infrastructure, Logistics, Media and Real Estate are at the bottom with <1% each
of the DII holdings.
Top-10 stocks form 40% of total DII holdings:
DII holdings seem relatively less
concentrated v/s FII holdings; top-25 stocks account for 57% of the holdings
with the top-10 stocks alone accounting for 40%. ITC is the single largest holding
of DIIs with USD15.9b of holdings. The other stocks in the top-10 holdings are
ICICI BANK, RIL, HDFC BANK, INFOSYS, L&T, TCS, SBI, HDFC & AXIS BANK. The
HDFC twins – HDFC Bank and HDFC Ltd – form 8% of the total DII holdings in
terms of market value.
Exhibit 17:
Market value of DII holdings stand at USD261b; Top five sectors contributes 55%
40
32
27 25
20 18
16
12 12 11 11
6
6
6
4
3
3
2
1
1
1
1
DII Value (USDb)
261
DII Value (USDb)
253
171
19 September 2019
10
 Motilal Oswal Financial Services
India Strategy | Flows
Exhibit 18:
Top-25 stocks by DII Value – ITC single largest holding; Top-10 stocks form 40% of total DII holdings by market
value
Company
ITC
ICICI Bank
Reliance Inds.
HDFC Bank
Infosys
Larsen & Toubro
TCS
SBI
HDFC
Axis Bank
NTPC
Kotak Mah. Bank
Hind.Zinc
Hind. Unilever
Maruti Suzuki
Bharti Airtel
ONGC
Coal India
Sun Pharma
Bajaj Finance
IOCL
M&M
GAIL
BPCL
Asian Paints
DII Holding (%)
38.3
34.8
11.6
13.9
23.0
37.3
7.9
23.5
14.8
22.7
28.5
11.7
32.1
6.9
13.5
13.1
14.4
17.4
18.0
8.3
13.3
23.1
22.8
16.4
9.1
DII Value (USDb) CY19YTD returns (%) 5 Year CAGR (%)
15.9
12.4
12.4
11.9
11.5
9.7
8.9
8.2
7.2
5.4
4.9
4.7
4.1
3.9
3.4
3.3
3.2
3.0
2.5
2.3
2.2
2.1
2.0
1.9
1.9
-15.9
7.4
5.1
3.7
24.4
-9.6
11.0
-7.3
0.2
3.0
-1.7
15.8
-24.4
-0.3
-20.4
17.6
-17.2
-19.6
-4.6
27.3
-8.0
-35.4
-26.2
4.6
13.2
-0.2
6.2
18.8
20.7
12.2
4.9
9.2
1.3
13.1
9.4
1.2
22.3
4.7
19.7
14.0
-2.4
-14.4
-11.0
-12.6
65.8
6.3
-5.5
1.0
11.7
18.4
10 Year CAGR (%)
12.1
9.7
8.4
21.9
10.8
5.9
21.8
2.5
14.6
13.3
-3.4
23.0
9.8
21.4
13.7
-1.8
-4.3
NA
13.1
65.3
4.4
8.9
3.0
15.4
27.5
19 September 2019
11
 Motilal Oswal Financial Services
India Strategy | Flows
NOTES
19 September 2019
12
 Motilal Oswal Financial Services
India Strategy | Flows
India Strategy, Thematics and Quant Research Gallery
19 September 2019
13
 Motilal Oswal Financial Services
India Strategy | Flows
Explanation of Investment Rating
Investment Rating
BUY
SELL
NEUTRAL
UNDER REVIEW
NOT RATED
Expected return (over 12-month)
>=15%
< - 10%
> - 10 % to 15%
Rating may undergo a change
We have forward looking estimates for the stock but we refrain from assigning recommendation
*In
case the recommendation given by the Research Analyst is inconsistent with the investment rating legend for a continuous period of 30 days, the Research Analyst shall within following 30 days take appropriate measures to make the recommendation
consistent with the investment rating legend.
Disclosures:
The following Disclosures are being made in compliance with the SEBI Research Analyst Regulations 2014 (herein after referred to as the Regulations).
Motilal Oswal Financial Services Ltd. (MOFSL) is a SEBI Registered Research Analyst having registration no. INH000000412. MOFSL, the Research Entity (RE) as defined in the Regulations, is engaged in the business of providing Stock broking services,
Investment Advisory Services, Depository participant services & distribution of various financial products. MOFSL is a subsidiary company of Passionate Investment Management Pvt. Ltd.. (PIMPL). MOFSL is a listed public company, the details in respect of
which are available on
www.motilaloswal.com.
MOFSL (erstwhile Motilal Oswal Securities Limited - MOSL) is registered with the Securities & Exchange Board of India (SEBI) and is a registered Trading Member with National Stock Exchange of India Ltd. (NSE)
and Bombay Stock Exchange Limited (BSE), Multi Commodity Exchange of India Limited (MCX) and National Commodity & Derivatives Exchange Limited (NCDEX) for its stock broking activities & is Depository participant with Central Depository Services Limited
(CDSL) National Securities Depository Limited (NSDL),NERL, COMRIS and CCRL and is member of Association of Mutual Funds of India (AMFI) for distribution of financial products and Insurance Regulatory & Development Authority of India (IRDA) as
Corporate Agent for insurance products. Details of associate entities of Motilal Oswal Financial Services Limited are available on the website at
http://onlinereports.motilaloswal.com/Dormant/documents/Associate%20Details.pdf
Details of pending Enquiry Proceedings of Motilal Oswal Financial Services Limited are available on the website at
https://galaxy.motilaloswal.com/ResearchAnalyst/PublishViewLitigation.aspx
MOFSL, it’s associates, Research Analyst or their relative may have any financial interest in the subject company. MOFSL and/or its associates and/or Research Analyst may have actual/beneficial ownership of 1% or more securities in the subject company in the
past 12 months.
MOFSL and its associate company(ies), their directors and Research Analyst and their relatives may; (a) from time to time, have a long or short position in, act as principal in, and buy or sell the securities or derivatives thereof of companies
mentioned herein. (b) be engaged in any other transaction involving such securities and earn brokerage or other compensation or act as a market maker in the financial instruments of the company(ies) discussed herein or act as an advisor or lender/borrower to
such company(ies) or may have any other potential conflict of interests with respect to any recommendation and other related information and opinions.; however the same shall have no bearing whatsoever on the specific recommendations made by the
analyst(s), as the recommendations made by the analyst(s) are completely independent of the views of the associates of MOFSL even though there might exist an inherent conflict of interest in some of the stocks mentioned in the research report.
Research
Analyst may have served as director/officer, etc. in the subject company in the past 12 months. MOFSL and/or its associates may have received any compensation from the subject company in the past 12 months.
In the past 12 months , MOFSL or any of its associates may have:
a)
managed or co-managed public offering of securities from subject company of this research report,
b)
received compensation for investment banking or merchant banking or brokerage services from subject company of this research report,
c)
received compensation for products or services other than investment banking or merchant banking or brokerage services from the subject company of this research report.
d)
Subject Company may have been a client of MOFSL or its associates in the past 12 months.
MOFSL and it’s associates have not received any compensation or other benefits from the subject company or third party in connection with the research report. To enhance transparency, MOFSL has incorporated a Disclosure of Interest Statement in this
document. This should, however, not be treated as endorsement of the views expressed in the report. MOFSL and / or its affiliates do and seek to do business including investment banking with companies covered in its research reports. As a result, the recipients
of this report should be aware that MOFSL may have a potential conflict of interest that may affect the objectivity of this report. Compensation of Research Analysts is not based on any specific merchant banking, investment banking or brokerage service
transactions. Above disclosures include beneficial holdings lying in demat account of MOFSL which are opened for proprietary investments only. While calculating beneficial holdings, It does not consider demat accounts which are opened in name of MOFSL for
other purposes (i.e holding client securities, collaterals, error trades etc.). MOFSL also earns DP income from clients which are not considered in above disclosures. Above disclosures include beneficial holdings lying in demat account of MOFSL which are
opened for proprietary investments only. While calculating beneficial holdings, It does not consider demat accounts which are opened in name of MOFSL for other purposes (i.e holding client securities, collaterals, error trades etc.). MOFSL also earns DP income
from clients which are not considered in above disclosures.
Terms & Conditions:
This report has been prepared by MOFSL and is meant for sole use by the recipient and not for circulation. The report and information contained herein is strictly confidential and may not be altered in any way, transmitted to, copied or distributed, in part or in
whole, to any other person or to the media or reproduced in any form, without prior written consent of MOFSL. The report is based on the facts, figures and information that are considered true, correct, reliable and accurate. The intent of this report is not
recommendatory in nature. The information is obtained from publicly available media or other sources believed to be reliable. Such information has not been independently verified and no guaranty, representation of warranty, express or implied, is made as to its
accuracy, completeness or correctness. All such information and opinions are subject to change without notice. The report is prepared solely for informational purpose and does not constitute an offer document or solicitation of offer to buy or sell or subscribe for
securities or other financial instruments for the clients. Though disseminated to all the customers simultaneously, not all customers may receive this report at the same time. MOFSL will not treat recipients as customers by virtue of their receiving this report.
Analyst Certification
The views expressed in this research report accurately reflect the personal views of the analyst(s) about the subject securities or issues, and no part of the compensation of the research analyst(s) was, is, or will be directly or indirectly related to the specific
recommendations and views expressed by research analyst(s) in this report.
Disclosure of Interest Statement
Analyst ownership of the stock
Companies where there is interest
No
A graph of daily closing prices of securities is available at
www.nseindia.com, www.bseindia.com.
Research Analyst views on Subject Company may vary based on Fundamental research and Technical Research. Proprietary trading desk of MOFSL or its
associates maintains arm’s length distance with Research Team as all the activities are segregated from MOFSL research activity and therefore it can have an independent view with regards to subject company for which Research Team have expressed their
views.
Regional Disclosures (outside India)
This report is not directed or intended for distribution to or use by any person or entity resident in a state, country or any jurisdiction, where such distribution, publication, availability or use would be contrary to law, regulation or which would subject MOFSL & its
group companies to registration or licensing requirements within such jurisdictions.
For Hong Kong:
This report is distributed in Hong Kong by Motilal Oswal capital Markets (Hong Kong) Private Limited, a licensed corporation (CE AYY-301) licensed and regulated by the Hong Kong Securities and Futures Commission (SFC) pursuant to the Securities and
Futures Ordinance (Chapter 571 of the Laws of Hong Kong) “SFO”. As per SEBI (Research Analyst Regulations) 2014 Motilal Oswal Financial Services Limited(SEBI Reg No. INH000000412) has an agreement with Motilal Oswal capital Markets (Hong Kong)
Private Limited for distribution of research report in Hong Kong. This report is intended for distribution only to “Professional Investors” as defined in Part I of Schedule 1 to SFO. Any investment or investment activity to which this document relates is only available
to professional investor and will be engaged only with professional investors.” Nothing here is an offer or solicitation of these securities, products and services in any jurisdiction where their offer or sale is not qualified or exempt from registration. The Indian
Analyst(s) who compile this report is/are not located in Hong Kong & are not conducting Research Analysis in Hong Kong.
For U.S:
Motilal Oswal Financial Services Limited (MOFSL) is not a registered broker - dealer under the U.S. Securities Exchange Act of 1934, as amended (the"1934 act") and under applicable state laws in the United States. In addition MOFSL is not a registered
investment adviser under the U.S. Investment Advisers Act of 1940, as amended (the "Advisers Act" and together with the 1934 Act, the "Acts), and under applicable state laws in the United States. Accordingly, in the absence of specific exemption under the
Acts, any brokerage and investment services provided by MOFSL, including the products and services described herein are not available to or intended for U.S. persons. This report is intended for distribution only to "Major Institutional Investors" as defined by
Rule 15a-6(b)(4) of the Exchange Act and interpretations thereof by SEC (henceforth referred to as "major institutional investors"). This document must not be acted on or relied on by persons who are not major institutional investors. Any investment or investment
activity to which this document relates is only available to major institutional investors and will be engaged in only with major institutional investors. In reliance on the exemption from registration provided by Rule 15a-6 of the U.S. Securities Exchange Act of 1934,
as amended (the "Exchange Act") and interpretations thereof by the U.S. Securities and Exchange Commission ("SEC") in order to conduct business with Institutional Investors based in the U.S., MOFSL has entered into a chaperoning agreement with a U.S.
registered broker-dealer, Motilal Oswal Securities International Private Limited. ("MOSIPL"). Any business interaction pursuant to this report will have to be executed within the provisions of this chaperoning agreement.
The Research Analysts contributing to the report may not be registered /qualified as research analyst with FINRA. Such research analyst may not be associated persons of the U.S. registered broker-dealer, MOSIPL, and therefore, may not be subject to NASD
rule 2711 and NYSE Rule 472 restrictions on communication with a subject company, public appearances and trading securities held by a research analyst account.
For Singapore:
In Singapore, this report is being distributed by Motilal Oswal Capital Markets Singapore Pte Ltd (“MOCMSPL”) (Co.Reg. NO. 201129401Z) which is a holder of a capital markets services license and an exempt financial adviser in Singapore,
as per the approved agreement under Paragraph 9 of Third Schedule of Securities and Futures Act (CAP 289) and Paragraph 11 of First Schedule of Financial Advisors Act (CAP 110) provided to MOCMSPL by Monetary Authority of Singapore. Persons in
Singapore should contact MOCMSPL in respect of any matter arising from, or in connection with this report/publication/communication. This report is distributed solely to persons who qualify as “Institutional Investors”, of which some of whom may consist of
"accredited" institutional investors as defined in section 4A(1) of the Securities and Futures Act, Chapter 289 of Singapore (“the SFA”). Accordingly, if a Singapore person is not or ceases to be such an institutional investor, such Singapore Person must
immediately discontinue any use of this Report and inform MOCMSPL.
Disclaimer:
The report and information contained herein is strictly confidential and meant solely for the selected recipient and may not be altered in any way, transmitted to, copied or distributed, in part or in whole, to any other person or to the media or
reproduced in any form, without prior written consent. This report and information herein is solely for informational purpose and may not be used or considered as an offer document or solicitation of offer to buy or sell or subscribe for securities or other financial
instruments. Nothing in this report constitutes investment, legal, accounting and tax advice or a representation that any investment or strategy is suitable or appropriate to your specific circumstances. The securities discussed and opinions expressed in this report
may not be suitable for all investors, who must make their own investment decisions, based on their own investment objectives, financial positions and needs of specific recipient. This may not be taken in substitution for the exercise of independent judgment by
any recipient. Each recipient of this document should make such investigations as it deems necessary to arrive at an independent evaluation of an investment in the securities of companies referred to in this document (including the merits and risks involved), and
should consult its own advisors to determine the merits and risks of such an investment. The investment discussed or views expressed may not be suitable for all investors. Certain transactions -including those involving futures, options, another derivative
products as well as non-investment grade securities - involve substantial risk and are not suitable for all investors. No representation or warranty, express or implied, is made as to the accuracy, completeness or fairness of the information and opinions contained
in this document. The Disclosures of Interest Statement incorporated in this document is provided solely to enhance the transparency and should not be treated as endorsement of the views expressed in the report. This information is subject to change without
any prior notice. The Company reserves the right to make modifications and alternations to this statement as may be required from time to time without any prior approval. MOFSL, its associates, their directors and the employees may from time to time, effect or
have effected an own account transaction in, or deal as principal or agent in or for the securities mentioned in this document. They may perform or seek to perform investment banking or other services for, or solicit investment banking or other business from, any
company referred to in this report. Each of these entities functions as a separate, distinct and independent of each other. The recipient should take this into account before interpreting the document. This report has been prepared on the basis of information that
is already available in publicly accessible media or developed through analysis of MOFSL. The views expressed are those of the analyst, and the Company may or may not subscribe to all the views expressed therein. This document is being supplied to you
solely for your information and may not be reproduced, redistributed or passed on, directly or indirectly, to any other person or published, copied, in whole or in part, for any purpose. This report is not directed or intended for distribution to, or use by, any person or
entity who is a citizen or resident of or located in any locality, state, country or other jurisdiction, where such distribution, publication, availability or use would be contrary to law, regulation or which would subject MOFSL to any registration or licensing requirement
within such jurisdiction. The securities described herein may or may not be eligible for sale in all jurisdictions or to certain category of investors. Persons in whose possession this document may come are required to inform themselves of and to observe such
restriction. Neither the Firm, not its directors, employees, agents or representatives shall be liable for any damages whether direct or indirect, incidental, special or consequential including lost revenue or lost profits that may arise from or in connection with the use
of the information.
The person accessing this information specifically agrees to exempt MOFSL or any of its affiliates or employees from, any and all responsibility/liability arising from such misuse and agrees not to hold MOFSL or any of its affiliates or employees
responsible for any such misuse and further agrees to hold MOFSL or any of its affiliates or employees free and harmless from all losses, costs, damages, expenses that may be suffered by the person accessing this information due to any errors and delays.
Registered Office Address: Motilal Oswal Tower, Rahimtullah Sayani Road, Opposite Parel ST Depot, Prabhadevi, Mumbai-400025; Tel No.: 022 71934200/ 022-71934263; Website
www.motilaloswal.com.
CIN No.: L67190MH2005PLC153397.Correspondence Office Address: Palm Spring Centre, 2nd Floor, Palm Court Complex, New Link Road, Malad(West), Mumbai- 400 064. Tel No: 022 7188 1000.
Registration Nos.: Motilal Oswal Financial Services Limited (MOFSL)*: INZ000158836(BSE/NSE/MCX/NCDEX); CDSL and NSDL: IN-DP-16-2015; Research Analyst: INH000000412. AMFI: ARN - 146822; Investment Adviser: INA000007100; Insurance
Corporate Agent: CA0579 ;PMS:INP000006712. Motilal Oswal Asset Management Company Ltd. (MOAMC): PMS (Registration No.: INP000000670); PMS and Mutual Funds are offered through MOAMC which is group company of MOFSL. Motilal Oswal Wealth
Management Ltd. (MOWML): PMS (Registration No.: INP000004409) is offered through MOWML, which is a group company of MOFSL. Motilal Oswal Financial Services Limited is a distributor of Mutual Funds, PMS, Fixed Deposit, Bond, NCDs,Insurance
Products and IPOs.Real Estate is offered through Motilal Oswal Real Estate Investment Advisors II Pvt. Ltd. which is a group company of MOFSL. Private Equity is offered through Motilal Oswal Private Equity Investment Advisors Pvt. Ltd which is a group
company of MOFSL. Research & Advisory services is backed by proper research. Please read the Risk Disclosure Document prescribed by the Stock Exchanges carefully before investing. There is no assurance or guarantee of the returns. Investment in
securities market is subject to market risk, read all the related documents carefully before investing. Details of Compliance Officer: Name: Neeraj Agarwal, Email ID: na@motilaloswal.com, Contact No.:022-71881085.
* MOSL has been amalgamated with Motilal Oswal Financial Services Limited (MOFSL) w.e.f August 21, 2018 pursuant to order dated July 30, 2018 issued by Hon'ble National Company Law Tribunal, Mumbai Bench.
19 September 2019
14