June 2024
India Strategy
BSE Sensex: 77,338
Refer to our strategy note on
Corporate profit to GDP –
Rebounds to a 15-year high!
Nifty-50: 23,516
Indian PSUs – Back with a vengeance!
Indian PSUs: Earnings momentum fueling the outperformance!
Rebounding in style…:
After a decade of underperformance, the Indian PSUs
have made an admirable comeback. They have marked FY24 as the year of clear
outperformance. This was evident in the sharp run-up of PSU companies and
their index outperformance compared to the Nifty-50 in the previous year.
…and galloping ahead:
Since our
previous report
on PSUs, released on 21
st
Dec’22, the PSU index has surged 113% to date. Conversely, the market
capitalization of the BSE PSU Index has galloped ~2.1x to INR69.1t from INR32.5t
between Dec’22 and Jun’24. The BSE PSU Index P/E ratio has expanded to 12.8x
from 8.7x during the same period.
As FY24 came to an end, we are revisiting our findings on Indian PSUs.
After a period of weak performance at the start of the past decade, PSUs made a
comeback and reported a strong revival in their profits in the previous five years.
The government’s infrastructure and capex push, which had gained momentum
post-pandemic, along with cleaner balance sheet, improved governance, margin
tailwinds for commodities, and burgeoning order books, have continued to drive
the PSU outperformance and their rerating, in our opinion.
During FY19-24, PSU earnings reported a 33.8% CAGR, outperforming that of the
Private Sector, which posted an 18.6% CAGR over the same period. The share of
PSUs in the profit pool expanded to 36% in FY24 after hovering in the 17-30%
range during the past few years.
Further, the earnings of PSUs during FY24
witnessed a spectacular growth of 45% YoY.
Notably, the loss pools of PSUs have reduced consistently over the last five
years.
The contribution of loss-making companies (accounting for 1% of profit
pool as of FY24 vs. 45% in FY18) has dwindled over the past few years.
The RoE of the PSU universe also jumped to 17.6% in FY24 from the lows of 5.2%
in FY18.
Sharp underperformance of the past continues to catch up:
The PSU index
posted a CAGR of 9.6%, underperforming Nifty-50 (12% CAGR) during Jun’14-
Jun’24. Notably, the majority of the gains for PSUs have occurred in the past
four years only. The BSE PSU index reported a 9% compounded decline during
Jun’14-Jun’20, but clocked an impressive CAGR of 45% during the past four
years (Jun’20-Jun’24). During FY24, the PSU index returns of +92.4% significantly
outperformed the benchmark (+28.6%). Further, the outperformance continues
as of FY25YTD; the PSU index is up by 18% vs. the benchmark (+5.5%).
A steep fall and then a laudable rise in the market cap share:
Notably, the
market cap share of PSUs in India, which dropped significantly to 10.5% in FY22
from 20.8% in FY14, has since recovered and currently stands at 17.5%. Over a
similar period, India’s market cap skyrocketed to INR389t in FY24 from INR69t in
FY14 and currently it stands at INR440t. During FY14-24, PSUs’ market cap
surged to INR66t (INR77t as of Jun’24) from INR14t, while the private sector’s
market cap catapulted to INR323t (INR363t as of Jun’24) from INR55t.
Strong business narratives and growing order book driving a rerating
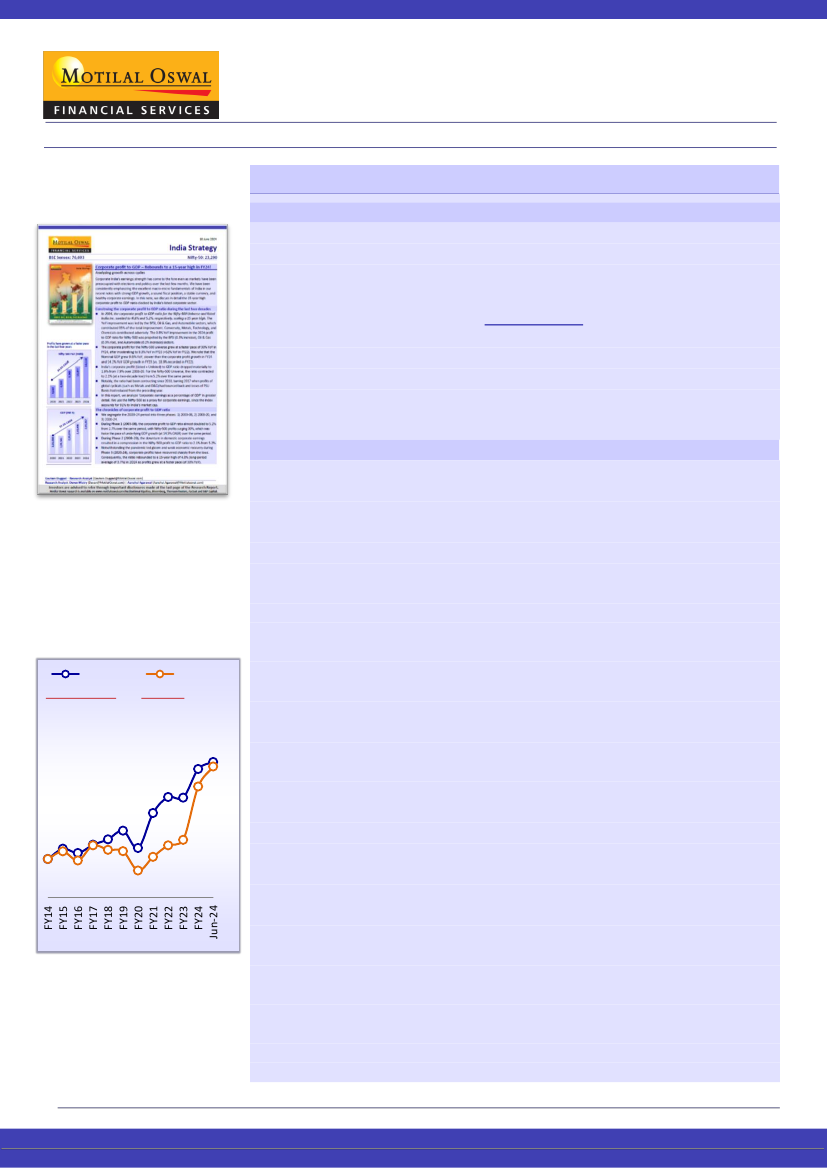
PSU index has outperformed the
Nifty in FY25YTD
Nifty Index
PSU Index
CAGR:FY14-24
FY25YTD
Nifty Index: 12.8% Nifty Index: 5.5%
PSU Index: 11.1% PSU Index:18%
351
339
100
Gautam Duggad – Research Analyst
(Gautam.Duggad@MotilalOswal.com)
Deven Mistry – Research Analyst
(Deven@MotilalOswal.com)
/
Aanshul Agarawal
(Aanshul.Agarawal@Motilaloswal.com)
Investors are advised to refer through important disclosures made at the last page of the Research Report.
Motilal Oswal research is available on www.motilaloswal.com/Institutional-Equities, Bloomberg, Thomson Reuters, Factset and S&P Capital.
 Motilal Oswal Financial Services
India Strategy | Indian PSUs
PAT growth expected over FY24-26 (%)
31
22
15
6
16
12
Healthy outlook to continue!
-7
Fundamentally, India is witnessing its own mini-Goldilocks moment with
excellent macros (GDP growth of 8.2% in FY24 on the back of ~7% growth in
FY23, inflation at ~5%, both current account and fiscal deficits well within
tolerance band, stable currency, etc.), robust corporate earnings (Nifty ended
FY24 with 25% earnings growth and FY25/26 earnings are likely to post 14-15%
CAGR), focus on manufacturing, capex and infrastructure creation, and
valuations at ~20x one-year forward earnings.
The political stability with Modi 3.0 augurs well for the economy and capital
markets as it provides the necessary stability and continuity in policy-making
which will likely continue pushing its economic agenda.
This verdict and the consequent political stability and continuity in policy-
making will act like an icing on the cake and keep India as the cynosure of all
eyes, in our view.
For our MOFSL Coverage PSU Universe (~55% of Indian PSU Mcap), we estimate
that the FY24-26 PAT CAGR is likely to moderate to 6%, mainly due to conservative
margin assumptions for O&G. Conversely, the earnings growth for other sectors
continues to remain strong. Ex O&G, we estimate a PAT CAGR of 15% for MOFSL
Coverage PSU Universe. For the said Universe, incremental profits would be
contributed by BFSI (120%), followed by Metals (22%). O&G is likely to drag the
earnings CAGR with an adverse contribution of -47% to overall profitability.
The road ahead:
As we look forward, the profitability of PSUs is likely to
improve notably across domestic and global cyclicals, with a sharp turnaround in
the fortunes of PSU Banks driving the overall trend. Higher commodity prices
over the last two years have strengthened the P&L and balance sheets of Metals
and O&G PSUs. The government’s emphasis on localization, increased capex,
and ‘Make-in-India’ in the defense sector has catalyzed the improvement in the
fortunes of Industrial PSUs. Hence, we expect the recovery in PSUs’ contribution
to earnings and market capitalization to continue.
Preferred PSU Ideas:
SBI, Coal India, GAIL, HPCL, and Bank of Baroda.
Exhibit 1:
Preferred PSU’s valuations
Company
State Bank
Coal India
Bank of Baroda
GAIL
HPCL
Mkt Cap
(USDb)
90.4
36.4
17.8
17.5
9.0
CMP
(INR)
845
489
287
222
530
EPS (INR)
EPS CAGR (%)
PE (x)
PB (x)
ROE (%)
FY24 FY25E FY26E
FY24-26
FY24 FY25E FY26E FY24 FY25E FY26E FY24 FY25E FY26E
75.2 89.4 104.7
18.0
10.0 9.4
8.1
1.7
1.6
1.4 18.8 18.8
18.5
60.7 55.9 66.0
4.3
7.1
8.7
7.4
3.2
3.0
2.5 45.2 34.6
34.1
34.4 39.4 45.1
14.6
7.7
7.3
6.4
1.3
1.2
1.0 17.9 17.7
17.6
13.7 13.1 16.5
9.8
13.2 16.9
13.4 1.8
2.0
1.9 15.0 12.9
15.0
112.9 71.9 72.1
-20.1
4.2
7.4
7.4
1.4
1.4
1.2 40.4 20.2
17.6
Source: Company, MOFSL
Note: Exhibit data is sourced from Capitaline, Bloomberg and MOFSL research database. Prices as of 18th June’24 closing.
June 2024
2
 Motilal Oswal Financial Services
India Strategy | Indian PSUs
Insightful trends
Exhibit 2:
PSUs witnessing a smart recovery after a dull decade
Nifty Index
CAGR:FY14-24
Nifty Index: 12.8%
PSU Index: 11.1%
7,608
7,738
6,107
9,174
8,597
10,114
11,624
14,691
8,598
6,704
8,607
9,497
BSE PSU Index
22,327
17,465
17,360
18,275
21,572
23,558
6,355
6,704
8,491
7,861
7,640
4,460
FY25YTD
Nifty Index: 5.5%
PSU Index: 18%
Exhibit 3:
BSE PSU’s market cap remained nearly flat during FY09-20, while it surged 6.1x in the last four years (since Mar’20)
BSE PSU Index Market Cap (INR t)
80
60
40
Flat returns between FY09-20
20
0
69
3
10
11
Exhibit 4:
PSU’s share in the Indian market cap exhibiting an uptick from the FY22 lows
Indian market cap (INRt)
34
31
26
22
26
31
28
31
29
25
PSU’s share in the Indian market cap
21
19
16
18
17
15
13
110
11
199
11
260
13
254
17
18
12
17
30
36
52
31
62
62
56
59
69
94
90
115
137
146
389
440
Exhibit 5:
PSUs’ corporate earnings expanded faster than that of the Private sector in Phase 2
CAGR:FY14-19
Private: 9.8%
PSU: -3.4%
3,503
1,272
PVT
PSU
9,710
CAGR:FY19-24
Private: 18.6%
PSU: 33.8%
4,134
1,287
4,620
3,190
2,214
1,169
3,384
7,058
7,630
5,513
3,805
2,586
1,532
2,678
1,401
2,919
983
3,493
805
June 2024
3
 Motilal Oswal Financial Services
India Strategy | Indian PSUs
Exhibit 6:
PSU’s market-cap-to-GDP trend at a 13-year high
PSU Mkt Cap / GDP (%)
27
21
15
16
18
17
19
27
25
22
15
13
14
11
13
13
11
7
11
12
13
Exhibit 7:
Profit mix between Private and Public sectors – PSU’s regaining share!
PVT
25.2
26.6
18.7
23.7
PSU
26.8
32.4
32.4
37.2
34.3
33.3
36.2
62.8
65.7
74.8
73.4
81.3
76.3
73.2
67.6
67.6
66.7
63.8
Exhibit 8:
Loss pools of PSUs witnessing continuous reduction from the FY18 highs
Losses reported by PSUs (INRb)
45
28
16
4
5
4
1
3
1
31
PSUs loss as a % of PSUs profit pool
29
71
FY14
79
FY15
374
FY16
246
FY17
651
FY18
579
FY19
475
FY20
104
FY21
36
FY22
109
FY23
59
FY24
Exhibit 9:
PSU companies – FII vs. DII holding trend (%): Institutions’ holding in PSUs have remained constant since past few
quarters
16.8
16.3
16.0
12.1
11.5
11.8
11.4
10.4
10.2
10.8
FII (%)
16.7
16.4
16.1
16.2
15.9
10.9
10.8
11.2 11.2
DII (%)
16.4
16.4
15.8
11.5
16.8
16.2
15.5
10.0
9.6
10.4
9.9
15.6
15.6
16.0
15.4
15.5
14.5
9.8
10.1
9.7
9.9
June 2024
4
 Motilal Oswal Financial Services
India Strategy | Indian PSUs
Two-thirds of the PSU Universe
have generated 5-7 years of
positive returns
No. of years of positive returns
Key insights from the report
28
25
21
10
4 3
8
4 5
1
1
0 1 2 3 4 5 6 7 8 9 10
Decoding Indian PSUs:
In this report, we analyze Indian PSUs’ journey over the
past decade as well as their future prospects. We have selected all the listed
PSUs for analysis purpose. Further, to account for future earnings growth, we
have taken our MOFSL PSU Coverage as a proxy, which constitutes 55% of the
overall listed PSU Universe.
Market cap scorecard:
PSUs’ share in India’s market cap dropped significantly to
10.5% in FY22 from 20.8% in FY14, but has since recovered and currently stands at
17.5%. Over a similar period, India’s market cap skyrocketed to INR389t in FY24
from INR69t in FY14 and currently it stands at INR440t. During FY14-24, PSUs’
market cap surged to INR66t (INR77t as of Jun’24) from INR14t, while the private
sector’s market cap catapulted to INR323t (INR363t as of Jun’24) from INR55t.
The tale of “sweet and sour” returns:
Around two-thirds of the listed PSU
companies have clocked 5-7 years of positive returns since FY14. The positive
breadth improved and stood at 95% in FY24, after a weakened trend during
FY18-FY20. Of the top 25 stocks, 13 belong to the BFSI space.
Volatilities in PSU banks hurt PSU profits over FY14-24:
Most of the Indian PSUs
operate in deep-cyclical industries (e.g., Metals, O&G, and Financials), which
inherently results in volatile and cyclical profitability and market capitalization
performance. A major part of the FY14-24 decade was spent cleaning up the
balance sheets of Financials, which took its toll on the overall PSU profits as PSU
Banks formed one-third of the profit pool of Indian PSUs. This, along with many
other macro disruptions, kept the PSU profit pool suppressed over FY14-20.
PSU banks compensated in the second half:
The second half performance was
fueled by a sharp 4.3x surge in PSU profits to reach INR5.5t from INR1.3t over
FY19-24. About 68% of these incremental profits came from BFSI alone, while
Oil & Gas and Metals contributed 21% and 5%, respectively. Profits of PSU Banks
surged to INR1.6t in FY24 vs. a reported loss of INR0.3t in FY19. The ROE of
Indian PSUs improved notably to 17.6% in FY24 from a mere 7.7% in FY19.
Expect healthy earnings ahead:
For our MOFSL Coverage Universe of PSU stocks
(~55% of Indian PSU Mcap), we estimate that the FY24-26 PAT CAGR is likely to
moderate to 6%, mainly due to conservative margin assumptions for O&G.
Conversely, the earnings growth for other sectors continues to remain strong. Ex
O&G, we estimate a PAT CAGR of 15% for MOFSL Coverage PSU Universe. For
the said Universe, incremental profits would be contributed by BFSI (120%),
followed by Metals (22%). O&G is likely to drag the earnings CAGR with an
adverse contribution of -47% to overall profitability.
Valuations – Continuous re-rating trends seen across PSUs:
The BSE PSU index
experienced continued valuation expansion and is trading at 12.8x 12-month
forward P/E and 2x 12-month forward P/B as of Jun’24, up 112% and 187% from
the FY20 lows, respectively. Given the continued earnings momentum and
guidance, we believe the valuation premiums for PSUs are expected to sustain in
the near term.
June 2024
5
 Motilal Oswal Financial Services
India Strategy | Indian PSUs
Market cap witnesses continuous gains with sharp rerating trends
PSUs’ share in India’s market cap dropped significantly to 10.5% in FY22 from
20.8% in FY14, but has recovered since then and currently stands at 17.5%. Over a
similar period, India’s market cap skyrocketed to INR389t in FY24 from INR69t in
FY14 and currently stands at INR440t. During FY14-24, PSUs’ market cap surged to
INR66t (INR77t as of Jun’24) from INR14t, while the private sector’s market cap
catapulted to INR323t (INR363t as of Jun’24) from INR55t.
Among the top 20 PSUs by market cap, IOB, Bharat Electronics, Union Bank and
PFC were the top ‘rank gainers’ during the past 10 years, while BPCL, Coal India,
GAIL, and ONGC were the top losers.
In the last one year, REC, IRFC, PFC, and Hindustan Aeronautics were the top
rank gainers, while BPCL, SBI Life Insurance, BOB, and Canara Bank were the top
losers, among the top 20 PSU stocks by market cap.
As profitability has improved, valuations of the PSU companies have also
experienced steady expansion in the past one year. They have been trading at a
five-year high level.
Exhibit 10:
PSU’s share in the Indian market cap sees continuous gains
Indian market cap (INRt)
34
31
26
22
26
31
28
31
29
25
PSU’s share in the Indian market cap
21
19
16
18
17
15
13
11
11
13
17
18
12
17
30
36
52
31
62
62
56
59
69
94
90
115
137
146
110
199
260
254
389
440
Exhibit 11:
Top-20 stock – market cap rank change
Company Name
St Bk of India
Life Insurance
Hind. Aeronautics
NTPC
ONGC
Power Grid Corpn
Coal India
IOCL
Bharat Electron
IRFC
Power Fin. Corpn.
Bank of Baroda
SBI Life Insuran
GAIL (India)
Punjab Natl.Bank
REC Ltd
BPCL
IOB
Union Bank (I)
Canara Bank
Mkt Cap (INRb)
2014 2019 2020 2021 2022 2023
1,432 2,863 1,758 3,252 4,403 4,674
3,382
237
178
333
497
913
989 1,339 833 1,032 1,309 1,699
2,727 2,007 859 1,285 2,062 1,900
550 1,036 832 1,128 1,513 1,574
1,818 1,459 863
804 1,128 1,317
677 1,532 769
864 1,120 1,101
92
227
181
305
514
713
300
280
348
255
325
243
300
297
401
310
341
247
383
577
873
580
641
881 1,121 1,101
477
783
345
602
691
692
269
439
218
384
386
514
226
302
175
259
243
304
333
860
686
928
779
746
63
132
117
263
344
426
86
168
98
218
265
454
122
220
93
251
413
516
2024 Jun'24
6,717 7,538
5,785 6,680
2,225 3,701
3,258 3,586
3,370 3,469
2,577 3,085
2,673 3,013
2,369 2,395
1,473 2,326
1,861 2,296
1,288 1,675
1,366 1,485
1,500 1,476
1,191 1,461
1,369 1,415
1,187 1,390
1,307 1,369
1,134 1,260
1,171 1,123
1,054 1,105
Rank in PSU Universe
2014 2019 2020 2021 2022 2023 2024 June'24
3
1
1
1
1
1
1
1
2
2
2
25
24
21
14
9
8
3
4
5
4
4
4
4
4
4
1
2
3
2
2
3
3
5
7
6
5
3
3
5
6
6
2
4
2
9
5
6
5
7
5
3
6
8
7
8
7
8
27
26
23
23
13
12
11
9
25
26
25
9
10
15
16
16
24
24
22
15
11
11
15
14
14
12
10
13
12
9
8
6
6
7
10
13
9
8
10
10
10
14
16
14
14
10
17
13
20
16
12
15
16
20
25
28
31
32
17
16
10
7
7
5
9
11
14
17
36
34
29
27
23
20
19
18
29
31
31
33
28
19
18
19
20
28
34
30
17
15
20
20
June 2024
6
 Motilal Oswal Financial Services
India Strategy | Indian PSUs
The tale of “sweet and sour” returns
Around two-thirds of listed PSU companies have clocked 5-7 years of positive
returns since FY14.
The positive breadth improved and stood at 95% in FY24, after a weakened
trend during FY18-FY20.
Of the top 25 stocks, 13 belong to the BFSI space. Over FY14-24, one stock (IGL)
delivered nine years of positive returns. In addition, five stocks (GAIL, Gujarat
State Petronet, Petronet LNG, GIC Housing Fin, and Elnet Technologies)
delivered eight years of positive returns over the said period.
About 52% of the listed PSU stocks outperformed the BSE PSU index in FY24,
with 55 of 110 listed PSUs more than doubled during the year. Notably, only five
stocks reported negative returns in FY24.
Exhibit 12: Two-thirds of the PSU Universe have generated 5-7 years of positive returns
28
25
21
10
4
1
0
1
3
2
3
8
4
5
1
4
5
6
7
8
9
10
Number of years of positive return
Exhibit 13: % of stocks delivering positive returns
Positive breadth (%)
94
77
96
95
63
45
37
40
41
11
FY20
FY21
FY22
56
FY14
FY15
FY16
FY17
FY18
FY19
FY23
FY24
June 2024
7
 Motilal Oswal Financial Services
India Strategy | Indian PSUs
Exhibit 14:
Trends in top-25 PSU sectoral performance (%) — 13 of the top 25 stocks belong to the BFSI space
Company
SBI
LIC of India
ONGC
NTPC
Coal India
Power Grid Corp.
IOCL
Hind.Aeronautics
IRFC
SBI Life Ins.
Bharat Elect.
PNB
BOB
BPCL
PFC
GAIL
REC
Union Bk
IOB
Canara Bk
NHPC
IDBI Bk
BHEL
IRCTC
Indian Bk
BSE PSU Index
Nifty-50
FY14
-7
2
-16
-7
-1
-1
FY15
39
-4
23
26
38
32
FY16
-27
-30
-13
-19
-4
7
FY17
51
29
29
0
42
97
Price Performance YoY (%)
FY18
FY19
FY20
-15
28
-39
-4
2
-3
-2
-9
-10
-4
-16
2
-8
-37
-14
-34
0
-9
-7
43
6
22
1
-16
10
-10
-35
-8
-7
-3
15
-57
-38
-41
-20
-50
-25
11
-20
-66
-58
-20
-25
-56
-42
-70
-51
-69
-19
-59
-72
-85
-42
-26
FY21
85
50
26
-7
36
12
87
37
68
13
38
35
23
77
48
18
126
68
23
100
134
79
170
50
71
FY22
35
60
27
40
34
30
49
-7
27
69
-4
51
-16
-1
15
-6
14
14
49
14
11
1
121
32
28
19
FY23
6
-8
30
17
4
-2
84
24
-2
39
33
51
-4
35
1
25
72
24
25
45
5
42
-26
87
10
-1
FY24
44
71
77
92
103
64
115
144
435
36
107
166
57
75
221
72
290
131
166
104
123
80
252
62
81
92
29
MCap
(INR b)
6,717
5,785
3,370
3,258
2,673
2,577
2,369
2,225
1,861
1,500
1,473
1,369
1,366
1,307
1,288
1,191
1,187
1,171
1,134
1,054
900
870
861
744
701
58,661
0
4
6
22
7
18
10
-37
-22
-31
-4
-18
11
-34
-2
18
192
-3
13
76
41
3
45
14
-17
39
4
9
19
50
20
27
9
-41
-10
11
-37
-8
-50
-16
-28
-48
21
-2
-52
-39
-20
-9
28
78
18
44
70
41
118
19
-12
64
33
8
43
167
41
19
0
-37
-18
-1
-41
16
-31
-40
-36
-13
-14
-4
-25
7
-9
10
Exhibit 15:
Top-25 PSU stocks – FY24 performance (%)
435
333
332 316
296 291 290 281 269 266 265
260 252 236 229
221 216 206 195
183 181 181 173 172 171
92
June 2024
8
 Motilal Oswal Financial Services
India Strategy | Indian PSUs
PAT CAGR (%) over FY14-19 Phase
BFSI
Utilities
Capital Goods
11.0 9.2
Oil & Gas
Metals
Total PSU
Analyzing PSUs’ profit pool during 2014-24
1.5
-2.8 -3.4
PL
FY14-19
After a muted performance over FY14-20, when the earnings CAGR of the listed
universe stood at 0.9% and absolute profits expanded to INR4.4t in FY20 (vs.
INR4.1t in FY14), corporate earnings have accelerated sharply and posted a 37%
CAGR over FY20-24 to reach INR15.2t in FY24 from a mere INR4.4t in FY20.
Notably, the listed PSU Universe reported a 4.4% decline over FY14-20 and its
profits contracted to INR1.2t in FY20 from INR1.5t in FY14. However, the PSUs have
posted a strong 47% profit CAGR over FY20-24 to reach INR5.5t in FY24 as against
Private Sector Universe CAGR of 32% to reach INR9.7t in FY24.
BFSI’s contribution to the PSU profit pool in FY23 was 54%, which moderated to
48% in FY24. The same hovered ~35% over the last few years. However, O&G’s
contribution jumped sharply to 31% in FY24 from 20% in FY23. Further, Utilities’
share dipped to a new low of 8% in FY24.
We note that there were two distinct phases of growth: a)
Phase 1 (FY14-19),
which clocked a muted PAT CAGR; and
Phase 2 (FY19-24),
which reported a
higher PAT CAGR.
PAT CAGR (%) over FY19-24 Phase
BFSI
Utilities
Capital Goods
LP
33.8
Oil & Gas
Metals
Total PSU
A tale of two distinct phases of growth
Phase 1 (2014-19): The period of moderation…
During this five-year period, corporate profits grew at a slower pace due to
multiple macroeconomic headwinds and high interest rates.
Listed Universe profit registered a 5.7% CAGR during Phase 1, primarily fueled
by Technology and O&G sectors.
PSU Universe profit declined 3.4% during Phase 1 led by BFSI, and Capital Goods
sectors. BFSI recorded a loss of INR189b in FY19 vs. a profit of INR527b in FY14
due to asset quality clean-up, and steep reduction in its share in the PSU profit
pool to -15% in FY19 from 34% in FY14.
Further, Capital Goods weakened notably (posting a 2.8% compounded decline).
Notably, O&G and Utilities’ contributions to PSU profit pool surged to 62% and
25% in FY19 from 31% and 13% in FY14, respectively.
Phase 2 (2019-24): …followed by resurgence
Over this period, corporate profit growth across sectors bounced back smartly,
propelled by tax rate cuts, a reduction in banking sector NPAs, and post-Covid
tailwinds after a weak two-year base.
Listed Universe profit posted a stronger 22.9% CAGR in Phase 2 to reach INR15.2t.
The listed PSU Universe recorded a stronger profit CAGR of 33.8% during Phase
2 to reach INR5.5t in FY24 vs. 18.6% CAGR of the Private sector, reaching
INR9.7t in FY24.
Financials continued to drive PSU profit growth followed by Oil & Gas, and
Metals. BFSI continued to witness strong profit growth, contributing 48% to the
overall PSU Universe profit in FY24.
O&G recorded a decent growth, with its earnings recording a 16.4% CAGR over
FY19-24, and its share in the profit pool contribution expanding considerably to
31% in FY24 from a low of 20% in FY23.
During
FY24,
PSUs have continued to report strong earnings growth of 45% YoY,
surpassing the Private sector earnings growth of 27%.
16.4
12.2
6.7
15.3
FY19-24
June 2024
9
 Motilal Oswal Financial Services
India Strategy | Indian PSUs
PSUs out of the woods | Loss pools melt away
The BSE PSU index performance remained relatively muted during Phase 1 (FY14-
19), reporting a 3.8% CAGR and underperforming Nifty (11.6%) over the same
period.
During Phase 2 (FY19-24), the BSE PSU Index performance was better than Nifty
with 19.1% CAGR (vs. 13.9% of Nifty).
However, PSUs’ profits (at 33.8% CAGR) recovered sharply and outperformed
those of the Private Sector (at 18.6% CAGR) over the last five years (FY19-24).
PSUs’ losses that had spiked by FY18 have consistently narrowed over the last
four years:
The contribution of loss-making companies (reduced to 1% of profit
pool in FY24 as against 45% in FY18).
PSUs loss as a % of PSUs profit pool
Exhibit 16:
Loss pools of PSUs that spiked during FY15-18, have consistently reduced over the last four years
Losses reported by PSUs (INRb)
45
28
16
4
71
FY14
5
79
FY15
374
FY16
246
FY17
651
FY18
579
FY19
475
FY20
4
104
FY21
31
29
1
36
FY22
3
109
FY23
1
59
FY24
Exhibit 17:
PSU’s PAT jumped 4.3x vs. 2.4x gain in the PSU index during FY19-24
PSU PAT (INRb)
BSE PSU Index
18,275
FY14-24:
PAT grew by
14% Vs. 11% gain of
PSU Index
7,608
6,107
1,401
FY15
983
FY16
1,272
FY17
805
FY18
8,597
7,861
8,607
7,640
4,460
1,532
FY14
1,287
1,169
FY19
FY20
FY21
FY22
FY23
FY24
2,214
6,704
3,384
3,805
9,497
5,513
6,355
Exhibit 18:
PSUs’ corporate earnings expanded faster than that of the Private sector in
Phase 2
PVT
PSU
CAGR:FY19-24
Private: 18.6%
PSU: 33.8%
4,134
4,620
9,710
7,058
7,630
5,513
2,919
983
3,503
1,272
3,493
805
PAT of PSU
corporates surged
4.3x over FY19-24,
clocking a CAGR of
33.8% vs. Private
Sector CAGR of
18.6%
CAGR:FY14-19
Private: 9.8%
PSU: -3.4%
2,586
2,678
1,401
3,190
2,214
1,287
1,169
3,384
3,805
1,532
June 2024
10
 Motilal Oswal Financial Services
India Strategy | Indian PSUs
Exhibit 19:
PSU Universe profit declined 3.4% during Phase 1 due to BFSI, and Capital Goods sectors
323
113
24
19
2
10
Profit to Loss
(716)
1,532
1,287
FY14
PAT (INRb)
Oil & Gas
Utilities
Rest
Metals
Telecom
Capital Goods
BFSI
FY19
PAT (INRb)
Exhibit 20:
PSU Universe reported a stronger growth during Phase 2; BFSI drove profit growth of PSUs followed by Oil & Gas,
and Metals
899
210
122
70
69
4
Loss to Profit
5,513
1,287
FY19
PAT (INRb)
BFSI
Oil & Gas
Metals
Utilities
Rest
Capital Goods
Telecom
FY24
PAT (INRb)
Exhibit 21:
PSU Universe profit jumped in FY24 fueled by O&G, BFSI, and Metals sectors
927
629
102
37
31
5
14
5,513
3,805
FY23
PAT (INRb)
Oil & Gas
BFSI
Metals
Utilities
Capital Goods
Telecom
Rest
FY24
PAT (INRb)
Exhibit 22:
Profit mix between Private and Public sectors – PSU’s regaining share!
PVT
25.2
26.6
18.7
23.7
PSU
26.8
37.2
34.3
32.4
32.4
33.3
36.2
62.8
65.7
74.8
73.4
81.3
76.3
73.2
67.6
67.6
66.7
63.8
June 2024
11
 Motilal Oswal Financial Services
India Strategy | Indian PSUs
Exhibit 23:
Trend in RoE of the PSU Universe (%) – Seeing continuous recovery from the FY18 lows
PSU RoE (%)
17.6
14.8
14.7
10.9
12.0
10.3
6.8
5.2
8.8
7.7
6.7
FY14
FY15
FY16
FY17
FY18
FY19
FY20
FY21
FY22
FY23
FY24
Exhibit 24:
BFSI and Oil & Gas’ profits expanded at a faster pace in the last five years (INR b)
FY19
FY24
5,513
2,672
4.3x
1,691
792
317
438
272
482
Loss to
profit
2.0x
67
136
1,287
-189
BFSI
2.1x
Oil & Gas
1.4x
Utilities
1.8x
Metals
Capital Goods
Total PSU
Exhibit 25:
BFSI’s contribution to PSU profit moderated in
FY24, after scaling highs in FY23
34
39
8
7
BFSI
8
54
34
35
48
Exhibit 26:
O&G’s contribution to PSU profit pool recovered
in FY24, after hitting lows in FY23
93
58
62
43
35
36
31
Oil & Gas
51
-15
-45
31
25
20
Exhibit 27:
Utilities’ contribution to PSU profit pool at a new
low
Utilities
27
21
13
15
21
25
23
16
11
11
8
Exhibit 28:
Metals’ contribution to PSU profit pool at a new
low as well
Metals
21
16
17
14
9
15
12
20
13
10
9
June 2024
12
 Motilal Oswal Financial Services
India Strategy | Indian PSUs
Exhibit 29:
Capital Goods’ contribution to PSU profit pool
continues to be low
Capital Goods
6
5
4
4
4
5
4
3
2
3
Exhibit 30:
Telecom has been a negative contributor to PSU’s
profit pool
Telecom
-1
2
-2
-2
-1
-1
-1
-2
-2
-2
-3
-3
Exhibit 31:
Top 25 PSU stocks – PAT CAGR over FY14-19 (%)
PAT CAGR FY14-19 (%)
33
32
26
24
19
15
15
13
11
10
8
8
6
4
4
3
-3
-22
-25 -26
-32 -212
-222
-245
PL
Exhibit 32:
Top 25 PSU stocks – PAT CAGR over FY19-24 (%)
LP
LP
PAT CAGR FY19-24 (%)
LP
LP
103 91
77
73
32
28
27
23
20
19
18
16
16
15
10
9
9
8
8
7
-22
Sharp recovery in PSBs’ profitability supports PSU revival from the lows
PSBs have experienced a remarkable turnaround, from reporting record losses
to posting record profits, as their aggregate earnings surpassed the ~INR1.2t
mark in FY24. The strong earnings recovery is attributed to steady credit growth,
significant improvements in asset quality, and stable to positive margins.
The steady recovery in PSBs’ profitability during the past three years led to a
significant rerating of the underlying stocks within the coverage universe and
also drove PSU index outperformance.
June 2024
13
 Motilal Oswal Financial Services
India Strategy | Indian PSUs
The aggregate market cap of PSBs has surged in recent years, up ~5x since FY20
at ~INR17t.
Further, with the sharp revival in PSBs’ profitability, the aggregate contribution
of BFSI to PSU profits recovered to 54% in FY23 from the lows of -45% in FY18.
We estimate the earnings momentum to continue and the PSBs to register a
CAGR of 18% over FY24-26, thereby reaching INR1.7t by FY26. Please refer to
our
recent note on PSBs.
Exhibit 33:
PSU bank index has generated 68% returns in FY24 (Apr’23- Mar’24) vs. 8% for
the Private bank index over the same period
Nifty PSU Bank
Nifty Private Banks
68%
36%
23%
12%
2%
FY22
FY23
8%
5%
2%
FY24
Apr-Jun'24
Source: MOFSL, Company
Exhibit 34:
PSBs’ market cap contribution
to the total banking sector has increased to FY14 levels
Market Cap (INR b)
PSBs
Pvt Banks
Total
Share in M. Cap
PSBs
Pvt Banks
Total
FY13
2,672
4,540
7,212
FY13
37%
63%
100%
FY14
2,671
5,333
8,004
FY14
33%
67%
100%
FY15
3,392
8,029
11,421
FY15
30%
70%
100%
FY16
2,611
7,910
10,521
FY16
25%
75%
100%
FY17
3,996
10,622
14,617
FY17
27%
73%
100%
FY18
3,521
13,581
17,102
FY18
21%
79%
100%
FY19
4,720
17,429
22,149
FY19
21%
79%
100%
FY20
2,918
12,070
14,988
FY20
19%
81%
100%
FY21
5,511
21,354
26,864
FY21
21%
79%
100%
FY22
7,457
22,305
29,763
FY22
25%
75%
100%
FY23
9,227
24,851
34,078
FY23
27%
73%
100%
FY24
17,143
29,847
46,990
FY24
36%
64%
100%
Exhibit 35:
PSBs to report ~18% earnings CAGR over FY24-26E
Earnings of PSBs improved
significantly to INR1.2t in
FY24 from INR110b in FY20
336
268
283
40
(2)
(295) (110)
Top 6 PSB's Earnings (INRb)
1,478
1,234
912
573
110
317
1,712
FY13 FY14 FY15 FY16 FY17 FY18 FY19 FY20 FY21 FY22 FY23 FY24 FY25E FY26E
Calculated based on six PSBs under our coverage
Source: MOFSL, Company
June 2024
14
 Motilal Oswal Financial Services
India Strategy | Indian PSUs
Earnings outlook continues to remain healthy
Fundamentally, India is witnessing its own mini-Goldilocks moment with
excellent macros (GDP growth of 8.2% in FY24 on the back of ~7% growth in
FY23, inflation at ~5%, both current account and fiscal deficits well within
tolerance band, stable currency, etc.), robust corporate earnings (Nifty ended
FY24 with 25% earnings growth and FY25/26 earnings are likely to post 14-15%
CAGR), focus on manufacturing, capex and infrastructure creation, and
valuations at ~20x one-year forward earnings.
The political stability with Modi 3.0 augurs well for the economy and capital
markets as it provides the necessary stability and continuity in policy-making
which will likely continue pushing its economic agenda.
This verdict and the consequent political stability and continuity in policy-
making will act like an icing on the cake and keep India as the cynosure of all
eyes, in our view.
For our MOFSL Coverage PSU Universe (~55% of Indian PSU Mcap), we estimate
that the FY24-26 PAT CAGR is likely to moderate to 6%, mainly due to
conservative margin assumptions for O&G. Conversely, the earnings growth for
other sectors continues to remain strong. Ex O&G, we estimate a PAT CAGR of
15% for MOFSL Coverage PSU Universe. For the said Universe, incremental
profits would be contributed by BFSI (120%), followed by Metals (22%). O&G is
likely to drag the earnings CAGR with an adverse contribution of -47% to overall
profitability.
Exhibit 36: Expect FY24-26 earnings growth to moderate mainly due to O&G, while other
sectors to remain strong
Conservative margin
assumption for O&G to
moderate earnings growth
over FY24-26
6.2
31.2
21.8
15.3
16.0
11.5
PSU
PSU ex O&G
Logistics
Capital Goods
BFSI
Metals
-7.3
Oil & Gas
Exhibit 37:
MOFSL Coverage PSU stocks – PAT growth for FY24 (%)
LP 1,272
345
229
70 65 65 62
60
53 45 37 36 36 34 26
21
21 18 18 16 16
12
10
9
7
6
-28 -44
June 2024
15
 Motilal Oswal Financial Services
India Strategy | Indian PSUs
Exhibit 38:
MOFSL Coverage PSU stocks – PAT CAGR over FY24-26E (%)
128
44
31
29 23 22 22 21 20
18 15 15 14 11 10
8
7
6
6
4
4
4
3
-9 -19 -20
-25 -27 -33
Valuation: Continuous rerating trends seen across PSUs
Strong earnings pickup with underlying RoE expansion, healthy macros, policy
tailwinds and an optimistic management outlook led to the sharp valuation
expansion for PSUs over the past few years.
The BSE PSU index that had seen a sharp de-rating in the first half of the previous
decade, has subsequently experienced a sharp re-rating in the past three years.
The BSE PSU index experienced continued valuation expansion and is trading at
12.8x 12-month forward P/E and 2x 12-month forward P/B as of Jun’24, up 112%
and 187% from FY20 lows, respectively.
Given the continued earnings momentum and guidance, we believe the valuation
premiums for PSUs are expected to sustain in the near term. However, due to
the multi-year high valuation and sharp run-up in select PSU stocks, earnings
guidance vs. delivery would be the key monitorable.
Exhibit 39: 12-month forward P/E (x)
Nifty PE (x)
29
23
17
12.8
11
5
Nifty Avg: 20.3x
PSU Avg: 9.8x
19.8
BSE PSU Index PE (x)
June 2024
16
 Motilal Oswal Financial Services
India Strategy | Indian PSUs
Exhibit 40: Trend in P/E discount to the benchmark (%)
-30
-40
-50
-60
-70
Average: -51%
PSU Vs Nifty PE Prem/(Disc) (%)
-36
Exhibit 41: 12-month forward P/B (x)
3.5
2.8
2.0
Nifty PB (x)
Nifty Avg: 2.8x
PSU Avg: 1.3x
BSE PSU Index PB (x)
3.2
2.0
1.3
0.5
Exhibit 42: Trend in P/B discount to the benchmark (%)
-30
-40
-50
Average: -54%
PSU Vs Nifty PB Prem/(Disc) (%)
-37
-60
-70
Investment in securities market are subject to market risks. Read all the related documents carefully before investing
June 2024
17
 Motilal Oswal Financial Services
India Strategy | Indian PSUs
Research Gallery
June 2024
18
 Motilal Oswal Financial Services
India Strategy | Indian PSUs
Explanation of Investment Rating
Investment Rating
BUY
SELL
NEUTRAL
UNDER REVIEW
NOT RATED
Expected return (over 12-month)
>=15%
< - 10%
< - 10 % to 15%
Rating may undergo a change
We have forward looking estimates for the stock but we refrain from assigning recommendation
*In case the recommendation given by the Research Analyst is inconsistent with the investment rating legend for a continuous period of 30 days, the Research Analyst shall be within following 30 days take
appropriate measures to make the recommendation consistent with the investment rating legend.
Disclosures
The following Disclosures are being made in compliance with the SEBI Research Analyst Regulations 2014 (herein after referred to as the Regulations).
Motilal Oswal Financial Services Ltd. (MOFSL) is a SEBI Registered Research Analyst having registration no. INH000000412. MOFSL, the Research Entity (RE) as defined in the Regulations, is engaged in
the business of providing Stock broking services, Depository participant services & distribution of various financial products. MOFSL is a listed public company, the details in respect of which are available on
www.motilaloswal.com.
MOFSL (erstwhile Motilal Oswal Securities Limited - MOSL) is registered with the Securities & Exchange Board of India (SEBI) and is a registered Trading Member with National
Stock Exchange of India Ltd. (NSE) and Bombay Stock Exchange Limited (BSE), Multi Commodity Exchange of India Limited (MCX) and National Commodity & Derivatives Exchange Limited (NCDEX) for
its stock broking activities & is Depository participant with Central Depository Services Limited (CDSL) National Securities Depository Limited (NSDL),NERL, COMRIS and CCRL and is member of
Association of Mutual Funds of India (AMFI) for distribution of financial products and Insurance Regulatory & Development Authority of India (IRDA) as Corporate Agent for insurance products.
Details of
associate entities of Motilal Oswal Financial Services Limited are available on the website at
http://onlinereports.motilaloswal.com/Dormant/documents/List%20of%20Associate%20companies.pdf
MOFSL and its associate company(ies), their directors and Research Analyst and their relatives may; (a) from time to time, have a long or short position in, act as principal in, and buy or sell the securities or
derivatives thereof of companies mentioned herein. (b) be engaged in any other transaction involving such securities and earn brokerage or other compensation or act as a market maker in the financial
instruments of the company(ies) discussed herein or act as an advisor or lender/borrower to such company(ies) or may have any other potential conflict of interests with respect to any recommendation and
other related information and opinions.; however the same shall have no bearing whatsoever on the specific recommendations made by the analyst(s), as the recommendations made by the analyst(s) are
completely independent of the views of the associates of MOFSL even though there might exist an inherent conflict of interest in some of the stocks mentioned in the research report.
MOFSL and / or its affiliates do and seek to do business including investment banking with companies covered in its research reports. As a result, the recipients of this report should be aware that MOFSL
may have a potential conflict of interest that may affect the objectivity of this report. Compensation of Research Analysts is not based on any specific merchant banking, investment banking or brokerage
service transactions. Details of pending Enquiry Proceedings of Motilal Oswal Financial Services Limited are available on the website at
https://galaxy.motilaloswal.com/ResearchAnalyst/PublishViewLitigation.aspx
A graph of daily closing prices of securities is available at
www.nseindia.com, www.bseindia.com.
Research Analyst views on Subject Company may vary based on Fundamental research and Technical
Research. Proprietary trading desk of MOFSL or its associates maintains arm’s length distance with Research Team as all the activities are segregated from MOFSL research activity and therefore it can
have an independent view with regards to Subject Company for which Research Team have expressed their views.
Regional Disclosures (outside India)
This report is not directed or intended for distribution to or use by any person or entity resident in a state, country or any jurisdiction, where such distribution, publication, availability or use would be contrary
to law, regulation or which would subject MOFSL & its group companies to registration or licensing requirements within such jurisdictions.
For Hong Kong:
This report is distributed in Hong Kong by Motilal Oswal capital Markets (Hong Kong) Private Limited, a licensed corporation (CE AYY-301) licensed and regulated by the Hong Kong Securities and Futures
Commission (SFC) pursuant to the Securities and Futures Ordinance (Chapter 571 of the Laws of Hong Kong) “SFO”. As per SEBI (Research Analyst Regulations) 2014 Motilal Oswal Securities (SEBI Reg.
No. INH000000412) has an agreement with Motilal Oswal capital Markets (Hong Kong) Private Limited for distribution of research report in Hong Kong. This report is intended for distribution only to
“Professional Investors” as defined in Part I of Schedule 1 to SFO. Any investment or investment activity to which this document relates is only available to professional investor and will be engaged only with
professional investors.” Nothing here is an offer or solicitation of these securities, products and services in any jurisdiction where their offer or sale is not qualified or exempt from registration. The Indian
Analyst(s) who compile this report is/are not located in Hong Kong & are not conducting Research Analysis in Hong Kong.
For U.S.
Motilal Oswal Financial Services Limited (MOFSL) is not a registered broker - dealer under the U.S. Securities Exchange Act of 1934, as amended (the"1934 act") and under applicable state laws in the
United States. In addition MOFSL is not a registered investment adviser under the U.S. Investment Advisers Act of 1940, as amended (the "Advisers Act" and together with the 1934 Act, the "Acts), and
under applicable state laws in the United States. Accordingly, in the absence of specific exemption under the Acts, any brokerage and investment services provided by MOFSL, including the products and
services described herein are not available to or intended for U.S. persons. This report is intended for distribution only to "Major Institutional Investors" as defined by Rule 15a-6(b)(4) of the Exchange Act
and interpretations thereof by SEC (henceforth referred to as "major institutional investors"). This document must not be acted on or relied on by persons who are not major institutional investors. Any
investment or investment activity to which this document relates is only available to major institutional investors and will be engaged in only with major institutional investors. In reliance on the exemption
from registration provided by Rule 15a-6 of the U.S. Securities Exchange Act of 1934, as amended (the "Exchange Act") and interpretations thereof by the U.S. Securities and Exchange Commission
("SEC") in order to conduct business with Institutional Investors based in the U.S., MOFSL has entered into a chaperoning agreement with a U.S. registered broker-dealer, Motilal Oswal Securities
International Private Limited. ("MOSIPL"). Any business interaction pursuant to this report will have to be executed within the provisions of this chaperoning agreement.
The Research Analysts contributing to the report may not be registered /qualified as research analyst with FINRA. Such research analyst may not be associated persons of the U.S. registered broker-dealer,
MOSIPL, and therefore, may not be subject to NASD rule 2711 and NYSE Rule 472 restrictions on communication with a subject company, public appearances and trading securities held by a research
analyst account.
For Singapore
In Singapore, this report is being distributed by Motilal Oswal Capital Markets (Singapore) Pte. Ltd. (“MOCMSPL”) (UEN 201129401Z), which is a holder of a capital markets services license and an exempt
financial adviser in Singapore.This report is distributed solely to persons who (a) qualify as “institutional investors” as defined in section 4A(1)(c) of the Securities and Futures Act of Singapore (“SFA”) or (b)
are considered "accredited investors" as defined in section 2(1) of the Financial Advisers Regulations of Singapore read with section 4A(1)(a) of the SFA. Accordingly, if a recipient is neither an “institutional
investor” nor an “accredited investor”, they must immediately discontinue any use of this Report and inform MOCMSPL .
In respect of any matter arising from or in connection with the research you could contact the following representatives of MOCMSPL. In case of grievances for any of the services rendered by MOCMSPL
write to
grievances@motilaloswal.com.
Nainesh Rajani
Email:
nainesh.rajani@motilaloswal.com
Contact: (+65) 8328 0276
.
Specific Disclosures
1 MOFSL, Research Analyst and/or his relatives does not have financial interest in the subject company, as they do not have equity holdings in the subject company.
2 MOFSL, Research Analyst and/or his relatives do not have actual/beneficial ownership of 1% or more securities in the subject company
3 MOFSL, Research Analyst and/or his relatives have not received compensation/other benefits from the subject company in the past 12 months
4 MOFSL, Research Analyst and/or his relatives do not have material conflict of interest in the subject company at the time of publication of research report
5 Research Analyst has not served as director/officer/employee in the subject company
6 MOFSL has not acted as a manager or co-manager of public offering of securities of the subject company in past 12 months
7 MOFSL has not received compensation for investment banking/ merchant banking/brokerage services from the subject company in the past 12 months
8 MOFSL has not received compensation for other than investment banking/merchant banking/brokerage services from the subject company in the past 12 months
9 MOFSL has not received any compensation or other benefits from third party in connection with the research report
10 MOFSL has not engaged in market making activity for the subject company
********************************************************************************************************************************
The associates of MOFSL may have:
-
financial interest in the subject company
-
actual/beneficial ownership of 1% or more securities in the subject company at the end of the month immediately preceding the date of publication of the Research Report or date of the public
appearance.
-
received compensation/other benefits from the subject company in the past 12 months
-
any other potential conflict of interests with respect to any recommendation and other related information and opinions.; however the same shall have no bearing whatsoever on the specific
recommendations made by the analyst(s), as the recommendations made by the analyst(s) are completely independent of the views of the associates of MOFSL even though there might exist an
inherent conflict of interest in some of the stocks mentioned in the research report.
-
acted as a manager or co-manager of public offering of securities of the subject company in past 12 months
June 2024
19
 Motilal Oswal Financial Services
India Strategy | Indian PSUs
-
-
-
be engaged in any other transaction involving such securities and earn brokerage or other compensation or act as a market maker in the financial instruments of the company(ies) discussed herein or
act as an advisor or lender/borrower to such company(ies)
received compensation from the subject company in the past 12 months for investment banking / merchant banking / brokerage services or from other than said services.
Served subject company as its clients during twelve months preceding the date of distribution of the research report.
The associates of MOFSL has not received any compensation or other benefits from third party in connection with the research report
Above disclosures include beneficial holdings lying in demat account of MOFSL which are opened for proprietary investments only. While calculating beneficial holdings, It does not consider demat accounts
which are opened in name of MOFSL for other purposes (i.e holding client securities, collaterals, error trades etc.). MOFSL also earns DP income from clients which are not considered in above disclosures.
Analyst Certification
The views expressed in this research report accurately reflect the personal views of the analyst(s) about the subject securities or issues, and no part of the compensation of the research analyst(s) was, is,
or will be directly or indirectly related to the specific recommendations and views expressed by research analyst(s) in this report.
Terms & Conditions:
This report has been prepared by MOFSL and is meant for sole use by the recipient and not for circulation. The report and information contained herein is strictly confidential and may not be altered in any
way, transmitted to, copied or distributed, in part or in whole, to any other person or to the media or reproduced in any form, without prior written consent of MOFSL. The report is based on the facts, figures
and information that are considered true, correct, reliable and accurate. The intent of this report is not recommendatory in nature. The information is obtained from publicly available media or other sources
believed to be reliable. Such information has not been independently verified and no guaranty, representation of warranty, express or implied, is made as to its accuracy, completeness or correctness. All
such information and opinions are subject to change without notice. The report is prepared solely for informational purpose and does not constitute an offer document or solicitation of offer to buy or sell or
subscribe for securities or other financial instruments for the clients. Though disseminated to all the customers simultaneously, not all customers may receive this report at the same time. MOFSL will not
treat recipients as customers by virtue of their receiving this report.
Disclaimer:
The report and information contained herein is strictly confidential and meant solely for the selected recipient and may not be altered in any way, transmitted to, copied or distributed, in part or in whole, to
any other person or to the media or reproduced in any form, without prior written consent. This report and information herein is solely for informational purpose and may not be used or considered as an
offer document or solicitation of offer to buy or sell or subscribe for securities or other financial instruments. Nothing in this report constitutes investment, legal, accounting and tax advice or a representation
that any investment or strategy is suitable or appropriate to your specific circumstances. The securities discussed and opinions expressed in this report may not be suitable for all investors, who must make
their own investment decisions, based on their own investment objectives, financial positions and needs of specific recipient. This may not be taken in substitution for the exercise of independent judgment
by any recipient. Each recipient of this document should make such investigations as it deems necessary to arrive at an independent evaluation of an investment in the securities of companies referred to in
this document (including the merits and risks involved), and should consult its own advisors to determine the merits and risks of such an investment. The investment discussed or views expressed may not
be suitable for all investors. Certain transactions -including those involving futures, options, another derivative products as well as non-investment grade securities - involve substantial risk and are not
suitable for all investors. No representation or warranty, express or implied, is made as to the accuracy, completeness or fairness of the information and opinions contained in this document. The Disclosures
of Interest Statement incorporated in this document is provided solely to enhance the transparency and should not be treated as endorsement of the views expressed in the report. This information is subject
to change without any prior notice. The Company reserves the right to make modifications and alternations to this statement as may be required from time to time without any prior approval. MOFSL, its
associates, their directors and the employees may from time to time, effect or have effected an own account transaction in, or deal as principal or agent in or for the securities mentioned in this document.
They may perform or seek to perform investment banking or other services for, or solicit investment banking or other business from, any company referred to in this report. Each of these entities functions as
a separate, distinct and independent of each other. The recipient should take this into account before interpreting the document. This report has been prepared on the basis of information that is already
available in publicly accessible media or developed through analysis of MOFSL. The views expressed are those of the analyst, and the Company may or may not subscribe to all the views expressed
therein. This document is being supplied to you solely for your information and may not be reproduced, redistributed or passed on, directly or indirectly, to any other person or published, copied, in whole or
in part, for any purpose. This report is not directed or intended for distribution to, or use by, any person or entity who is a citizen or resident of or located in any locality, state, country or other jurisdiction,
where such distribution, publication, availability or use would be contrary to law, regulation or which would subject MOFSL to any registration or licensing requirement within such jurisdiction. The securities
described herein may or may not be eligible for sale in all jurisdictions or to certain category of investors. Persons in whose possession this document may come are required to inform themselves of and to
observe such restriction. Neither the Firm, not its directors, employees, agents or representatives shall be liable for any damages whether direct or indirect, incidental, special or consequential including lost
revenue or lost profits that may arise from or in connection with the use of the information.
The person accessing this information specifically agrees to exempt MOFSL or any of its affiliates or employees
from, any and all responsibility/liability arising from such misuse and agrees not to hold MOFSL or any of its affiliates or employees responsible for any such misuse and further agrees to hold MOFSL or any
of its affiliates or employees free and harmless from all losses, costs, damages,
expenses that may be suffered by the person accessing this information due to any errors and delays.
This report is meant for the clients of Motilal Oswal only.
Investment in securities market are subject to market risks. Read all the related documents carefully before investing.
Registration granted by SEBI and certification from NISM in no way guarantee performance of the intermediary or provide any assurance of returns to investors.
Registered Office Address: Motilal Oswal Tower, Rahimtullah Sayani Road, Opposite Parel ST Depot, Prabhadevi, Mumbai-400025; Tel No.: 022 - 71934200 / 71934263; www.motilaloswal.com.
Correspondence Address: Palm Spring Centre, 2nd Floor, Palm Court Complex, New Link Road, Malad (West), Mumbai- 400 064. Tel No: 022 71881000. Details of Compliance Officer: Neeraj Agarwal,
Email Id: na@motilaloswal.com, Contact No.:022-40548085.
Grievance Redressal Cell:
Contact Person
Contact No.
Email ID
Ms. Hemangi Date
022 40548000 / 022 67490600
query@motilaloswal.com
Ms. Kumud Upadhyay
022 40548082
servicehead@motilaloswal.com
Mr. Ajay Menon
022 40548083
am@motilaloswal.com
Registration details of group entities.: Motilal Oswal Financial Services Ltd. (MOFSL): INZ000158836 (BSE/NSE/MCX/NCDEX); CDSL and NSDL: IN-DP-16-2015; Research Analyst: INH000000412 . AMFI:
ARN .: 146822. IRDA Corporate Agent – CA0579. Motilal Oswal Financial Services Ltd. is a distributor of Mutual Funds, PMS, Fixed Deposit, Insurance, Bond, NCDs and IPO products.
Customer having any query/feedback/ clarification may write to query@motilaloswal.com. In case of grievances for any of the services rendered by Motilal Oswal Financial Services Limited (MOFSL) write to
grievances@motilaloswal.com, for DP to dpgrievances@motilaloswal.com.
June 2024
20