August 2024
India Strategy
BSE Sensex: 79,649
Nifty-50: 24,347
Nifty-50 P/E dissection: Devil is in the details!
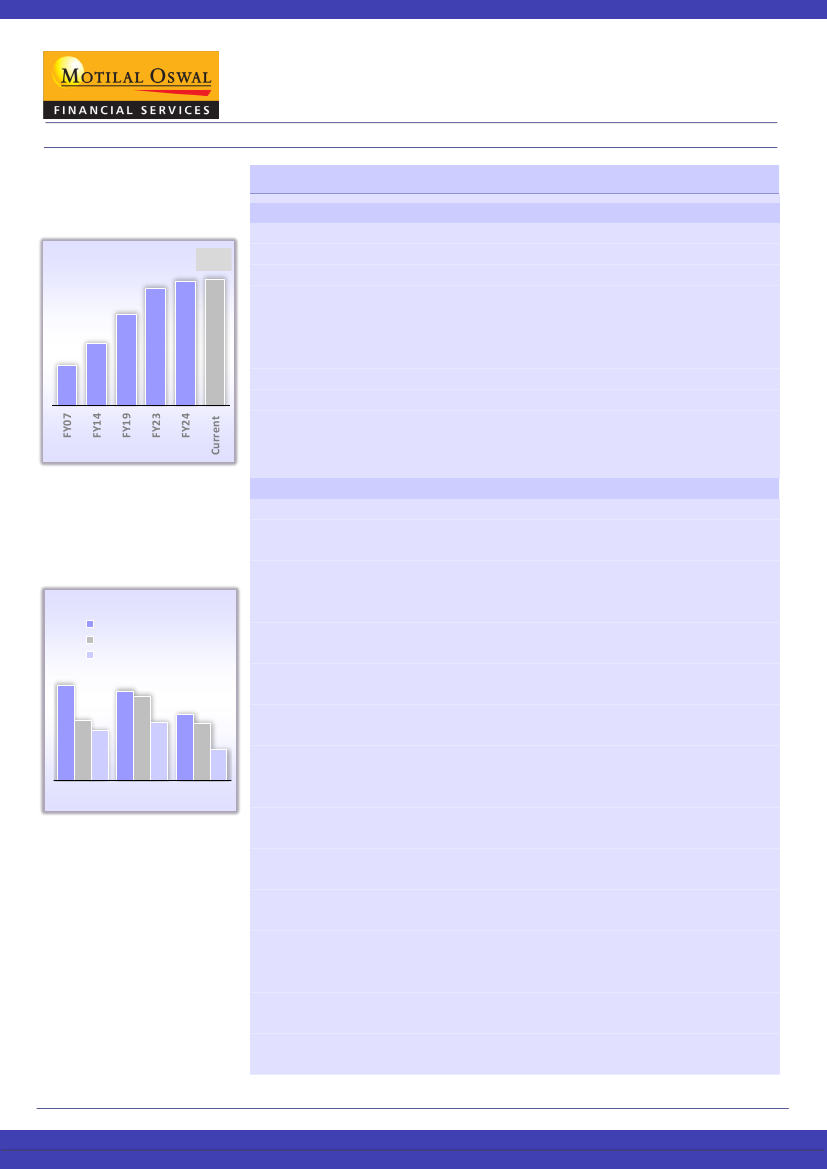
Nifty-50: 10-year rolling average
trailing P/E since FY07
Strong micro-macro dynamics – the base for premium P/E…
21.7
19.1
16.2
14.0
22.4
22.6
India commands premium valuation:
The Nifty-50 trades at 20.3x its one-year
forward earnings. Following the recent correction, it is fairly valued and within its
10-year forward average multiple of 20.4x. Compared to its EM peers, India has
been considered relatively expensive for a long period.
An anomaly in a data set
can be overlooked, but when consistent, it becomes the norm.
India enjoys its
premium valuations due to: 1) Nifty PAT, which has compounded by 25%/18%/
12% over the last 3/5/10 years; 2) a strong, continuous, and stable political setup,
with the victory of PM Narendra Modi/BJP (under NDA) for the third consecutive
term that provides policy continuity and reforms momentum, 3) a GDP growth
rate ranging between 6% and 7% during this period; and 4) healthy macros –
stable currency, twin deficits under control, peaking of interest rates, moderating
inflation print, and massive development of digital and physical infrastructure.
Re-rating and composition changes:
In FY07, the 10-year rolling average trailing
P/E was only 14.0x. It increased to 15.5x/19.1x/22.6x in FY12/FY19/Aug’24. The
re-rating has been consistent and incremental over 17+ years, in unison with the
growth potential of these stocks and earnings delivery. This trend has been
driven by the inclusion of high P/E names in retail, logistics, and consumer
sectors. Since FY07, the trailing P/E has nearly doubled for the Metals, Auto,
Technology, Oil & Gas, Cement, Telecom and Healthcare sectors. In contrast, it
has remained flat for the BFSI (ex-Insurance), Consumer, and Utility sectors.
Interestingly, as of FY14, only 14% of the stocks were trading above 30x trailing
P/E, but this figure has now surged to 50%!
Secular sectors (Pvt Banks + Consumer + Retail + Tech) have driven multiples
up between FY14 and FY19, but since then it has tapered off:
Between FY14
and FY23, the market cap contribution of secular sectors to Nifty-50 was 3
percentage points (p.p.) to 11 p.p. higher vs. its Nifty PAT contribution. However,
since FY20, the gap has been reducing. In FY24, the trends have nearly converged
as Private Banks, Consumer, and Technology stocks have underperformed. Their
earnings are likely to clock 13% CAGR over FY24-FY26E, while for the Nifty-50,
the CAGR is expected to be at 15% over the same period. Due to the higher
possibility of rate cuts by the Fed, an expected revival in consumer demand, the
emergence of AI-based themes, and a potential revival in IT spending towards
the end of CY24, the risk-reward dynamics appear in favor of it.
Nifty-50’s forward P/E in line with its LPA:
Within Nifty, the domestic and
global cyclicals trade at a one-year forward P/E of 18.2x and 15.2x, respectively.
Meanwhile, the Nifty-50 defensive basket, driven by the Consumer sector, is
trading at 29x one-year forward P/E, at a 43% premium to the index.
Of the 17 Nifty-50 sectors, three are trading at a discount
to their historical
averages, while the rest 14 trade at a premium. Private Banks/PSU Banks/NBFCs
are currently trading at 18%/13%/5% discounts to their 10-year avg. forward P/E
…however, India is always considered expensive, but why?
Nifty-50: Forward P/E multiple –
broad classification
Forward P/E - Nifty-50
Defensive
Domestic Cyclicals
Global Cyclicals
29
18
27
26
15
18
20
17
9
Aug'24
FY19
FY14
Research Analyst: Gautam Duggad
(Gautam.Duggad@MotilalOswal.com)|
Saharsh Kumar
(Saharsh.Kumar@MotilalOswal.com)
Research Analyst: Deven Mistry
(Deven@MotilalOswal.com) |
Aanshul Agarawal
(Aanshul.Agarawal@Motilaloswal.com)
Investors are advised to refer through important disclosures made at the last page of the Research Report.
Motilal Oswal research is available on www.motilaloswal.com/Institutional-Equities, Bloomberg, Thomson Reuters, Factset and S&P Capital.
 Motilal Oswal Financial Services
India Strategy | Nifty P/E dissection
Refer to our Jun’24
Quarter Preview for model
portfolio
ratios of ~ 20x/10x/19x. Utilities/ Logistics/Cement are trading at a premium of
74%/ 50%/46% to their 10-year average forward P/E ratios of ~10x/19x/22x. The
pro-infrastructure policies of the government, since Covid-19, have pushed the
valuations in the expensive territory compared to their historical averages.
Banking sector’s valuations appear attractive.
In our opinion, valuations are not
completely factoring in the recapitalized balance sheets of PSU Banks, decadal low
net NPAs, and a robust 15-16% credit growth. With the possibility of a rate cut by
the RBI delayed, NIMs may still remain stable at current levels, albeit, with a slight
decline due to rising borrowing costs. Private Banks are currently trading at an 18%
discount on a forward multiple basis. The discount remains relatively consistent on
a trailing and forward basis, indicating parity in historical earnings growth and
future 12-month expectations. While Metals, Telecom, and Healthcare sectors are
trading at a premium on a trailing P/E basis, on forward earnings, the valuations
are near their long-term averages, suggesting stronger earnings potential in the
next 12 months compared to their past performances.
View:
Over the past five years, the Nifty-50 has delivered stellar returns at 17%
CAGR, supported by equally impressive corporate earnings CAGR of 18%, resulting
in an increase in Nifty profits to INR7.9t in FY24 from INR3.5t in FY19. We expect the
earnings momentum to sustain; albeit, the magnitude of its growth is expected to
moderate to ~15% over FY24-26. As highlighted in this note, the Nifty P/E remains
well within its 10-year average range and is expected to maintain this level going
forward. We remain constructive on the markets, and our preference is
predominantly in favor of large-caps, as the valuations of mid- and small-cap indices
are trading at a premium of 79% and 8% to Nifty-50, respectively. Our
model
portfolio
underscores our strong belief in the domestic structural and cyclical
themes. We continue to remain bullish on PSU Banks, Consumption, Industrials, and
Real Estate, and we have turned constructive on Technology. We also remain
positive on Healthcare, and remain underweight on Private Banks and Energy.
MOFSL Top Ideas:
Largecaps –
ICICI Bank, SBI, HUL, L&T, HCL Tech, M&M, Coal
India, Titan, Hindalco and Mankind Pharma;
Midcaps and Smallcaps
Indian
Hotels, Godrej Properties, Ashok Leyland, Persistent System, Kaylan Jewellers,
KEI Industries, Metro Brands, PNB Housing, Cello World and Angel One.
Exhibit 1: BFSI (ex. Insurance), Oil & Gas, Utilities, and Metals trail Nifty-50 (one-year forward P/E)
67.7
39.2
37.0
32.6
31.8
31.3
28.3
27.6
25.1
21.9
20.3
18.4
18.3
16.8
16.4
11.1
8.7
Methodology: In the study we have kept current Nifty-50 constituents constant, for the last ~10 years of the data. We have used the
computed free float percentage, FF PAT, and FF Market Cap for each Nifty-50 constituent. Appropriate adjustments have been made in the
banking stocks due to sharp fall in profits/losses.
August 2024
2
 Motilal Oswal Financial Services
India Strategy | Nifty P/E dissection
Insightful trends
Exhibit 2:
Consistent upward re-rating of rolling 10-year avg. trailing Nifty P/E
Rolling 10 year average trailing Nifty P/E
21.0
21.7
22.4
22.6
14.0
14.5
14.8
15.0
15.3
15.5
15.9
16.2
16.9
17.5
17.8
18.2
19.1
19.6
20.0
Exhibit 3:
Clear divergence between defensive, domestic, and global cyclicals (one-year fwd. P/E)
33.0
26.0
19.0
12.0
5.0
Nifty-50
Defensive
Domestic Cyclicals
Global Cyclicals
28.9
20.1
18.2
15.2
Exhibit 4:
Secular sectors’ (Pvt Banks + Consumer + Retail + Tech) contribution to Nifty PAT and market cap
54
PAT Contrinution to Nifty PAT (%)
Mcap Contribution to Nifty Mcap (%)
49
46
45
43
39
38
34
FY14
FY15
FY16
FY17
FY18
FY19
FY20
FY21
FY22
FY23
FY24
FY25E
FY26E
38
39
40
54
51
52
50
51
50
48
Market Cap
Contribution
Revival?
48
47
49
44
46
46
46
45
46
43
49
Market Cap Contribution (%)
PAT Contribution (%)
August 2024
3
 Motilal Oswal Financial Services
India Strategy | Nifty P/E dissection
Exhibit 5:
50% of the stocks currently trade above 30x trailing P/E vs. a mere 14% in FY14
FY14 Trailing P/E
FY19 Trailing P/E
76%
66%
54%
38%
22%
14%
44%
30%
50%
Current Trailing P/E
% of stocks in Nifty above threshold Trailing P/E
>20x
>25x
>30x
Exhibit 6: Nifty-50 constituents, weight, and trailing P/E changes
Company Count
Sector
Automobiles
Banks-Private
Banks-PSU
Insurance
NBFC
Capital Goods
Cement
Consumer
Healthcare
Logistics
Metals
Oil & Gas
Retail
Technology
Telecom
Utilities
Misc.
Media
Real Estate
Nifty-50
FY14
5
5
3
n/a
2
2
4
4
4
n/a
5
5
n/a
5
1
4
n/a
n/a
1
50
FY19
6
6
1
n/a
4
1
2
4
3
1
4
5
1
5
2
3
1
1
n/a
50
Current
6
5
1
2
3
1
2
6
4
1
3
4
1
6
1
3
1
n/a
n/a
50
FY14
8.8
17.0
3.7
n/a
6.8
5.4
3.1
12.7
5.2
n/a
4.0
11.5
n/a
16.3
1.7
3.6
n/a
n/a
0.4
100
Weight in Nifty-50
FY19
6.1
26.3
2.6
n/a
10.0
3.7
1.6
10.3
2.4
0.6
2.9
13.2
1.0
13.7
1.4
3.0
0.8
0.5
n/a
100
Current
7.9
25.4
2.9
1.4
3.2
3.9
2.1
9.9
3.9
1.0
2.8
11.6
1.3
13.9
3.7
4.4
0.8
n/a
n/a
100
FY14
12.1
16.3
9.1
n/a
22.5
25.2
22.4
35.8
22.2
n/a
10.9
10.9
n/a
18.1
46.3
13.7
n/a
n/a
48.7
16.6
Trailing P/E
FY19
24.1
37.4
124.5
n/a
32.5
22.5
21.3
39.0
29.1
17.8
8.0
15.5
72.6
20.0
n/m
9.5
19.8
27.1
n/a
23.9
Current
25.0
18.8
10.7
-
23.7
37.6
35.7
42.2
35.0
36.8
24.1
18.9
83.9
31.7
73.9
14.7
103.6
n/a
n/a
23.1
Note: Exhibit data is sourced from Capitaline, Bloomberg and MOFSL research database. Prices as of 09th August’24 closing.
August 2024
4
 Motilal Oswal Financial Services
India Strategy | Nifty P/E dissection
Key takeaways:
India's premium valuations
are attributed to its robust
corporate profit growth,
stable democratic setup,
6%-7% GDP growth rate,
convergence in fiscal &
monetary policies, and
record FX reserves &
remittances.
India is always considered expensive, but why?
Compared to its EM peers,
India has been considered expensive over the last 20 years.
An anomaly in a
data set can be overlooked, but when consistent, it becomes the norm.
India
enjoys its premium valuations due to: 1) a strong, continuous, and stable political
setup, with the victory of PM Narendra Modi/BJP (under NDA) for the third
consecutive term that provides policy continuity and reforms momentum; 2) a
GDP growth rate ranging between 6% and 7% during this period; 3) very healthy
macros – stable currency, twin deficits under control, peaking of interest rates,
moderating inflation print, massive development of digital and physical
infrastructure, and financialization of savings; and 4) a record level of FX
reserves along with USD120b+ in remittances to maintain the BoP accounts.
Robust corporate profit growth justifies the high P/E:
India’s corporate sector has
exhibited remarkable resilience and growth; most importantly, it is not skewed or
lopsided but rather broad-based. In our
recent note,
we highlighted that 1) in 2024,
the corporate profit to GDP ratio for the Nifty-500 Universe and listed India Inc.
swelled to 4.8% and 5.2%, respectively, scaling a 15-year high; 2) it was not only the
private sector but Indian PSUs where profits surged 5x between 2020 and 2024; and
3) we are forecasting a 11%/18% YoY EPS growth for Nifty-50 in FY25/FY26. Overall,
the buoyant macro-economics and stable political environment have served as a
solid foundation for the companies' profits to grow over time.
The Nifty-50 is currently trading at 20.3x its one-year forward earnings.
Following
the recent correction, Nifty-50 is trading at a fair valuation compared to its 10-
year forward average multiple of 20.4x. According to our classification, the
domestic and global cyclicals trade lower at 18.2x/15.2x (at one-year forward
earnings) to index multiples. The Nifty-50 defensive basket trades at a forward
multiple of 29x, which is at 43% premium to the Nifty-50 multiples. BFSI (ex-
Insurance), Metals, Oil & Gas, and Utilities trade below the Nifty forward
multiples. Retail (67.7x), Telecom (39.2x), Consumer (37.0x), and Cement (32.6x)
trade significantly above the Nifty P/E forward multiples.
Stocks with the highest forward P/E multiple in Nifty-50:
Adani Enterprises, Titan,
Apollo Hospitals, Nestle and Tata Consumer.
Stocks with the lowest forward P/E multiple in Nifty-50:
ONGC, Coal India, SBI,
Hindalco, and IndusInd Bank.
On delivered earnings, Nifty trades at 23.1x, nearly at par to its history.
Twelve
out of 17 sectors trade at a premium to Nifty-50 trailing multiples. The Telecom
sector trades at a 67% premium to its historical trailing multiples, while its
forward multiple trades at a mere 1% premium to its own history. This is due to
the expected ~65% CAGR in earnings between FY24 and FY26.
On forward P/B, Nifty trades at a 15% premium.
Nifty-50 trades at 3.3x/3.7x on
forward/trailing P/B basis, while Nifty-50 (ex BFSI) trades at 4.0x/4.6x forward/
trailing P/B. BFSI (ex-Insurance), Metals , Utilities, and Oil & Gas trade below the
Nifty P/B forward multiples. Conversely, Retail (22.2x), Consumer (9.6x),
Technology (8.6x) and Telecom (6.4x) trade at much higher P/B multiples as
compared to Nifty-50.
Stocks (ex-Consumer, Healthcare, Retail, and Technology) with the highest forward
P/B:
Baja Auto, Adani Ent, Bharti Airtel, Eicher Motors, and Hero Motocorp.
August 2024
5
 Motilal Oswal Financial Services
India Strategy | Nifty P/E dissection
Stocks (ex.-Consumer, Healthcare, Retail, and Technology) with the lowest forward
P/B
: ONGC, Hindalco, IndusInd Bank, SBI, and BPCL.
Banking sector’s valuations appear attractive.
In our opinion, valuations are not
completely factoring in the recapitalized balance sheets of PSU Banks, decadal low
net NPAs, and a robust 15-16% credit growth. With the possibility of a rate cut by
the RBI delayed, NIMs may still remain stable at current levels, albeit, with a slight
decline due to rising borrowing costs. Private Banks are currently trading at an 18%
discount on a forward multiple basis. The discount remains relatively consistent on
a trailing and forward basis, indicating parity in historical earnings growth and
future 12-month expectations. While Metals, Telecom, and Healthcare sectors are
trading at a premium on a trailing P/E basis, on forward earnings, the valuations
are near their long-term averages, suggesting stronger earnings potential in the
next 12 months compared to their past performances.
Exhibit 6:
Nifty-50 sectoral P/E : Premium/Discount to its history
Free Float PE
Sectors
Automobiles
Banks-Private
Banks-PSU
Insurance
NBFC - Lending
Capital Goods
Cement
Consumer
Healthcare
Logistics
Metals
Oil & Gas
Retail
Technology
Telecom
Utilities
Others
Nifty 50
Nifty 50 ex BFSI
Trailing
25.2
18.8
10.7
93.8
23.9
37.6
35.6
40.0
38.8
36.8
16.4
17.2
83.9
31.7
73.9
19.3
104.5
23.1
27.7
1 year Forward
21.9
16.4
8.7
84.5
18.4
31.3
32.6
37.0
31.8
28.3
11.1
16.8
67.7
27.6
39.2
18.3
85.3
20.3
25.1
Forward Averages
Last 10 year Avg. P/E
20.0
19.9
10.1
62.3
19.4
24.2
22.4
31.9
29.5
18.8
10.6
13.9
61.7
21.2
38.9
10.5
53.9
20.4
19.7
Premium/
Discount
9%
-18%
-13%
36%
-5%
30%
46%
16%
8%
50%
5%
21%
10%
30%
1%
74%
58%
0%
27%
Trailing Averages
Last 10 year Avg. P/E
23.9
24.0
11.2
70.9
24.4
28.1
24.0
34.6
32.2
22.0
12.2
15.2
74.2
22.3
44.2
11.1
67.5
22.5
20.1
Premium/
Discount
5%
-22%
-4%
32%
-2%
34%
49%
15%
20%
67%
35%
13%
13%
42%
67%
74%
55%
3%
38%
August 2024
6
 Motilal Oswal Financial Services
India Strategy | Nifty P/E dissection
Story in charts
Exhibit 7:
BFSI, Oil & Gas, Metals, and Utilities trail the Nifty-50 on a one-year forward P/E basis
67.7
39.2
37.0
32.6
31.8
31.3
28.3
27.6
25.1
21.9
20.3
18.4
18.3
16.8
16.4
11.1
8.7
Exhibit 8:
On a trailing basis (on FY24 EPS), the story remains the same…
84
74
40
39
38
37
36
32
27.7
25
24
23.1
19
19
17
16
11
Exhibit 9:
…even compared to their own history, Banks (Private/PSU) trade at a discount. Metals, Healthcare, Retail, and
Auto near their LTAs
Disc/ prem: Fwd P/E vs. its 10 year average
74%
1%
-18%
-13%
-5%
5%
8%
9%
10%
16%
21%
27%
46%
30%
30%
50%
0%
Note: Exhibit data is sourced from Capitaline, Bloomberg and MOFSL research database. Prices as of 09th Aug’24 closing.
August 2024
7
 Motilal Oswal Financial Services
India Strategy | Nifty P/E dissection
Exhibit 10:
A spike in Bank earnings made it cheaper on a trailing P/E basis
Disc/ prem: Trailing P/E vs. its 10 year average
34%
35%
42%
49%
20%
55%
67%
67%
3%
-22%
-4%
5%
13%
13%
15%
-2%
-2%
Exhibit 11:
Nifty-50’s forward P/B vs. its sectors’ forward P/B
22.3
9.6
8.9
8.6
6.4
5.1
5.0
4.8
4.6
4.0
3.8
3.3
3.2
2.6
2.5
4.0
1.9
1.6
Exhibit 12:
Nifty-50’s trailing P/B vs. its sectors’ trailing P/B
31.2
10.4
10.3
10.2
8.7
6.2
6.2
5.7
5.6
4.6
4.2
3.9
3.7
2.9
2.9
2.2
2.1
1.9
Exhibit 13:
Nifty-50’s sectoral P/B – discount/premium to its 10-year average: Nifty-50 at 18% premium to its historical
average
Disc/Prem. of Fwd P/B to its 10 year average
72%
27%
85%
10%
-1%
18%
21%
25%
26%
35%
36%
38%
44%
45%
50%
50%
53%
August 2024
8
 Motilal Oswal Financial Services
India Strategy | Nifty P/E dissection
Exhibit 14:
Nifty-50’s sectoral trailing P/B – discount/premium
Disc/Prem. of trailing P/B to its 10 year average
63%
69%
79%
124%
11%
-2%
19%
23%
26%
35%
38%
40%
41%
42%
46%
50%
57%
Exhibit 15:
Nifty-50 constituents’ forward P/E vs. Nifty P/E
20.3
Exhibit 16:
Nifty-50 constituents’ trailing P/E
23.1
August 2024
9
 Motilal Oswal Financial Services
India Strategy | Nifty P/E dissection
Exhibit 17:
The stocks’ forward P/B – Nifty-50 (excluding Nestle, Britannia, Titan, TCS, Asian Paints, and HUL)
11
10
10
9
9 9
8
8
7 6 6
6 5 5 5
5 5 5 5 5
3.3
4 4 4
4 3 3
3 3 3 3 3 3
2 2 2 2 2 2 2
2 2 1
1 1
Exhibit 18:
The stocks’ trailing P/B – Nifty-50
14
11 11
10 10 10
9 9
8 8
7
7
7 6 6 6
6 6 5 5 5 5
3.7
5 5 4 4 4
4
4 3 3 3 3
3 2 2 2 2 2 2 2
2 1 1
Exhibit 19:
Discount/Premium (%): The stocks’ forward P/E ratios vs. their 10-year averages
48 50 53 56 57
58 62 66 66
81 85
20
22
11 12 12 12 16 17 19
1 2 3 6 8 9 10 10
-15-14-13 -8 -7
-6
-5 -5 -4 -3
-0.5
-32-27
27 27
29
30 32
37 38 38
August 2024
10
 Motilal Oswal Financial Services
India Strategy | Nifty P/E dissection
The P/E ratios of 32/50
Nifty stocks have re-rated
since FY19. However, the
P/E ratios of the BFSI stocks
have de-rated the most
during the period.
Sectoral P/E re-rating and de-rating
Nifty 50 sectoral P/E de-rating
19%
3%
1%
1%
BFSI, Telecom, Retail, and Healthcare’s earnings lead the pack.
Keeping the Nifty
50 constituents constant, the Nifty-50 FF PAT has grown by 20% between FY19
and FY24. Among the sectors, Private and PSU banks lead the charge with a
staggering 36% PAT CAGR for both sectors. For PSU Banks, we have taken the
base year as FY20 due to the loss year. For the banks, a restrictive monetary policy
along with high demand for credit contributed to this success, which led to higher
NIMs and profitability. The premiumization theme played out well for the
automobile sector, where earnings rose by a 23% CAGR. A better product mix led
to improved earnings growth, with SUVs replacing small cars for the top slot. The
consolidation in the Indian mobile carrier market led to a rise in Telecom's (Bharti)
PAT. Both Jio and Bharti have gained subscribers from Vodafone Idea. In the
future, we expect the price competition to remain intense, but a better customer
mix can maintain or drive the ARPUs higher. Healthcare earnings jumped 22%
over the period, primarily during the pandemic phase.
Highest market cap growth (FY19 – current):
Others (Adani Enterprises): 79%,
Telecom (50%), PSU Banks (38%), Insurance (31%), Logistics (28%), Utilities
(26%), Healthcare (25%), Cement (23%), Automobile (23%), and Metals (23%).
Top sectoral re-rating:
Metals, Logistics, Cement, Capital Goods and Technology
P/E ratios have re-rated the most by 16%/15%/10%/10%/10% during the period.
Stocks with the highest P/E re-rating:
Adani Enterprises (45%), Tata Steel (44%),
LTIMindtree (36%), Tata Consumer (24%), and JSW Steel (20%).
Loss to Profit stocks:
Bharti Airtel and Tata Motors.
Stocks with the highest P/E de-rating:
Axis Bank (29%), IndusInd Bank (23%),
BPCL (15%), Kotak Mahindra Bank (14%), and ICICI Bank (14%). For ICICI Bank,
we have considered the base year as FY20, due to a sharp dip in profits in FY19.
Exhibit 20:
BFSI (ex-Insurance)’s sectoral P/E de-rated the most since FY19
19%
3%
PAT CAGR -Market Cap CAGR (since FY19)
1%
1%
0%
-2%
-2%
-2%
-3%
-6%
-10%
-10%
-10%
-13%
-15%
-16%
Methodology: In the study we have kept current Nifty-50 constituents constant, for the last ~10 years of the data. We have used the
computed free float percentage, FF PAT, and FF Market Cap for each Nifty-50 constituent. Appropriate adjustments have been made in the
banking stocks due to sharp fall in profits/losses.
August 2024
11
 Motilal Oswal Financial Services
India Strategy | Nifty P/E dissection
Exhibit 21:
BFSI (ex-Insurance), Automobile, Healthcare, and Retail FF PAT CAGR outpaced others…
36%
36%
34%
23%
22%
21%
20%
PAT CAGR % (FY19 - FY24)
20%
14%
13%
13%
13%
12%
12%
9%
7%
7%
Exhibit 22:
…while, for Pvt Banks and NBFCs, the FF PAT CAGR has not exactly translated into similar market cap growth
50%
38%
28%
26%
25%
23%
23%
23%
MCap CAGR % (FY19 - FY24)
22%
19%
19%
19%
18%
17%
17%
15%
13%
Exhibit 23:
Stocks where P/E has de-rated (PAT CAGR - market cap CAGR since FY19)
29%
23%
15%
14%
14%
12%
11%
6%
6%
4%
"PE De-rating"
2%
1%
1%
1%
1%
Note: We have considered Normalized year as FY20 for PSU Banks and ICICI Banks due to sharp decline in profits. For Telecom sector and
for Tata Motors, it is characterized from Loss to Profit sector as FY19-FY21 were the loss years.
August 2024
12
 Motilal Oswal Financial Services
India Strategy | Nifty P/E dissection
Exhibit 24:
Stocks with high P/E re-rating since FY19 (PAT CAGR - market cap CAGR <-10%)
-24%
-20%
-18%
-16%
-16%
-15%
-14%
-14%
-14%
-13%
-13%
-13%
-45%
-44%
-36%
Exhibit 25:
Nifty-50 stocks – P/E de-rated
Stocks
Axis Bank
IndusInd Bank
BPCL
Kotak Mah. Bank
ICICI Bank
Bajaj Finance
HDFC Bank
Asian Paints
Dr Reddy’ s
Bajaj Finserv
Nestle
Ultratech Cem
Coal India
Britannia
Hind. Unilever
PAT CAGR
MCap CAGR
(FY19 - FY24) (FY19 - Current)
43%
22%
26%
22%
51%
30%
29%
20%
25%
19%
18%
24%
22%
13%
15%
14%
0%
11%
7%
36%
17%
19%
14%
19%
15%
16%
23%
21%
12%
14%
PAT CAGR >
Mcap CAGR
(since 2019)
29%
23%
15%
14%
14%
12%
11%
6%
6%
4%
2%
1%
1%
1%
1%
Exhibit 26:
Top Nifty-50 stocks – P/E re-rated
Stocks
Adani Ent
Tata Steel
LTIMindtree
Tata Consumer
JSW Steel
Divis Labs
Tech Mahindra
Grasim Industries
Adani Ports
M&M
Power Grid Corp
Bajaj Auto
NTPC
Shriram Finance
HCL Tech
PAT CAGR -
PAT CAGR
MCap CAGR
Mcap CAGR <-
(FY19 - FY24) (FY19 - Current)
10%
34%
79%
-45%
-20%
24%
-44%
7%
43%
-36%
26%
50%
-24%
3%
22%
-20%
4%
22%
-18%
-3%
13%
-16%
7%
22%
-16%
13%
28%
-15%
16%
30%
-14%
12%
25%
-14%
9%
22%
-14%
13%
26%
-13%
15%
28%
-13%
9%
21%
-13%
Exhibit 27:
Nifty-50’s sectoral PAT CAGR vs. market cap CAGR
Free Float
FF PAT
Free Float
FF MCap
P/E Re-rating/
PAT (INR b)
CAGR
MCap (INR b)
CAGR
De-rating
FY14
FY19
FY24 FY19 - FY24 (i) FY14
FY19 Current FY19 - Current (ii) (i) - (ii) (percentage point)
Nifty Sectors
10
-11
53
L to P
442
437
3884
50
Loss to Profit
Telecom
237
316
1451
36
3873
11861
27237
17
19
Banks-Private
22
58
151
21
214
1463
3613
18
3
NBFC - Lending
166
121
346
23
2138
2913
8710
23
1
Automobiles
114
170
305
12
3772
6370
12188
13
0
Consumer
222
378
721
14
2640
5765
12372
15
-2
Oil & Gas
3
7
16
20
109
476
1381
22
-2
Retail
59
85
289
36
593
757
3105
38
-2
Banks-PSU
49
47
126
22
1122
1460
4897
25
-3
Healthcare
199
330
471
7
3657
6473
14948
17
-10
Technology
45
86
130
9
1180
1941
4884
19
-10
Capital Goods
24
36
64
13
427
759
2285
23
-10
Cement
48
100
180
12
479
1012
3482
26
-13
Utilities
4
17
30
13
97
295
1119
28
-15
Logistics
62
198
276
7
789
1527
4536
23
-16
Metals
5
2
9
34
101
41
913
79
-45
Others
1271
1871
4635
20
21633
44378 111074
19
1
Nifty 50
953
1481
2728
13
16953
29469
75598
19
-6
Nifty 50 ex BFSI
521
768
2562
27
8431
22009
56393
19
8
Nifty 50 Domestic Cyclical
380
569
1124
15
4293
7741
19428
19
-4
Nifty 50 Global Cyclicals
370
534
948
12
8909
14629
35253
18
-6
Nifty 50 Defensive
Note: For Banks PSU, we have considered FY20 as the base year as FY19 was a loss year.
August 2024
13
 Motilal Oswal Financial Services
India Strategy | Nifty P/E dissection
Inclusion of high P/E
Consumer, Retail, Insurance
and Logistics stocks; along
with constant sectoral P/E
re-rating, Nifty-50’s ten
year rolling average trailing
P/E rose to 22.9x as of
Jun’24 from 16.2x in FY14.
Inclusion of higher multiple stocks has driven Nifty P/E upwards
Trailing P/E - Nifty-50
Defensive
Domestic Cyclicals
Global Cyclicals
32
21
24
18
17
32
23
14
10
Aug'24
FY19
FY14
Weightage (%) in Nifty-50
Defensive
Domestic Cyclicals
Global Cyclicals
52
39
30
17
18
19
42
48
35
Aug'24
FY19
FY14
The 10-year rolling average P/E has re-rated consistently since FY07:
In FY07,
the 10-year average trailing/forward P/E ratios were 14.0x/12.5x. Over the next
17+ years, the 10-year rolling average P/E ratios on trailing and forward
multiples re-rated to reach 22.6x and 20.4x at present, respectively. On a trailing
basis, Nifty-50 traded at 16.6x at FY14 EPS. This scaled a peak of ~27.1x at FY21
EPS. From that point, it has now come down to a trailing multiple of 22.9x.
Interestingly, as of FY14, only 14% of the stocks were trading above 30x
trailing P/E, but this figure has surged to 50% currently!
Changes in Nifty-50 constituents:
Over the years, the commodity stocks with
relatively lower P/E ratios have been excluded and replaced by high P/E
Consumer, Retail, and Logistic stocks. In FY14, global cyclicals comprised 12
stocks with an average trailing P/E of 10x. The number of stocks has reduced to
nine currently, but the average trailing P/E has gone up to 18x. For the domestic
cyclicals’ weight has increased to 48% currently from 42% in FY14, with its
average trailing P/E reaching the peak of 32x in FY19. However, it has come
down to a more reasonable 22x on FY24 earnings. The defensive sector’s stock
count has inched up to 19 from 17 during the last 10 years. However, its weight
in Nifty-50 has gone down to 35% currently from 39% in FY14. Its average
trailing P/E has gone up to 35x in Aug’24 from 23x in FY14.
The trailing P/E has nearly doubled for Metals, Auto, Technology, and Oil & Gas
sectors:
The Automobile sector traded at 12.1x in FY14, and this has increased to
25.0x currently. The constituents for the sector rose to six stocks currently from
five in FY14. In the Capital Goods sector, the number of constituents came down to
one from two; while the trailing P/E increased to 37.6x currently from 25.2x in
FY14. Metals, which had five stocks in Nifty-50 in FY14, had a trailing P/E of 10.9x.
The number of stocks within Metals reduced to three over the years, while its
trailing P/E has increased to 24.1x currently. In some of these sectors, the
underperforming/loss-making companies have been excluded from Nifty-50. The
remaining companies outperformed and led to higher sectoral P/E. The number of
stocks in the Technology sector, comprising IT companies, has inched up to six
currently from five in FY14. During the pre-Covid period, the Technology sector
traded at ~15-20x. Currently, it trades at 31.7x on a trailing basis. Increased
reliance of businesses on technology and AI-led growth in tech businesses, despite
a subdued near-term forecast, has raised the industry P/E.
The trailing P/E ratios for the BFSI (ex-Insurance), Consumer, and Utility sectors
have remained flat.
Private Banks’ trailing P/E rose to its peak at 37.4x in FY19,
up from 16.3x in FY14. It is currently trading at 18.8x, which is relatively flat over
the last 10 years. The PSU Banks experienced a phase of losses, but after the
recapitalization and merger of smaller PSU banks into SBI, things have turned
around.
On a trailing P/E basis, the PSU Banks trade at 10.7x, which is almost
flat vs. FY14, but still at a steep 60% discount to Private Banks.
The muted
consumer demand, especially from rural strata, is getting reflected in the
consumer sector’s P/E. In FY14, the Consumer sector traded at a trailing P/E of
35.8x. Though it has gone up over the years, it is still range bound and hovers in
the range of 30x-40x. It is currently trading at a trailing P/E of 42.2x.
August 2024
14
 Motilal Oswal Financial Services
India Strategy | Nifty P/E dissection
Exhibit 28:
50% of the stocks currently trade above 30x trailing P/E vs. only 14% in FY14
FY14 Trailing P/E
FY19 Trailing P/E
76%
66%
54%
38%
22%
14%
44%
30%
50%
Current Trailing P/E
% of stocks in Nifty above threshold Trailing P/E
>20x
>25x
>30x
Exhibit 29:
Defensive sectors clearly trade well above Nifty-50 and cyclicals on a one-year forward P/E basis
33.0
26.0
19.0
12.0
5.0
Nifty-50
Defensive
Domestic Cyclicals
Global Cyclicals
28.9
20.1
18.2
15.2
Exhibit 30:
Stock count in Nifty-50
Defensive
9
9
9
8
9
Domestic Cyclicals
Global Cyclicals
9
11
11
11
10
12
12
22
22
23
23
23
22
23
22
23
23
21
21
19
Aug'24
19
FY24
18
FY23
19
FY22
18
FY21
17
FY20
16
FY19
17
FY18
18
FY17
17
FY16
17
FY15
17
FY14
August 2024
15
 Motilal Oswal Financial Services
India Strategy | Nifty P/E dissection
Exhibit 31:
Weightage (%) in Nifty-50
Defensive
17
18
16
18
Domestic Cyclicals
15
18
Global Cyclicals
18
16
15
19
19
16
48
49
50
47
50
48
52
52
50
46
42
42
35
Aug'24
33
FY24
33
FY23
35
FY22
34
FY21
37
FY20
30
FY19
30
FY18
34
FY17
39
39
39
FY16
FY15
FY14
Exhibit 32:
Consistent upward re-rating of rolling Nifty 10-year average trailing P/E multiple
Rolling 10 year average trailing Nifty P/E
21.0
21.7
22.4
22.6
14.0
14.5
14.8
15.0
15.3
15.5
15.9
16.2
16.9
17.5
17.8
18.2
19.1
19.6
20.0
Exhibit 33:
Nifty-50 constituents, weight, and trailing P/E changes
Sector
Automobiles
Banks-Private
Banks-PSU
Insurance
NBFC
Capital Goods
Cement
Consumer
Healthcare
Logistics
Metals
Oil & Gas
Retail
Technology
Telecom
Utilities
Misc
Media
Real Estate
Nifty-50
Company Count
FY14
FY19
Current
5
6
6
5
6
5
3
1
1
n/a
n/a
2
2
4
3
2
1
1
4
2
2
4
4
6
4
3
4
n/a
1
1
5
4
3
5
5
4
n/a
1
1
5
5
6
1
2
1
4
3
3
n/a
1
1
n/a
1
n/a
1
n/a
n/a
50
50
50
Weight in Nifty-50
FY14
FY19
Current
8.8
6.1
7.9
17.0
26.3
25.4
3.7
2.6
2.9
n/a
n/a
1.4
6.8
10.0
3.2
5.4
3.7
3.9
3.1
1.6
2.1
12.7
10.3
9.9
5.2
2.4
3.9
n/a
0.6
1.0
4.0
2.9
2.8
11.5
13.2
11.6
n/a
1.0
1.3
16.3
13.7
13.9
1.7
1.4
3.7
3.6
3.0
4.4
n/a
0.8
0.8
n/a
0.5
n/a
0.4
n/a
n/a
100
100
100
FY14
12.1
16.3
9.1
n/a
22.5
25.2
22.4
35.8
22.2
n/a
10.9
10.9
n/a
18.1
46.3
13.7
n/a
n/a
48.7
16.6
Trailing P/E
FY19
24.1
37.4
124.5
n/a
32.5
22.5
21.3
39.0
29.1
17.8
8.0
15.5
72.6
20.0
n/m
9.5
19.8
27.1
n/a
23.9
Current
25.0
18.8
10.7
-
23.7
37.6
35.7
42.2
35.0
36.8
24.1
18.9
83.9
31.7
73.9
14.7
103.6
n/a
n/a
22.9
Investment in securities market are subject to market risks. Read all the related documents carefully before investing
August 2024
16
 Motilal Oswal Financial Services
REPORT GALLERY
RECENT STRATEGY/THEMATIC REPORTS
India Strategy | Nifty P/E dissection
August 2024
17
 Motilal Oswal Financial Services
India Strategy | Nifty P/E dissection
NOTES
August 2024
18
 Motilal Oswal Financial Services
India Strategy | Nifty P/E dissection
Explanation of Investment Rating
Investment Rating
Expected return (over 12-month)
BUY
>=15%
SELL
< - 10%
NEUTRAL
< - 10 % to 15%
UNDER REVIEW
Rating may undergo a change
NOT RATED
We have forward looking estimates for the stock but we refrain from assigning recommendation
*In case the recommendation given by the Research Analyst is inconsistent with the investment rating legend for a continuous period of 30 days, the Research Analyst shall be within following 30 days take
appropriate measures to make the recommendation consistent with the investment rating legend.
Disclosures
The following Disclosures are being made in compliance with the SEBI Research Analyst Regulations 2014 (herein after referred to as the Regulations).
Motilal Oswal Financial Services Ltd. (MOFSL) is a SEBI Registered Research Analyst having registration no. INH000000412. MOFSL, the Research Entity (RE) as defined in the Regulations, is engaged in
the business of providing Stock broking services, Depository participant services & distribution of various financial products. MOFSL is a listed public company, the details in respect of which are available on
www.motilaloswal.com.
MOFSL (erstwhile Motilal Oswal Securities Limited - MOSL) is registered with the Securities & Exchange Board of India (SEBI) and is a registered Trading Member with National
Stock Exchange of India Ltd. (NSE) and Bombay Stock Exchange Limited (BSE), Multi Commodity Exchange of India Limited (MCX) and National Commodity & Derivatives Exchange Limited (NCDEX) for
its stock broking activities & is Depository participant with Central Depository Services Limited (CDSL) National Securities Depository Limited (NSDL),NERL, COMRIS and CCRL and is member of
Association of Mutual Funds of India (AMFI) for distribution of financial products and Insurance Regulatory & Development Authority of India (IRDA) as Corporate Agent for insurance products.
Details of
associate entities of Motilal Oswal Financial Services Limited are available on the website at
http://onlinereports.motilaloswal.com/Dormant/documents/List%20of%20Associate%20companies.pdf
MOFSL and its associate company(ies), their directors and Research Analyst and their relatives may; (a) from time to time, have a long or short position in, act as principal in, and buy or sell the securities or
derivatives thereof of companies mentioned herein. (b) be engaged in any other transaction involving such securities and earn brokerage or other compensation or act as a market maker in the financial
instruments of the company(ies) discussed herein or act as an advisor or lender/borrower to such company(ies) or may have any other potential conflict of interests with respect to any recommendation and
other related information and opinions.; however the same shall have no bearing whatsoever on the specific recommendations made by the analyst(s), as the recommendations made by the analyst(s) are
completely independent of the views of the associates of MOFSL even though there might exist an inherent conflict of interest in some of the stocks mentioned in the research report.
MOFSL and / or its affiliates do and seek to do business including investment banking with companies covered in its research reports. As a result, the recipients of this report should be aware that MOFSL
may have a potential conflict of interest that may affect the objectivity of this report. Compensation of Research Analysts is not based on any specific merchant banking, investment banking or brokerage
service
transactions.
Details
of
pending
Enquiry
Proceedings
of
Motilal
Oswal
Financial
Services
Limited
are
available
on
the
website
at
https://galaxy.motilaloswal.com/ResearchAnalyst/PublishViewLitigation.aspx
A graph of daily closing prices of securities is available at
www.nseindia.com, www.bseindia.com.
Research Analyst views on Subject Company may vary based on Fundamental research and Technical
Research. Proprietary trading desk of MOFSL or its associates maintains arm’s length distance with Research Team as all the activities are segregated from MOFSL research activity and therefore it can
have an independent view with regards to Subject Company for which Research Team have expressed their views.
Regional Disclosures (outside India)
This report is not directed or intended for distribution to or use by any person or entity resident in a state, country or any jurisdiction, where such distribution, publication, availability or use would be contrary
to law, regulation or which would subject MOFSL & its group companies to registration or licensing requirements within such jurisdictions.
For Hong Kong:
This report is distributed in Hong Kong by Motilal Oswal capital Markets (Hong Kong) Private Limited, a licensed corporation (CE AYY-301) licensed and regulated by the Hong Kong Securities and Futures
Commission (SFC) pursuant to the Securities and Futures Ordinance (Chapter 571 of the Laws of Hong Kong) “SFO”. As per SEBI (Research Analyst Regulations) 2014 Motilal Oswal Securities (SEBI Reg.
No. INH000000412) has an agreement with Motilal Oswal capital Markets (Hong Kong) Private Limited for distribution of research report in Hong Kong. This report is intended for distribution only to
“Professional Investors” as defined in Part I of Schedule 1 to SFO. Any investment or investment activity to which this document relates is only available to professional investor and will be engaged only with
professional investors.” Nothing here is an offer or solicitation of these securities, products and services in any jurisdiction where their offer or sale is not qualified or exempt from registration. The Indian
Analyst(s) who compile this report is/are not located in Hong Kong & are not conducting Research Analysis in Hong Kong.
For U.S.
Motilal Oswal Financial Services Limited (MOFSL) is not a registered broker - dealer under the U.S. Securities Exchange Act of 1934, as amended (the"1934 act") and under applicable state laws in the
United States. In addition MOFSL is not a registered investment adviser under the U.S. Investment Advisers Act of 1940, as amended (the "Advisers Act" and together with the 1934 Act, the "Acts), and
under applicable state laws in the United States. Accordingly, in the absence of specific exemption under the Acts, any brokerage and investment services provided by MOFSL, including the products and
services described herein are not available to or intended for U.S. persons. This report is intended for distribution only to "Major Institutional Investors" as defined by Rule 15a-6(b)(4) of the Exchange Act
and interpretations thereof by SEC (henceforth referred to as "major institutional investors"). This document must not be acted on or relied on by persons who are not major institutional investors. Any
investment or investment activity to which this document relates is only available to major institutional investors and will be engaged in only with major institutional investors. In reliance on the exemption
from registration provided by Rule 15a-6 of the U.S. Securities Exchange Act of 1934, as amended (the "Exchange Act") and interpretations thereof by the U.S. Securities and Exchange Commission
("SEC") in order to conduct business with Institutional Investors based in the U.S., MOFSL has entered into a chaperoning agreement with a U.S. registered broker-dealer, Motilal Oswal Securities
International Private Limited. ("MOSIPL"). Any business interaction pursuant to this report will have to be executed within the provisions of this chaperoning agreement.
The Research Analysts contributing to the report may not be registered /qualified as research analyst with FINRA. Such research analyst may not be associated persons of the U.S. registered broker-dealer,
MOSIPL, and therefore, may not be subject to NASD rule 2711 and NYSE Rule 472 restrictions on communication with a subject company, public appearances and trading securities held by a research
analyst account.
For Singapore
In Singapore, this report is being distributed by Motilal Oswal Capital Markets (Singapore) Pte. Ltd. (“MOCMSPL”) (UEN 201129401Z), which is a holder of a capital markets services license and an exempt
financial adviser in Singapore.This report is distributed solely to persons who (a) qualify as “institutional investors” as defined in section 4A(1)(c) of the Securities and Futures Act of Singapore (“SFA”) or (b)
are considered "accredited investors" as defined in section 2(1) of the Financial Advisers Regulations of Singapore read with section 4A(1)(a) of the SFA. Accordingly, if a recipient is neither an “institutional
investor” nor an “accredited investor”, they must immediately discontinue any use of this Report and inform MOCMSPL .
In respect of any matter arising from or in connection with the research you could contact the following representatives of MOCMSPL. In case of grievances for any of the services rendered by MOCMSPL
write to
grievances@motilaloswal.com.
Nainesh Rajani
Email:
nainesh.rajani@motilaloswal.com
Contact: (+65) 8328 0276
.
Specific Disclosures
1 MOFSL, Research Analyst and/or his relatives does not have financial interest in the subject company, as they do not have equity holdings in the subject company.
2 MOFSL, Research Analyst and/or his relatives do not have actual/beneficial ownership of 1% or more securities in the subject company
3 MOFSL, Research Analyst and/or his relatives have not received compensation/other benefits from the subject company in the past 12 months
4 MOFSL, Research Analyst and/or his relatives do not have material conflict of interest in the subject company at the time of publication of research report
5 Research Analyst has not served as director/officer/employee in the subject company
6 MOFSL has not acted as a manager or co-manager of public offering of securities of the subject company in past 12 months
7 MOFSL has not received compensation for investment banking/ merchant banking/brokerage services from the subject company in the past 12 months
8 MOFSL has not received compensation for other than investment banking/merchant banking/brokerage services from the subject company in the past 12 months
9 MOFSL has not received any compensation or other benefits from third party in connection with the research report
10 MOFSL has not engaged in market making activity for the subject company
********************************************************************************************************************************
The associates of MOFSL may have:
-
financial interest in the subject company
-
actual/beneficial ownership of 1% or more securities in the subject company at the end of the month immediately preceding the date of publication of the Research Report or date of the public
appearance.
-
received compensation/other benefits from the subject company in the past 12 months
-
any other potential conflict of interests with respect to any recommendation and other related information and opinions.; however the same shall have no bearing whatsoever on the specific
recommendations made by the analyst(s), as the recommendations made by the analyst(s) are completely independent of the views of the associates of MOFSL even though there might exist an
inherent conflict of interest in some of the stocks mentioned in the research report.
-
acted as a manager or co-manager of public offering of securities of the subject company in past 12 months
August 2024
19
 Motilal Oswal Financial Services
India Strategy | Nifty P/E dissection
-
-
-
be engaged in any other transaction involving such securities and earn brokerage or other compensation or act as a market maker in the financial instruments of the company(ies) discussed herein or
act as an advisor or lender/borrower to such company(ies)
received compensation from the subject company in the past 12 months for investment banking / merchant banking / brokerage services or from other than said services.
Served subject company as its clients during twelve months preceding the date of distribution of the research report.
The associates of MOFSL has not received any compensation or other benefits from third party in connection with the research report
Above disclosures include beneficial holdings lying in demat account of MOFSL which are opened for proprietary investments only. While calculating beneficial holdings, It does not consider demat accounts
which are opened in name of MOFSL for other purposes (i.e holding client securities, collaterals, error trades etc.). MOFSL also earns DP income from clients which are not considered in above disclosures.
Analyst Certification
The views expressed in this research report accurately reflect the personal views of the analyst(s) about the subject securities or issues, and no part of the compensation of the research analyst(s) was, is,
or will be directly or indirectly related to the specific recommendations and views expressed by research analyst(s) in this report.
Terms & Conditions:
This report has been prepared by MOFSL and is meant for sole use by the recipient and not for circulation. The report and information contained herein is strictly confidential and may not be altered in any
way, transmitted to, copied or distributed, in part or in whole, to any other person or to the media or reproduced in any form, without prior written consent of MOFSL. The report is based on the facts, figures
and information that are considered true, correct, reliable and accurate. The intent of this report is not recommendatory in nature. The information is obtained from publicly available media or other sources
believed to be reliable. Such information has not been independently verified and no guaranty, representation of warranty, express or implied, is made as to its accuracy, completeness or correctness. All
such information and opinions are subject to change without notice. The report is prepared solely for informational purpose and does not constitute an offer document or solicitation of offer to buy or sell or
subscribe for securities or other financial instruments for the clients. Though disseminated to all the customers simultaneously, not all customers may receive this report at the same time. MOFSL will not
treat recipients as customers by virtue of their receiving this report.
Disclaimer:
The report and information contained herein is strictly confidential and meant solely for the selected recipient and may not be altered in any way, transmitted to, copied or distributed, in part or in whole, to
any other person or to the media or reproduced in any form, without prior written consent. This report and information herein is solely for informational purpose and may not be used or considered as an
offer document or solicitation of offer to buy or sell or subscribe for securities or other financial instruments. Nothing in this report constitutes investment, legal, accounting and tax advice or a representation
that any investment or strategy is suitable or appropriate to your specific circumstances. The securities discussed and opinions expressed in this report may not be suitable for all investors, who must make
their own investment decisions, based on their own investment objectives, financial positions and needs of specific recipient. This may not be taken in substitution for the exercise of independent judgment
by any recipient. Each recipient of this document should make such investigations as it deems necessary to arrive at an independent evaluation of an investment in the securities of companies referred to in
this document (including the merits and risks involved), and should consult its own advisors to determine the merits and risks of such an investment. The investment discussed or views expressed may not
be suitable for all investors. Certain transactions -including those involving futures, options, another derivative products as well as non-investment grade securities - involve substantial risk and are not
suitable for all investors. No representation or warranty, express or implied, is made as to the accuracy, completeness or fairness of the information and opinions contained in this document. The Disclosures
of Interest Statement incorporated in this document is provided solely to enhance the transparency and should not be treated as endorsement of the views expressed in the report. This information is subject
to change without any prior notice. The Company reserves the right to make modifications and alternations to this statement as may be required from time to time without any prior approval. MOFSL, its
associates, their directors and the employees may from time to time, effect or have effected an own account transaction in, or deal as principal or agent in or for the securities mentioned in this document.
They may perform or seek to perform investment banking or other services for, or solicit investment banking or other business from, any company referred to in this report. Each of these entities functions as
a separate, distinct and independent of each other. The recipient should take this into account before interpreting the document. This report has been prepared on the basis of information that is already
available in publicly accessible media or developed through analysis of MOFSL. The views expressed are those of the analyst, and the Company may or may not subscribe to all the views expressed
therein. This document is being supplied to you solely for your information and may not be reproduced, redistributed or passed on, directly or indirectly, to any other person or published, copied, in whole or
in part, for any purpose. This report is not directed or intended for distribution to, or use by, any person or entity who is a citizen or resident of or located in any locality, state, country or other jurisdiction,
where such distribution, publication, availability or use would be contrary to law, regulation or which would subject MOFSL to any registration or licensing requirement within such jurisdiction. The securities
described herein may or may not be eligible for sale in all jurisdictions or to certain category of investors. Persons in whose possession this document may come are required to inform themselves of and to
observe such restriction. Neither the Firm, not its directors, employees, agents or representatives shall be liable for any damages whether direct or indirect, incidental, special or consequential including lost
revenue or lost profits that may arise from or in connection with the use of the information.
The person accessing this information specifically agrees to exempt MOFSL or any of its affiliates or employees
from, any and all responsibility/liability arising from such misuse and agrees not to hold MOFSL or any of its affiliates or employees responsible for any such misuse and further agrees to hold MOFSL or any
of its affiliates or employees free and harmless from all losses, costs, damages,
expenses that may be suffered by the person accessing this information due to any errors and delays.
This report is meant for the clients of Motilal Oswal only.
Investment in securities market are subject to market risks. Read all the related documents carefully before investing.
Registration granted by SEBI and certification from NISM in no way guarantee performance of the intermediary or provide any assurance of returns to investors.
Registered Office Address: Motilal Oswal Tower, Rahimtullah Sayani Road, Opposite Parel ST Depot, Prabhadevi, Mumbai-400025; Tel No.: 022 - 71934200 / 71934263; www.motilaloswal.com.
Correspondence Address: Palm Spring Centre, 2nd Floor, Palm Court Complex, New Link Road, Malad (West), Mumbai- 400 064. Tel No: 022 71881000. Details of Compliance Officer: Neeraj Agarwal,
Email Id: na@motilaloswal.com, Contact No.:022-40548085.
Grievance Redressal Cell:
Contact Person
Contact No.
Email ID
Ms. Hemangi Date
022 40548000 / 022 67490600
query@motilaloswal.com
Ms. Kumud Upadhyay
022 40548082
servicehead@motilaloswal.com
Mr. Ajay Menon
022 40548083
am@motilaloswal.com
Registration details of group entities.: Motilal Oswal Financial Services Ltd. (MOFSL): INZ000158836 (BSE/NSE/MCX/NCDEX); CDSL and NSDL: IN-DP-16-2015; Research Analyst: INH000000412 . AMFI:
ARN .: 146822. IRDA Corporate Agent – CA0579. Motilal Oswal Financial Services Ltd. is a distributor of Mutual Funds, PMS, Fixed Deposit, Insurance, Bond, NCDs and IPO products.
Customer having any query/feedback/ clarification may write to query@motilaloswal.com. In case of grievances for any of the services rendered by Motilal Oswal Financial Services Limited (MOFSL) write to
grievances@motilaloswal.com, for DP to dpgrievances@motilaloswal.com.
August 2024
20