November 2024
India Strategy
BSE Sensex: 79,486
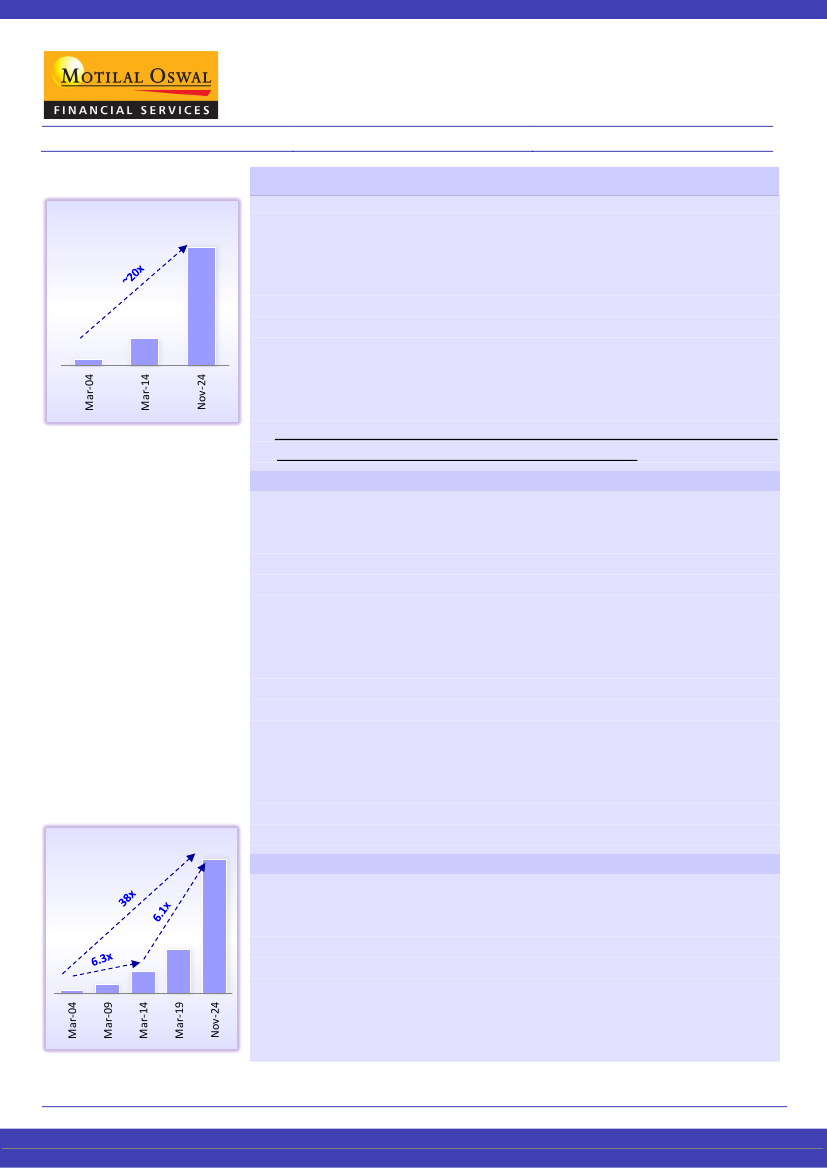
India listed market size
India market cap (USD t)
5.4
Nifty-50: 24,148
Embracing India’s Magnitude
1.2
0.3
An uncommon blend of size, growth, and diversity
Traditionally recognized for the secular growth potential, Indian equities are now
evolving, bringing fresh dimensions to the investment landscape with their
impressive size, diversity, and depth. India’s market capitalization has soared to an
impressive USD5.4t from USD1.2t in Mar’14, positioning it as the fifth-largest
market globally. Notably, smaller companies and emerging industry segments are
making substantial contributions across various sectors. Although the market is
currently experiencing a tactical breather – evidenced by a ~8% dip in the Nifty
index from its all-time high – we remain optimistic that the Indian equities will
deliver a healthy long-term compounding given the strength of corporate India’s
balance sheet and prospects of secular profitable growth.
In this report, we delve into a comprehensive analysis of the market capitalization of
Indian stocks over time, unveiling some noteworthy insights.
India’s investible universe enhances and offers wider choices to investors
India market cap growth
Listed market cap (INR t)
455
For a major portion of the 2010s, a primary concern among several large investors
was the limited investible universe of Indian equities, characterized by fewer
investible sectors, lower absolute size of companies, narrow sector breadth, and a
relatively smaller number of large-sized stocks with good depth. However, the last
five years have seen a remarkable transformation. The blazing growth in India’s
market capitalization, along with wider participation of multiple sectors and
smaller companies, as well as a wave of new issuances across sectors, has
effectively quelled many of these concerns. This evolution has paved the way for
diverse opportunities for investment across the market-cap curve and sub-sectors.
To illustrate, at present, India has
11 mega-sized companies
(~INR5t+ market
capitalization) vs. zero in 2014, with
5 companies having USD100b+
market
capitalization. The number of mid-sized companies (with market capitalization
between INR250b-INR1t) has more than quadrupled in 10 years from 50 to 209,
while the number of small-sized companies (with market cap between INR50b-
250b) stands at 466 vs. 128 in 2014. The
100
th
company (Lupin Ltd) and the 500
th
company (Symphony Ltd)
on the list today are
~8x and ~12x
bigger than the 100
th
company and the 500
th
company in 2014, respectively.
India's growing economic stature indicates a probable structural shift in global
capital allocation toward the country. As already listed Indian companies continue
to grow and new companies get listed, a sustainable cycle of discovery and value
appreciation is likely to unfold. Some of India’s mega-cap stocks (such as Reliance
Industries, HDFC Bank, and TCS) have been included in various
MSCI World
Indices.
We believe this list will expand over time, attracting interest and investments from
large, globally focused active funds. This influx should gradually enhance free float,
deepen market dynamics, and boost liquidity, paving the way for a more vibrant
Indian equity landscape.
Size does matter
12
31
75
151
Research Analyst: Gautam Duggad
(Gautam.Duggad@MotilalOswal.com) |
Abhishek Saraf
(Abhishek.saraf@MotilalOswal.com)
Research Analyst: Deven Mistry
(Deven@MotilalOswal.com) |
Aanshul Agarawal
(Aanshul.Agarawal@Motilaloswal.com)
Motilal Oswal research is available on www.motilaloswal.com/Institutional-Equities, Bloomberg, Thomson Reuters, Factset and S&P Capital.
Investors are advised to refer through important disclosures made at the last page of the Research Report.
 Motilal Oswal Financial Services
India Strategy | Embracing India’s Magnitude
Key ingredients in place for structural growth in the economy and markets
The foundation for high-quality secular growth in India is being laid through several
key factors: 1) robust development of physical and digital infrastructure; 2) the
continuation of investor- and business-friendly policies; 3) a thriving
entrepreneurial ecosystem; 4) the expansion of profit pools for smaller companies;
5) a sustained increase in domestic flows towards equities; 6) stable macro
indicators, as evidenced by better growth visibility, controlled inflation, and stable
twin balances, etc. This growth is further supported by various external tailwinds in
the form of a geopolitical shift in India’s favor, India emerging as a key alternative
in the China+1 imperative, a less volatile crude price regime, etc.
We reckon this combination of Size, Growth, and Diversity is relatively uncommon
in most global markets. Therefore, it should enable India to maintain its status as a
structurally significant market for an extended period.
Big, Bold, Boundless!
Key indices market cap (INR t)
Nifty50
Nifty Midcap 100
Nifty Smallcap100
196
84
45
12
3
16
5
64
22
Nov'24
Mar-14
Mar-19
Key observations from our study:
The Indian equity market achieved a significant milestone of USD5t in market
capitalization in May’24, with the latest print at
USD5.4t (INR455t) as of Nov’24.
India’s share in global market capitalization jumped to
4.3%
in Nov’24 from the
low of 1.6% in 2013, making it
the second highest among emerging markets.
Further, India’s rank in global market capitalization scaled up to 5th from 17th in
2004, and 10th in 2014.
India’s market capitalization has now reached levels
comparable to those of the US market in the early 1990s, China in 2014, Japan
in 2015, and Hong Kong in 2017.
Additionally, India’s weightage in the MSCI EM
Index had briefly surpassed that of China in Sep'24, rising to ~22% from ~7% in
2014. Although, after the recent rally, China has again assumed its leadership
position, while India has slipped a bit post its recent correction.
India has remained one of the fastest-growing equity markets during the past
decade.
Its market capitalization surged ~3x/6x/15x/38x
in the past 5/10/15/
20 years and achieved a remarkable size of USD5.4t (INR455t) in Nov’24.
The degree of expansion of the Indian markets can be gauged from the following:
The current market capitalization of the
largest Indian publicly listed company,
Reliance Industries, is ~INR18t, which is more than the total market
capitalization of the entire Indian equity market in 2005.
The
100
th
company
(Lupin) in the list today, with a market capitalization of
INR1t, is ~8x bigger than the 100
th
company in 2014. The
500
th
company
at
present, with a market capitalization of INR112b, is ~12x the size of its
counterparts in 2014.
The current market capitalization of ICICI Bank, the second-largest bank,
exceeds that of all private banks in 2016 and the entire banking sector in 2014.
The
top 10 companies,
valued at INR98t now (accounting for 22% of India’s
market capitalization), are larger than the entire market capitalization of India in
2016.
The
top 50 companies,
valued at INR214t now (accounting for ~47% of India’s
market capitalization), are more than the entire market capitalization of India in
2021 and ~3x bigger than India’s market capitalization in 2014.
November 2024
2
 Motilal Oswal Financial Services
India Strategy | Embracing India’s Magnitude
Cumulative DII flows outpace FIIs
Net FII (USDb)
160
121
47
8
CY07-20
*As of 6
th
Nov 2024
CY21-24YTD
The
top 100 companies,
valued at INR277t now (accounting for ~61% of India’s
market capitalization), are larger than the entire market capitalization of India in
2022 and ~4x that of India’s market capitalization in 2013-14.
The
key benchmark Indian indices
have witnessed a remarkable rally. The
market capitalization of the Nifty-50 /Nifty Midcap100/Nifty Smallcap100/ Nifty-
500 indices jumped 4.3x/5.4x/8.1x/5.8x to INR196t/INR64t/INR22t/INR404t/ in
the past 10 years (at a CAGR of 15%/17%/22%/18%).
Snowballing into giants:
In its journey to a market capitalization of USD5.4t, the
Indian equity market has seen the ascent of several giants. India now has 11
mega-sized companies with a market capitalization of over INR5t each (vs. none
in 2014), 87 large-sized companies with market capitalization between INR1t
and INR5t (vs. 16 companies in 2014), 209 mid-sized companies with a market
capitalization of INR250b-1t (vs. 50 in 2014), and 466 small-sized companies
with a market capitalization in the range of INR50b-250b (vs. 128 in 2014).
Private companies continue to dominate:
The market capitalization of private
listed companies jumped 6.4x to INR384t, whereas that of PSUs surged 5x to
INR72t in the last 10 years. While private companies have continued to lead,
PSUs have seen a strong revival between CY22 and CY24YTD, with their market
contribution improving to 16% in 2024 from 10% in 2021-22.
Broad-based expansion in market capitalization:
Banks (Pvt+PSBs) topped with
the highest market capitalization of ~INR51t, followed by Technology (INR44t).
Among the other largest market-cap sectors, Capital Goods, NBFCs, Consumer,
Oil & Gas, Automobile and Healthcare sectors jumped 6-10x to ~INR30-37t each
as of Nov’24, collectively accounting for 43% of India’s market capitalization (vs.
46% in Mar’14). Conversely, other sectors, such as Chemicals, Telecom, Retail ,
Insurance, Cement, and Real Estate surged 5-18x to reach INR10-13t each as of
Nov’24, collectively accounting for 13% of the total listed market capitalization
(vs. 10% in Mar’14).
Upsurge of new-age businesses:
The number of new-age and e-
commerce/Platform listed companies has grown to 29 in CY24 from just five in
2014, signifying a healthy business environment for startups in India. Their
combined market capitalization is up from ~INR178b in Mar’14 to ~INR4.8t in
Nov’24. This vibrant ecosystem of startups should be a supply pool of future
listed companies, thereby helping India’s investible universe to expand.
Mid- and small-sized companies leading from the front:
Over the past 10 years
(Oct’14-Oct’24), the Nifty-50 clocked a 11% CAGR, the midcap index posted an
17% CAGR, and the smallcap index reported a 14% CAGR. Notably, the
market
capitalization of these indices
clocked a CAGR of 15%/17%/22%. Increased
retail participation and rising SIP flows in mid- and smallcap mutual funds in the
last 2-3 years have resulted in these indices outperforming largecaps by a wide
margin. The Nifty-50/Midcap100/Smallcap100 indices clocked a CAGR of
16%/28%/27% in the past five years, while their market capitalization clocked a
CAGR of 17%/28%/30%.
Domestic flows driving markets to new highs:
Cumulative DII inflows into Indian
equities are ~16x higher than FII flows during CY21-CY24YTD. Net DII investment
during CY21-24YTD is 2.6x the amount invested during CY07-20 (14 years).
Buoyant capital markets and retail participation also attracted a flurry of new
listings, which further added to the size of the India market. Notably, the
3
November 2024
 Motilal Oswal Financial Services
India Strategy | Embracing India’s Magnitude
number of large IPOs between FY15-25YTD jumped to ~1,450 (vs. ~500 between
FY05 and FY14). Total funds raised (IPO+FPO+ OFS+QIP) during FY2015-25YTD
stand at INR12t (vs. ~INR4t between FY05-14), while funds raised during FY20-
25YTD accounted for over ~68% of total funds mobilized during the past 10
years.
Strong business environment and corporate earnings propel growth
Growth in the Indian equity market has been backed by
resilient and strong macro
and microeconomic
performances.
The decade (2014-2024) started with a sluggish business environment, a policy
paralysis, a weak banking sector, a tough phase of the PSU earnings cycle, and
multiple regulatory shocks but also benefited from lower inflation, strong trends of
formalization and digitization, political stability, the government’s infrastructure
and capex push, a cleaner corporate balance sheet, improved governance,
margin tailwinds for commodities, and burgeoning order books.
India’s nominal GDP grew at a ~CAGR of 10% during 2014-24 and stood at INR295t
(i.e., USD3.6t) in FY24, while the corporate earnings of listed companies grew at a
CAGR of 14% and stood at INR15t (USD178b) in FY24.
View:
India is one of the fastest-growing economies and set to become the
third-largest economy in the next few years. In addition, it is also the fastest-
growing equity market post-Covid. Its considerably large size and diverse
sectoral offerings place India among the key equity markets globally.
While the equity markets continue to reach new highs, so do the underlying
corporate earnings. Over the past 1/3/5/10 years, the Nifty-50 clocked a CAGR
of 27%/11%/15%/11%, while its earnings remained equally impressive, clocking
a CAGR of 26%/ 25%/18%/12% to reach INR7.9t in FY24. In addition, the NSE-
500 delivered a profit CAGR of 20%/21%/16%/11% to INR14.1t in FY24. Notably,
the NSE-500 profit-to-GDP ratio climbed up to a 15-year high of 4.8% in FY24.
We expect the earnings trajectory to remain largely intact, albeit the magnitude
of its growth is expected to moderate to 12-14% CAGR over FY24-26 with some
interim but short lived slowdown as currently witnessed in 2QFY25. In addition,
the Nifty P/E remains marginally above its 10-year average, which is likely to
maintain this level going forward (as emphasized in our recent note on
Nifty P/E
dissection).
Given the expected pace of high-teen earnings growth and sustained valuation
multiples, we expect India’s market capitalization to double over the next five-
six years to reach ~USD10t.
We remain constructive on the Indian markets and currently prefer largecap
stocks, as the valuations of mid- and smallcap indices are trading at a premium
of 46% and 14% to Nifty-50, respectively. We remain positive on the BFSI, IT,
Healthcare, and Real Estate sectors and remain underweight on Auto, Energy
and Metals within our
model portfolio.
MOFSL top ideas: Largecaps
– ICICI Bank, HDFC Bank, SBI, Bharti Airtel, HUL,
HCL Tech, L&T, M&M, Power Grid, Titan, and Mankind Pharma;
Midcaps and
Smallcaps:
Indian Hotels, Persistent Systems, Dixon Tech, Cummins India,
Godrej Properties, Metro Brands, Global Health, Angel One, PNB Housing, Cello
World, and Coforge.
4
Ascent to the big league
Note:
We have defined large-,
mid- and small-sized
companies based on the
market cap as of that year and
not as per the SEBI
classification. Defined market
cap range of large-sized
companies: above INR1t; mid-
sized: INR250b-1t; and small-
sized: INR50-250b.
November 2024
 Motilal Oswal Financial Services
India Strategy | Embracing India’s Magnitude
Exhibit 1:
India’s market capitalization scaled USD5t in May’24 and stood at USD5.4t in Nov’24
USD 5.4t
USD 5t
USD 4t
USD 3t
USD 2t
USD 1t
417
455
335
219
41
130
Jul-17
64.5
May-21
73.0
Nov-23
83.3
May-24
83.3
Nov-24
84.3
May-07
USD : INR
40.2
Exhibit 2: Key parameters underscoring this astounding growth
Real GDP
Nominal GDP rank
Forex
India market cap
Global market cap rank
No. of DMAT account (million)
Average cash volumes
Average F&O volumes
FII/DII flows (annual)
Average Monthly SIPs (INR b)
India market cap (INR t)
Top-500 (INR t)
Contribution (%)
Top-100 (INR t)
Contribution (%)
Top-50 (INR t)
Contribution (%)
Top-10 (INR t)
Contribution (%)
Economy
Market and flows
Market caps
2014
6.4% (INR98t)
10th
USD304b
USD1.2t
10th
22m
INR133b
INR2t
USD16.2b/-USD4.9b
12b
75
72
96%
57
77%
47
63%
22
30%
2024
8.2% (INR174t) in FY24
5th
USD685b
USD5.4t
5th
180m
INR1.4t (FY25YTD)
INR458t (FY25YTD)
USD-0.6b/USD54bYTD
220b+
455
412
90%
277
61%
214
47%
98
22%
Exhibit 3: Midcaps and smallcaps witnessed faster market cap gains than largecaps in the last five years (INR t)
Mar-14
Mar-19
Nov'24
404
196
45
84
12
Nifty50
16
64
3
5
69
141
22
Nifty Midcap 100
Nifty Smallcap100
Nifty 500
November 2024
5
 Motilal Oswal Financial Services
India Strategy | Embracing India’s Magnitude
Snowballing into giants!
In its journey to a market capitalization of USD5.4t, the Indian equity market has
seen the ascent of several giants.
Emergence of mega-sized (above INR5t):
The number of companies with
market capitalization of over INR5t was 11 in Nov’24 vs. zero 10 years ago. The
total market capitalization of these companies rose to INR100t vs. nil in Mar’14.
Large-sized (INR1t-INR5t) on a roll:
The number of companies in the market
capitalization range of INR1t to INR5t has jumped ~5x to 87 from 16 during the
same period. Financials (Pvt. Banks and NBFCs), Capital Goods, Healthcare,
Utilities, and Automobile witnessed the maximum rise in the INR1t market-cap
companies in the past decade. The total market capitalization of these
companies surged ~6x to INR190t in Nov’24 from INR30t in Mar’14.
Mid-sized (INR250b-1tn) rise sharply:
The number of companies in the market
capitalization range of INR250b-INR1t surged ~4x to 209 in Nov’24 from 50 in
2014. Financials (NBFCs), Healthcare, Automobiles, Chemicals, and Capital
Goods witnessed the highest increase in the number of mid-sized companies.
Total market capitalization of these companies jumped ~5x to INR104t in Nov’24
from INR22t in Mar’14.
Small-sized (INR50b-250b) pool expands:
The number of companies with a
market capitalization range of INR50-250b jumped ~4x to 466 in Nov’24 vs. 128
in 2014. Capital Goods, Financials (NBFCs), Healthcare, Chemicals, and
Technology experienced the highest addition in small-sized companies. The total
market capitalization of these companies surged ~4x to INR54t in Nov’24 from
INR13t in Mar’14.
Exhibit 5:
Market cap of the top 500 companies surged to
INR412t in 2024 from INR72t in 2014 (INR t)
Top 500 market cap(INR t)
412
Exhibit 4:
The number of companies with market cap range
>5t/1-5t/500b-1t jumped to 11/87/89 in 2024 (INR t)
FY14
FY19
Nov'24
87
89
27
0
3
11
16
15
29
72
144
Above INR5t
Between INR 1-5t
Between INR500b-1t
FY14
FY19
Nov'24
November 2024
6
 Motilal Oswal Financial Services
India Strategy | Embracing India’s Magnitude
Insightful trends
Exhibit 6:
While, Financials, Technology, Capital Goods, and Automobile topped in overall market cap; E-com, Retail,
Chemicals, Cons. Durables, and Real Estate witnessed the highest jump in market cap over the past decade (INR t)
44
37
36
35
32
32
16
31
16
9
5
7
67
29
22
20
34
3
16
6
1
13
4
13
33
1
13
4
0
13
3
Sector wise listed market caps (INR t)
Mar'14
Mar'19
Nov'24
17
10
14
4
6
4
17
6
10
8
5
10
24
10
12
12
8
02
6
00
5
01
4
012 111
Exhibit 7:
NBFCs (Financials) and Consumer experienced the maximum rise in the number of companies above INR1t market
cap
22
Number of companies with market cap above INR1t
Mar'14
Mar'19
Nov'24
9
4
2
4
8
1 1
9
9
9
6
2
2
7
3
4
0
7
2
3
5
0
1
1 1
1 1
1
3
0
1
3
0 0
2
0 0
2
1 1 1
0 0
2
Exhibit 8:
NBFCs, Healthcare, and Automobiles witnessed the maximum rise in mid-sized companies (market cap of INR250b
to INR1t)
45
Number of companies with market cap above INR250b and below INR1t
Mar'14
Mar'19
Nov'24
24
22
8
8
19
5
17
2 3
0 2
14
1 2
13
6
3
8
5
10
3 3
9
5
9 11
5 4 7
0 2
7
1 1
7
0 1
6
2 0 4 4 4 4 1 3 4 3 2 4 0 0 3 0 0 2
November 2024
7
 Motilal Oswal Financial Services
India Strategy | Embracing India’s Magnitude
Exhibit 9:
Capital Goods and NBFCs topped within small-sized companies (INR50-250b); Utilities and O&G remained flat
63
47
43
33
22
9
Number of companies with market cap above INR50b and below INR250b
Mar'14
Mar'19
Nov'24
37
18
13
36
29
9
28
18
10
20
4
9
35
20
20
15
10
1
19
4
2
5
15
1
4
14
3
9 11
10
22
7
8 10 8
6 8
56
3 4 4 213
3
1
7
12
2
23
Midcap and smallcap companies expanding
While large caps grew faster during the CY14-19 period,
midcaps and smallcaps
led from the front and grew faster than the largecaps during CY19-CY24YTD.
Rising retail participation, a smaller base effect, and earnings revival led to a
significant broad-basing of the market, with a rally in mid- and smallcap stocks and
driving a sharp reduction in the market cap contribution for the large caps.
The market capitalization of the
top 10 companies
has increased 4.4x to INR98t,
while their contribution has dropped to 22% from 30% in 2014. Similarly, the
market capitalization of the
top 50 companies
has grown 4.5x to INR214t in the
past decade; however, their contribution to the overall listed universe has fallen
to 47% from 63% in 2014. The market capitalization of the
top 500 companies
grew 6x to ~INR412t in Nov’24 (vs. INR72t in Mar’14), while its share in total
market capitalization reduced to ~90% in Nov’24 (vs. ~96% in Mar’14) – implying a
greater share of the smaller companies.
Notably, the
101 to 1,000
th
companies by market capitalization surged ~10x in
market capitalization to INR165t (vs. INR16t in Mar’14), with their contribution in
total market capitalization increasing to ~35% in Nov’24 from ~21% in Mar’14,
highlighting an impressive broad basing.
Exhibit 11:
…while their contribution contracted to 61% and
expanded to 36%, respectively
77
Contribution (%)
71
61
165
Top 100
101 to 1000th
Exhibit 10:
Market cap of top 100 jumped ~5x, and 101 to
1,000
th
companies surged ~10x in the past 10 years…
Market cap (INR t)
Top 100
101 to 1000th
277
108
57
16
Mar'14
42
Mar'19
Nov'24
22
28
36
Mar'14
Mar'19
Nov'24
November 2024
8
 Motilal Oswal Financial Services
India Strategy | Embracing India’s Magnitude
Private companies dominate, while PSUs make a strong comeback
Private firms continue to dominate the Indian equity markets:
During the last 10
years, the market capitalization of private listed companies jumped 6.4x to
INR384t, whereas that of PSUs rose 5x to INR72t (however, down from Oct’24
highs of ~INR80t).
While private companies continue to lead, PSUs have posted a strong revival,
especially during FY22-24, with their market cap contribution growing from 11% in
2021-22 to 16% in 2024 (down from Oct’24 highs of 18%).
In the listed universe, only 110 companies are traded PSUs. Due to the cyclical
nature of most of the PSU businesses, they command lower valuations and hence
have a relatively lower market capitalization vs. private peers.
Exhibit 13:
PSUs’ market cap contribution witnessed
improvement over the last five years
Market cap contribution (%)
72
20%
15%
PSUs
Pvt.+MNC
16%
Exhibit 12:
PSU/Pvt+MNC listed market cap jumped 5x/6.4x
over the past decade
PSUs
Pvt.+MNC
Market cap (INR t)
384
22
15
60
Mar'14
130
Mar'19
Nov'24
80%
85%
84%
Mar'14
Mar'19
Nov'24
Dominance of domestic flows continues to intensify
During CY07-20, FIIs invested about USD160b in Indian markets, while DIIs invested
USD47b. Hence, FII flows were ~3x higher than DII flows during the 14-year period.
The barometer to assess the health of Indian equity markets through FII flows has
seen a significant shift in recent years. Rising awareness about equity investing, the
financialization of savings, and digitization have attracted domestic investors to
equity investing. The continuous rise in retail participation, as visible in demat
account additions, and expanding SIP flows have resulted in strong DII flows into
Indian equities. The number of demat accounts has touched ~180m vs. just 22m a
decade ago. Monthly SIP flows have now more than INR240b vs. INR10b a decade
ago.
Notably, during CY21-CY24YTD, DII flows into Indian equities have been 16x higher
than FII flows. DII investment during CY21-24YTD is twice that of the amount
invested during CY07-20 (over a 14-year period). DII flows have hit an all-time high
of USSD54.8b in CY24YTD (as of 6
th
Nov’24), led by buoyant retail participation,
while FII participation has remained flat after the record selling in Oct’24.
November 2024
9
 Motilal Oswal Financial Services
India Strategy | Embracing India’s Magnitude
Exhibit 14:
FII flows were volatile in the past three years…
Net FII (USD b)
18
18
29
25
20
23
16
3
-1
-12
USD 160b
Exhibit 15:
…while DII flows remained strong and resilient
Net DII (USD b)
USD 47b
32
17
6
5
-5
6
-5
10
5
14 16
6
-5
12
54.8
22
USD 8b
21
4
-0.6
14
3
8
-5
-17
USD 121b
-11 -13
Reducing impact of primary market to overall market cap size
Buoyant capital markets
have allowed several large corporates to explore fund
raising through primary/secondary markets, leading to further additions in
market capitalization over the past three years. Total fund raised (IPO+FPO+
OFS+QIP) during FY15-25YTD stood at INR12t (vs. ~INR4t between FY05 and
FY14), whereas fund raising during FY20-25YTD accounted for over ~68% of total
fund mobilized during the past 10 years. Notably, the number of IPOs between
FY15-25YTD jumped to ~1,450 (vs. ~500 between FY05 and FY14).
Though the market capitalization continues to hit new highs, the contribution of
new listings has continued to moderate in the past three years. Notably, the
number of new listings (IPOs) between USD1t and USD2t market capitalization
was 592, whereas that between USD4t and USD5t market capitalization was just
~250. Going by the ongoing trends, we can expect every incremental trillion
addition to be achieved by fewer listings.
Exhibit 16:
Contribution of new listings to the total listed market cap has moderated from the FY22 highs, however witnesses
an uptick in Oct’24
India Mkt Cap (INR t)
4.1
2.0
1.1
0.2
0.1
0.6
1.0
1.0
2.7
2.0
Contribution through new listing (%)
1.6
1.8
75
FY14
102
FY15
95
FY16
122
FY17
144
FY18
152
FY19
114
FY20
205
FY21
265
FY22
260
FY23
389
FY24
455
Current
November 2024
10
 Motilal Oswal Financial Services
India Strategy | Embracing India’s Magnitude
Valuations for the broader market at a significant premium
The market cap-to-GDP ratio stands at a multi-year high of 139%, at a significant
premium to its average of 85%. A consistent rally in equities has pushed the
valuations to an elevated level in certain pockets, especially in the mid- and
smallcap categories.
While the Nifty-50 trades near its 10-year average valuations, mid- and smallcap
stocks trade at a significant premium to largecaps and their historic averages.
Increased retail participation, supporting underlying earnings growth, and
expected interest rate cuts could keep the valuations high for the near future.
Exhibit 17:
Market capitalization-to-GDP ratio sustains above its long-term average, highlighting the optimism built-in
GFC: Peak of 149%
in Dec’07
Nominal GDP growth in
FY24/FY25E: 9.6%/10.8%
Lowest since
the GFC
132
139
105
84
84
56
97
103 113
90
Average of 85% for the period
71
64
66
82
69
79
84
80
57
96
Exhibit 18:
Large caps’ market cap-to-
GDP at an all-time high
Large caps market cap to GDP (%)
85
80
85
78
Average 63%
74
7368
66
60
54 51 50555757
49
45
43
Exhibit 19:
Mid caps’ market cap-to-
GDP at an all-time high
Mid caps market cap to GDP (%)
Average 13%
14
13 13
12 13 13
12
10
10 9 9
9
6
26
24
Exhibit 20:
Small caps’ market cap-to-
GDP at an all-time high
Small caps market cap to GDP (%)
Average 12%
12
5
13
10 8 11 10
1614
12
5
28
23
17 16
18
1110
8
6 7
Exhibit 21:
Contribution of top 100
companies’ (% to total market cap)
86.0
78.0
70.0
62.0
54.0
Exhibit 22:
Contribution of 101-250
companies’ (% to total market cap)
22.0
19.0
16.0
13.0
Exhibit 23:
Contribution of 251 onwards
companies’ (% to total market cap)
22.0
18.5
15.0
11.5
8.0
Market cap contribution (%)
18.9
20.2
60.8
10.0
November 2024
11
 Motilal Oswal Financial Services
India Strategy | Embracing India’s Magnitude
Exhibit 24:
Nifty-50’s 12-month forward P/E has been trading near its LPA, while Mid and small caps trading at a premium
38
32
26
20
14
8
Nov'14-Nov'24 P/E(x)
Nifty50 avg : 20.5x
Midcap avg : 22.1x
Smallcap avg : 16.0x
Nifty50 PE (x)
Nifty Midcap100 PE (x)
Nifty Smallcap100 PE (x)
Nifty50 trade at a premium
30.1
23.8
20.6
Mid caps trade at a significant premium to large caps; small cap
valuation also outpaced that of large caps in the past one year
ANNEXURE
Exhibit 25:
Market cap of top 10 companies grew faster over FY14-19, while slower over FY19-24 w.r.t. the broader universe
Company
TCS
Reliance Ind.
ITC
ONGC
Infosys
Coal India
HDFC Bank
ICICI Bank
St Bk of India
HDFC
Top-15 total (INR t)
Total listed mar cap (INR t)
Contribution (%)
FY14 Mcap
(INR t)
4.2
3.0
2.8
2.7
1.9
1.8
1.8
1.4
1.4
1.4
22
74
30
Company
Reliance Ind.
TCS
HDFC Bank
Hind. Unilever
ITC
HDFC
Infosys
St Bk of India
ICICI Bank
Kotak Bank
FY19 Mcap
(INR t)
8.6
7.5
6.3
3.7
3.6
3.4
3.2
2.9
2.6
2.5
44
152
29
Company
Reliance Industr
TCS
HDFC Bank
Bharti Airtel
ICICI Bank
St Bk of India
Infosys
ITC
Life Insurance
Hind. Unilever
Nov’24 Mcap
(INR t)
17.9
15.0
13.4
9.6
9.2
7.6
7.6
6.0
6.0
5.9
98
455
22
November 2024
12
 Motilal Oswal Financial Services
India Strategy | Embracing India’s Magnitude
Exhibit 26:
Market cap contribution of top 50 companies to the overall listed universe has witnessed a continuous decline
FY14 Mcap
(INR t)
TCS
4.2
Reliance Industr
3.0
ITC
2.8
ONGC
2.7
Infosys
1.9
Coal India
1.8
HDFC Bank
1.8
ICICI Bank
1.4
St Bk of India
1.4
HDFC
1.4
Wipro
1.3
Hind. Unilever
1.3
Bharti Airtel
1.3
Tata Motors
1.2
Sun Pharma.Inds.
1.2
Larsen & Toubro
1.2
NTPC
1.0
HCL Technologies
1.0
Axis Bank
0.7
IOCL
0.7
Cairn India
0.6
M&M
0.6
Bajaj Auto
0.6
UltraTech Cem.
0.6
Kotak Mah. Bank
0.6
Maruti Suzuki
0.6
Vedanta
0.6
NMDC
0.6
Power Grid Corpn
0.5
Hindustan Zinc
0.5
Asian Paints
0.5
Nestle India
0.5
BHEL
0.5
GAIL (India)
0.5
Vodafone Idea
0.5
Hero Motocorp
0.5
Dr Reddy's Labs
0.4
Lupin
0.4
Tech Mahindra
0.4
Adani Enterp.
0.4
Adani Ports
0.4
Indus Towers
0.4
United Spirits
0.4
Tata Steel
0.4
Bosch
0.3
BPCL
0.3
DLF
0.3
Dabur India
0.3
Ambuja Cements
0.3
Bank of Baroda
0.3
Top50 (INR t)
47
Total listed market cap ex-Nifty-50 (INR t)
75
Contribution (%)
63
Company
Company
Reliance Industr
TCS
HDFC Bank
Hind. Unilever
ITC
HDFC
Infosys
St Bk of India
ICICI Bank
Kotak Mah. Bank
Maruti Suzuki
ONGC
Axis Bank
Larsen & Toubro
Bajaj Finance
Wipro
IOCL
HCL Technologies
Coal India
Asian Paints
NTPC
Bharti Airtel
Hindustan Zinc
Sun Pharma.Inds.
Bajaj Finserv
UltraTech Cem.
IndusInd Bank
Nestle India
Power Grid Corpn
Titan Company
Avenue Super.
BPCL
Bajaj Auto
M&M
GAIL (India)
Adani Ports
HDFC Life Insur.
Tech Mahindra
Britannia Inds.
Dabur India
JSW Steel
Godrej Consumer
Vedanta
Shree Cement
Yes Bank
Pidilite Inds.
Bandhan Bank
Tata Steel
Indus Towers
SBI Life Insuran
FY19 Mcap
(INR t)
8.6
7.5
6.3
3.7
3.6
3.4
3.2
2.9
2.6
2.5
2.0
2.0
2.0
1.9
1.7
1.5
1.5
1.5
1.5
1.4
1.3
1.3
1.2
1.1
1.1
1.1
1.1
1.1
1.0
1.0
0.9
0.9
0.8
0.8
0.8
0.8
0.8
0.8
0.7
0.7
0.7
0.7
0.7
0.6
0.6
0.6
0.6
0.6
0.6
0.6
87
152
57
Company
Reliance Industr
TCS
HDFC Bank
Bharti Airtel
ICICI Bank
St Bk of India
Infosys
ITC
Life Insurance
Hind. Unilever
Larsen & Toubro
HCL Technologies
Sun Pharma.Inds.
Bajaj Finance
NTPC
M&M
Axis Bank
Maruti Suzuki
Adani Enterp.
Kotak Mah. Bank
ONGC
UltraTech Cem.
Tata Motors
Power Grid Corpn
Adani Ports
Wipro
Hind.Aeronautics
Titan Company
Bajaj Auto
Bajaj Finserv
Asian Paints
Adani Green
Coal India
Avenue Super.
Siemens
Trent
JSW Steel
Adani Power
Zomato Ltd
Bharat Electron
Nestle India
Hindustan Zinc
Jio Financial
DLF
IOCL
IRFC
Varun Beverages
Tata Steel
Vedanta
Grasim Inds
Nov’24 Mcap
(INR t)
17.9
15.0
13.4
9.6
9.2
7.6
7.6
6.0
6.0
5.9
5.0
5.0
4.4
4.3
4.0
3.6
3.6
3.6
3.5
3.5
3.4
3.3
3.1
3.0
3.0
3.0
2.9
2.8
2.8
2.8
2.8
2.7
2.7
2.6
2.5
2.5
2.5
2.4
2.3
2.2
2.2
2.2
2.1
2.0
2.0
2.0
1.9
1.9
1.9
1.8
214
455
47
Investment in securities market are subject to market risks. Read all the related documents carefully before investing
November 2024
13
 Motilal Oswal Financial Services
India Strategy | Embracing India’s Magnitude
NOTES
November 2024
14
 Motilal Oswal Financial Services
India Strategy | Embracing India’s Magnitude
Explanation of Investment Rating
Investment Rating
BUY
SELL
NEUTRAL
UNDER REVIEW
NOT RATED
Expected return (over 12-month)
>=15%
< - 10%
> - 10 % to 15%
Rating may undergo a change
We have forward looking estimates for the stock but we refrain from assigning recommendation
*In case the recommendation given by the Research Analyst is inconsistent with the investment rating legend for a continuous period of 30 days, the Research Analyst shall within following 30 days take
appropriate measures to make the recommendation consistent with the investment rating legend.
Disclosures:
The following Disclosures are being made in compliance with the SEBI Research Analyst Regulations 2014 (herein after referred to as the Regulations).
Motilal Oswal Financial Services Ltd. (MOFSL) is a SEBI Registered Research Analyst having registration no. INH000000412. MOFSL, the Research Entity (RE) as defined in the Regulations, is engaged in
the business of providing Stock broking services, Depository participant services & distribution of various financial products. MOFSL is a listed public company, the details in respect of which are available on
www.motilaloswal.com.
MOFSL (erstwhile Motilal Oswal Securities Limited - MOSL) is registered with the Securities & Exchange Board of India (SEBI) and is a registered Trading Member with National Stock
Exchange of India Ltd. (NSE) and Bombay Stock Exchange Limited (BSE), Multi Commodity Exchange of India Limited (MCX) and National Commodity & Derivatives Exchange Limited (NCDEX) for its stock
broking activities & is Depository participant with Central Depository Services Limited (CDSL) National Securities Depository Limited (NSDL),NERL, COMRIS and CCRL and is member of Association of
Mutual Funds of India (AMFI) for distribution of financial products and Insurance Regulatory & Development Authority of India (IRDA) as Corporate Agent for insurance products. Details of associate entities of
Motilal Oswal Financial Services Ltd. are available on the website at
http://onlinereports.motilaloswal.com/Dormant/documents/Associate%20Details.pdf
Details of pending Enquiry Proceedings of Motilal Oswal Financial Services Limited are available on the website at
https://galaxy.motilaloswal.com/ResearchAnalyst/PublishViewLitigation.aspx
MOFSL, it’s associates, Research Analyst or their relatives may have any financial interest in the subject company. MOFSL and/or its associates and/or Research Analyst or their relatives may have actual
beneficial ownership of 1% or more securities in the subject company at the end of the month immediately preceding the date of publication of the Research Report or date of the public appearance.
MOFSL
and its associate company(ies), their directors and Research Analyst and their relatives may have any other potential conflict of interests at the time of publication of the research report or at the time of public
appearance, however the same shall have no bearing whatsoever on the specific recommendations made by the analyst(s), as the recommendations made by the analyst(s) are completely independent of the
views of the associates of MOFSL even though there might exist an inherent conflict of interest in some of the stocks mentioned in the research report.
In the past 12 months, MOFSL or any of its associates may have:
a)
received any compensation/other benefits from the subject company of this report
b)
managed or co-managed public offering of securities from subject company of this research report,
c)
received compensation for investment banking or merchant banking or brokerage services from subject company of this research report,
d)
received compensation for products or services other than investment banking or merchant banking or brokerage services from the subject company of this research report.
MOFSL and it’s associates have not received any compensation or other benefits from the subject company or third party in connection with the research report.
Subject Company may have been a client of MOFSL or its associates during twelve months preceding the date of distribution of the research report.
Research Analyst may have served as director/officer/employee in the subject company.
MOFSL and research analyst may engage in market making activity for the subject company.
MOFSL and its associate company(ies), and Research Analyst and their relatives from time to time may have:
a) a long or short position in, act as principal in, and buy or sell the securities or derivatives thereof of companies mentioned herein.
(b) be engaged in any other transaction involving such securities and earn brokerage or other compensation or act as a market maker in the financial instruments of the company(ies) discussed herein or act
as an advisor or lender/borrower to such company(ies) or may have any other potential conflict of interests with respect to any recommendation and other related information and opinions.; however the same
shall have no bearing whatsoever on the specific recommendations made by the analyst(s), as the recommendations made by the analyst(s) are completely independent of the views of the associates of
MOFSL even though there might exist an inherent conflict of interest in some of the stocks mentioned in the research report.
Above disclosures include beneficial holdings lying in demat account of MOFSL which are opened for proprietary investments only. While calculating beneficial holdings, It does not consider demat accounts
which are opened in name of MOFSL for other purposes (i.e holding client securities, collaterals, error trades etc.). MOFSL also earns DP income from clients which are not considered in above disclosures.
To enhance transparency, MOFSL has incorporated a Disclosure of Interest Statement in this document. This should, however, not be treated as endorsement of the views expressed in the report. MOFSL
and / or its affiliates do and seek to do business including investment banking with companies covered in its research reports. As a result, the recipients of this report should be aware that MOFSL may have a
potential conflict of interest that may affect the objectivity of this report.
Terms & Conditions:
This report has been prepared by MOFSL and is meant for sole use by the recipient and not for circulation. The report and information contained herein is strictly confidential and may not be altered in any
way, transmitted to, copied or distributed, in part or in whole, to any other person or to the media or reproduced in any form, without prior written consent of MOFSL. The report is based on the facts, figures
and information that are considered true, correct, reliable and accurate. The intent of this report is not recommendatory in nature. The information is obtained from publicly available media or other sources
believed to be reliable. Such information has not been independently verified and no guaranty, representation of warranty, express or implied, is made as to its accuracy, completeness or correctness. All such
information and opinions are subject to change without notice. The report is prepared solely for informational purpose and does not constitute an offer document or solicitation of offer to buy or sell or
subscribe for securities or other financial instruments for the clients. Though disseminated to all the customers simultaneously, not all customers may receive this report at the same time. MOFSL will not treat
recipients as customers by virtue of their receiving this report.
Analyst Certification
The views expressed in this research report accurately reflect the personal views of the analyst(s) about the subject securities or issues, and no part of the compensation of the research analyst(s) was, is, or
will be directly or indirectly related to the specific recommendations and views expressed by research analyst(s) in this report.
Disclosure of Interest Statement
Companies where there is interest
Analyst ownership of the stock
No
A graph of daily closing prices of securities is available at
www.nseindia.com, www.bseindia.com.
Research Analyst views on Subject Company may vary based on Fundamental research and Technical
Research. Proprietary trading desk of MOFSL or its associates maintains arm’s length distance with Research Team as all the activities are segregated from MOFSL research activity and therefore it can have
an independent view with regards to subject company for which Research Team have expressed their views.
Regional Disclosures (outside India)
This report is not directed or intended for distribution to or use by any person or entity resident in a state, country or any jurisdiction, where such distribution, publication, availability or use would be contrary to
law, regulation or which would subject MOFSL & its group companies to registration or licensing requirements within such jurisdictions.
For Hong Kong:
This report is distributed in Hong Kong by Motilal Oswal capital Markets (Hong Kong) Private Limited, a licensed corporation (CE AYY-301) licensed and regulated by the Hong Kong Securities and Futures
Commission (SFC) pursuant to the Securities and Futures Ordinance (Chapter 571 of the Laws of Hong Kong) “SFO”. As per SEBI (Research Analyst Regulations) 2014 Motilal Oswal Financial Services
Limited (SEBI Reg No. INH000000412) has an agreement with Motilal Oswal capital Markets (Hong Kong) Private Limited for distribution of research report in Hong Kong. This report is intended for
distribution only to “Professional Investors” as defined in Part I of Schedule 1 to SFO. Any investment or investment activity to which this document relates is only available to professional investor and will be
engaged only with professional investors.” Nothing here is an offer or solicitation of these securities, products and services in any jurisdiction where their offer or sale is not qualified or exempt from
registration. The Indian Analyst(s) who compile this report is/are not located in Hong Kong & are not conducting Research Analysis in Hong Kong.
For U.S.
MOTILAL Oswal Financial Services Limited (MOFSL) is not a registered broker - dealer under the U.S. Securities Exchange Act of 1934, as amended (the"1934 act") and under applicable state laws in the
United States. In addition MOFSL is not a registered investment adviser under the U.S. Investment Advisers Act of 1940, as amended (the "Advisers Act" and together with the 1934 Act, the "Acts), and under
November 2024
15
 Motilal Oswal Financial Services
India Strategy | Embracing India’s Magnitude
applicable state laws in the United States. Accordingly, in the absence of specific exemption under the Acts, any brokerage and investment services provided by MOFSL, including the products and services
described herein are not available to or intended for U.S. persons. This report is intended for distribution only to "Major Institutional Investors" as defined by Rule 15a-6(b)(4) of the Exchange Act and
interpretations thereof by SEC (henceforth referred to as "major institutional investors"). This document must not be acted on or relied on by persons who are not major institutional investors. Any investment
or investment activity to which this document relates is only available to major institutional investors and will be engaged in only with major institutional investors. In reliance on the exemption from registration
provided by Rule 15a-6 of the U.S. Securities Exchange Act of 1934, as amended (the "Exchange Act") and interpretations thereof by the U.S. Securities and Exchange Commission ("SEC") in order to
conduct business with Institutional Investors based in the U.S., MOFSL has entered into a chaperoning agreement with a U.S. registered broker-dealer, Motilal Oswal Securities International Private Limited.
("MOSIPL"). Any business interaction pursuant to this report will have to be executed within the provisions of this chaperoning agreement.
The Research Analysts contributing to the report may not be registered /qualified as research analyst with FINRA. Such research analyst may not be associated persons of the U.S. registered broker-dealer,
MOSIPL, and therefore, may not be subject to NASD rule 2711 and NYSE Rule 472 restrictions on communication with a subject company, public appearances and trading securities held by a research
analyst account.
For Singapore
In Singapore, this report is being distributed by Motilal Oswal Capital Markets (Singapore) Pte. Ltd. (“MOCMSPL”) (UEN 201129401Z), which is a holder of a capital markets services license and an exempt
financial adviser in Singapore.This report is distributed solely to persons who (a) qualify as “institutional investors” as defined in section 4A(1)(c) of the Securities and Futures Act of Singapore (“SFA”) or (b)
are considered "accredited investors" as defined in section 2(1) of the Financial Advisers Regulations of Singapore read with section 4A(1)(a) of the SFA. Accordingly, if a recipient is neither an “institutional
investor” nor an “accredited investor”, they must immediately discontinue any use of this Report and inform MOCMSPL .
In respect of any matter arising from or in connection with the research you could contact the following representatives of MOCMSPL. In case of grievances for any of the services rendered by MOCMSPL
write to
grievances@motilaloswal.com.
Nainesh Rajani
Email:
nainesh.rajani@motilaloswal.com
Contact: (+65) 8328 0276
Disclaimer:
The report and information contained herein is strictly confidential and meant solely for the selected recipient and may not be altered in any way, transmitted to, copied or distributed, in part or in whole, to any
other person or to the media or reproduced in any form, without prior written consent. This report and information herein is solely for informational purpose and may not be used or considered as an offer
document or solicitation of offer to buy or sell or subscribe for securities or other financial instruments. Nothing in this report constitutes investment, legal, accounting and tax advice or a representation that
any investment or strategy is suitable or appropriate to your specific circumstances. The securities discussed and opinions expressed in this report may not be suitable for all investors, who must make their
own investment decisions, based on their own investment objectives, financial positions and needs of specific recipient. This may not be taken in substitution for the exercise of independent judgment by any
recipient. Each recipient of this document should make such investigations as it deems necessary to arrive at an independent evaluation of an investment in the securities of companies referred to in this
document (including the merits and risks involved), and should consult its own advisors to determine the merits and risks of such an investment. The investment discussed or views expressed may not be
suitable for all investors. Certain transactions -including those involving futures, options, another derivative products as well as non-investment grade securities - involve substantial risk and are not suitable for
all investors. No representation or warranty, express or implied, is made as to the accuracy, completeness or fairness of the information and opinions contained in this document. The Disclosures of Interest
Statement incorporated in this document is provided solely to enhance the transparency and should not be treated as endorsement of the views expressed in the report. This information is subject to change
without any prior notice. The Company reserves the right to make modifications and alternations to this statement as may be required from time to time without any prior approval. MOFSL, its associates, their
directors and the employees may from time to time, effect or have effected an own account transaction in, or deal as principal or agent in or for the securities mentioned in this document. They may perform or
seek to perform investment banking or other services for, or solicit investment banking or other business from, any company referred to in this report. Each of these entities functions as a separate, distinct
and independent of each other. The recipient should take this into account before interpreting the document. This report has been prepared on the basis of information that is already available in publicly
accessible media or developed through analysis of MOFSL. The views expressed are those of the analyst, and the Company may or may not subscribe to all the views expressed therein. This document is
being supplied to you solely for your information and may not be reproduced, redistributed or passed on, directly or indirectly, to any other person or published, copied, in whole or in part, for any purpose. This
report is not directed or intended for distribution to, or use by, any person or entity who is a citizen or resident of or located in any locality, state, country or other jurisdiction, where such distribution,
publication, availability or use would be contrary to law, regulation or which would subject MOFSL to any registration or licensing requirement within such jurisdiction. The securities described herein may or
may not be eligible for sale in all jurisdictions or to certain category of investors. Persons in whose possession this document may come are required to inform themselves of and to observe such restriction.
Neither the Firm, not its directors, employees, agents or representatives shall be liable for any damages whether direct or indirect, incidental, special or consequential including lost revenue or lost profits that
may arise from or in connection with the use of the information.
The person accessing this information specifically agrees to exempt MOFSL or any of its affiliates or employees from, any and all
responsibility/liability arising from such misuse and agrees not to hold MOFSL or any of its affiliates or employees responsible for any such misuse and further agrees to hold MOFSL or any of its affiliates or
employees free and harmless from all losses, costs, damages,
expenses that may be suffered by the person accessing this information due to any errors and delays.
This report is meant for the clients of Motilal Oswal only.
Investment in securities market are subject to market risks. Read all the related documents carefully before investing.
Registration granted by SEBI and certification from NISM in no way guarantee performance of the intermediary or provide any assurance of returns to investors.
Registered Office Address: Motilal Oswal Tower, Rahimtullah Sayani Road, Opposite Parel ST Depot, Prabhadevi, Mumbai-400025; Tel No.: 022 - 71934200 / 71934263; www.motilaloswal.com.
Correspondence Address: Palm Spring Centre, 2nd Floor, Palm Court Complex, New Link Road, Malad (West), Mumbai- 400 064. Tel No: 022 71881000. Details of Compliance Officer: Neeraj Agarwal, Email
Id: na@motilaloswal.com, Contact No.:022-40548085.
Grievance Redressal Cell:
Contact Person
Ms. Hemangi Date
Ms. Kumud Upadhyay
Mr. Ajay Menon
Contact No.
022 40548000 / 022 67490600
022 40548082
022 40548083
Email ID
query@motilaloswal.com
servicehead@motilaloswal.com
am@motilaloswal.com
Registration details of group entities.: Motilal Oswal Financial Services Ltd. (MOFSL): INZ000158836 (BSE/NSE/MCX/NCDEX); CDSL and NSDL: IN-DP-16-2015; Research Analyst: INH000000412 . AMFI:
ARN .: 146822. IRDA Corporate Agent – CA0579. Motilal Oswal Financial Services Ltd. is a distributor of Mutual Funds, PMS, Fixed Deposit, Insurance, Bond, NCDs and IPO products.
Customer having any query/feedback/ clarification may write to query@motilaloswal.com. In case of grievances for any of the services rendered by Motilal Oswal Financial Services Limited (MOFSL) write to
grievances@motilaloswal.com, for DP to dpgrievances@motilaloswal.com.
November 2024
16