India Strategy | Review 2QFY25
India Strategy
BSE Sensex: 77,580
Refer to our Sep’24
Quarter Preview
Nifty-50: 23,533
Earnings review – 2QFY25: An insipid quarter; Commodities drag
Internals muted; Earnings downgrades>>Upgrades
Commodities dent corporate earnings:
The 2QFY25 corporate earnings scorecard
was weak, but excluding commodities, it has reported an in-line earnings growth.
Consumption has emerged as a weak spot, while select segments of BFSI are
seeing asset-quality stress. The weak government spending (flat in 1HFY25 YoY)
along with excess rainfall also impacted demand. As some of these factors self-
correct in 2HFY25, we expect the corporate earnings to recover ahead.
BFSI drives with PSU Banks leading from the front:
The aggregate earnings of
the MOFSL Universe companies were in line with our estimates and declined 1%
YoY (vs. our est. of flat YoY). Earnings for the Nifty-50 rose 4% YoY (vs. our est. of
+3%). The aggregate performance was hit by a drag from global commodities (i.e.,
Metals and O&G). Excluding the same, the MOFSL Universe and Nifty posted 12%
and 11% earnings growth vs. our expectations of +11% and +10%, respectively. The
earnings growth was driven by BFSI (+15% YoY) with PSU Banks (+34% YoY against
exp of 17% growth) and NBFC-Non-Lending (+92% YoY vs. exp of 85% growth)
leading from the front. Technology (+8% YoY), Healthcare (+17% YoY), Utilities
(+17% YoY) & Capital Goods (+17% YoY) also contributed to the growth.
Conversely, earnings growth was hindered by global cyclicals, such as O&G
(OMC’s profit plunged 92% YoY), which dipped 41% YoY, along with Cement (-
46% YoY), Chemicals (-4% YoY), and Consumer (flat YoY).
Nifty clocks single-digit growth for the second straight quarter:
Nifty delivered a
4% YoY PAT growth (vs. our est. of +3%).
Nifty reported a single-digit PAT growth
for the second successive quarter since the pandemic (Jun’20).
Five Nifty
companies – SBI, Hindalco, ONGC, ICICI Bank, and Axis Bank – contributed 140% of
the incremental YoY accretion in earnings. Conversely, BPCL, JSW Steel, Coal India,
Indusind Bank, and Reliance Industries contributed adversely to the earnings.
The beat-miss dynamics:
The beat-miss ratio for the MOFSL Universe was
unfavorable, with 38% of the companies missing our estimates, while 35%
reported a beat at the PAT level. For the MOFSL Universe, the earnings upgrade-
to-downgrade ratio has turned weaker for FY25E as 43 companies’ earnings
have been upgraded by >3%, while 121 companies’ earnings have been
downgraded by >3%. The earnings upgrade/downgrade ratio of 0.4x was the
worst since 1QFY21. Further, the EBITDA margin of the MOFSL Universe (ex-
Financials) contracted 180bp YoY to 16.2%, primarily dragged down by OMCs.
Report card:
Of the 25 sectors under our coverage, 4/12/9 sectors reported
profits above/in line/below our estimates. Of the 275 companies under coverage,
97 exceeded our profit estimates, 104 posted a miss, and 74 were in line.
A Story of Two Halves – 1HFY25 and 2HFY25E:
The MOFSL/Nifty Universes
delivered flat/ +4% YoY earnings growth in 1HFY25. Excluding Metals and O&G,
MOFSL/Nifty reported 13%/12% YoY earnings growth. For 2HFY25, we expect
MOFSL/Nifty earnings to report a growth of 9%/8% YoY. Excluding Metals and
O&G, MOFSL/Nifty is expected to report a growth of 13%/9% YoY.
FY25E earnings highlights:
The MOFSL Universe is likely to deliver sales/EBITDA/
PAT growth of 6%/5%/4% YoY in FY25. The Financials and Metals sectors are
projected to be the key growth engines, with 13% and 20% YoY earnings growth,
Motilal Oswal values your support in
the EXTEL POLL 2024 for India
Research, Sales, Corporate Access and
Trading team.
We
request your ballot.
Best Domestic
Brokerage
# Ranked Top 3
(CY21-CY23)
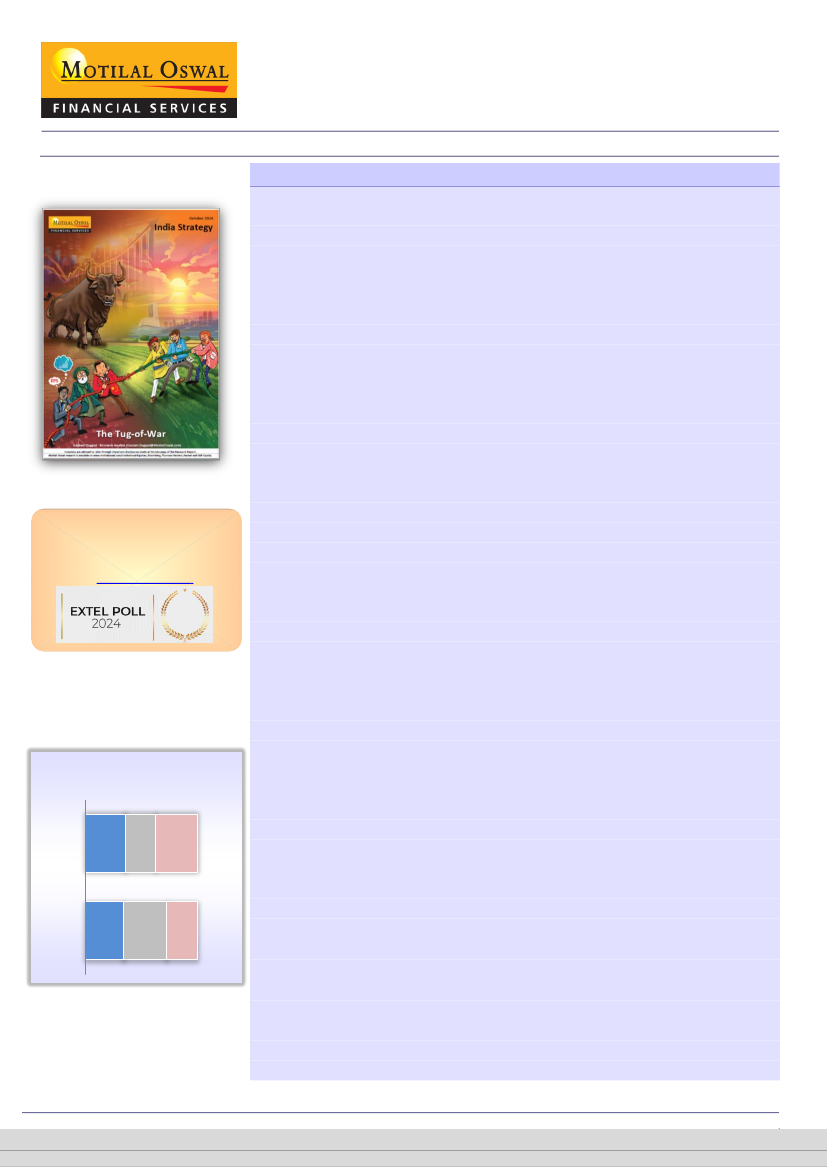
Expectations vs. delivery: 2QFY25
% of companies that have declared results
Above Expectations
In-line
Below Expectations
MOFSL
PAT
Nifty
35
27
38
34
38
28
Gautam Duggad – Research Analyst
(Gautam.Duggad@MotilalOswal.com)
Research Analyst: Deven Mistry
(Deven@MotilalOswal.com)
/
Aanshul Agarawal
(Aanshul.Agarawal@Motilaloswal.com)
November 2024
are advised to refer through important disclosures made at the last page of the Research Report.
Investors
1
Motilal Oswal research is available on www.motilaloswal.com/Institutional-Equities, Bloomberg, Thomson Reuters, Factset and S&P Capital.
 Motilal Oswal Financial Services
India Strategy | Review 2QFY25
PAT growth YoY in 2QFY25 (%)
12
9
-1
-9
MOFSL Ex BFSI Ex
Ex
Univ.
Metals OMCs
& Oil
respectively. Ex-OMC’s, the MOFSL Universe is expected to post 10% YoY
earnings growth in FY25.
Nifty EPS cut by 1.4%/2.2% for FY25E/FY26E:
The Nifty EPS estimate for FY25 was
cut by 1.4% to INR1,057, largely owing to ONGC, BPCL, Reliance Industries, and
Coal India. Ex-Commodities, Nifty FY25E earnings saw no downgrades. FY26E
EPS was also trimmed by 2.2% to INR1,241 (from INR1,269) led by downgrades
in ONGC, BPCL, Reliance Industries, and Tata Motors.
The top earnings upgrades in FY25E:
Bharti Airtel (16.3%), Tata Motors (11.6%),
Tech Mahindra (8.8%) & Hindalco (8.6%).
The top earnings downgrades in FY25E:
BPCL (-34.3%), Indusind Bank (-16.7%),
Ultratech Cement (-15.5%), Asian Paints (-14%), and Trent (-12.1%).
Key sectoral highlights
1)
Banks:
The banking sector reported a soft quarter
amid moderation in margins and a rise in provisioning expenses, mainly for
private banks. NIM contracted for several banks as cost pressures persisted
amid intense competition for liabilities and continued pressure on CASA mix.
Public sector banks (PSBs) delivered solid beat led by lower than expected
provision costs. 2)
Autos:
After several quarters, rural demand showed some
positivity, spurred by a healthy monsoon, the recent festive season, and the
upcoming marriage season, which should benefit 2Ws and tractors. 3)
Consumer:
The demand environment was challenging due to adverse weather
conditions, including floods and heavy rains in certain areas, coupled with
persistent inflation that impacted urban demand. Volume growth across most
companies was discouraging after seeing a slight pickup in 1QFY25. 4)
Oil & Gas:
The performance was below our estimate due to OMCs. EBITDA was below our
estimate (down 33% YoY), with HPCL, BPCL, IOC, CSTRL, GUJS, IGL, MAHGL, OINL,
MRPL, PLNG, and AEGISLOG missing our estimates. Adjusted PAT was 12% below
(down 42% YoY). 5)
Technology:
The IT services companies (MOFSL Universe)
reported healthy performance (beating our estimates), with a median revenue
growth of 2% QoQ CC in 2QFY25 (1%/0.7%/1.2% in 3QFY24/4QFY24/1QFY25).
While results were encouraging, the outlook remained slightly guarded,
signaling persisting uncertainties. This indicates that despite client pessimism
bottoming out, a solid lift-off in discretionary spending has yet to emerge. 6)
Healthcare:
Our coverage companies (excluding hospitals) reported in-line
sales/PAT while EBITDA was better than our estimates. The profitability was
driven by: a) increased contribution from limited competition products, b) steady
growth in chronic therapies, and c) ongoing higher inventory levels for raw
materials at industry level, which benefited formulators.
Our view:
The corporate earnings scorecard for 2QFY25 has shown weakness,
but excluding commodities, it has been broadly in line. Consumption has
emerged as a weak spot, while select segments of BFSI are experiencing asset-
quality stress. Weakness in government spending has also been one of the
factors driving moderation in earnings. After a flat 1HFY25, as the government
spending revives in 2HFY25, this should augur well for corporate earnings along
with a good kharif crop and improving rural demand. Nifty FY25 EPS has seen
another 1% cut after a 4% cut in 2QFY25 preview. Overall, Nifty EPS has seen
~7% downward revision in the last six months, which has reduced the expected
FY25 earnings growth to just 5%, the weakest since FY20. The Nifty is trading at
a 12-month forward P/E of 20x, near to its long-period average (LPA) of 20.5x.
Despite the recent 10% correction from the highs, the broader markets are still
trading at expensive valuations (NSE Midcap 100 at ~29x forward P/E). We had
2
November 2024
 Motilal Oswal Financial Services
India Strategy | Review 2QFY25
made several significant changes in our model portfolio in the 2QFY25 preview,
where we raised the weights in BFSI, Technology, and Healthcare with a distinct
bias towards large-caps.
Our model portfolio
reflects our conviction in domestic
structural as well as cyclical themes. We are OW on IT, Healthcare, BFSI,
Consumer Discretionary, Industrials, and Real Estate. In contrast, we are UW on
Metals, Energy, and Automobiles.
Exhibit 1: Our preferred ideas
Company
Preferred large cap stocks
HDFC Bank
153.1 1,693 88.2 100.1 115.6
11.8
19.2 16.9 14.7 2.6 2.3
Bharti Airtel
111.1 1,551 35.9 45.4 60.6
52.0
43.2 34.2 25.6 9.7 7.6
ICICI Bank
104.8 1,255 65.4 73.3 85.4
12.0
19.2 17.1 14.7 3.2 2.8
State Bank
85.0
804 89.3 98.8 115.4
14.7
9.0 8.1 7.0 1.5 1.3
HCL Technologies
59.8 1,859 63.7 71.9 80.3
11.5
29.2 25.9 23.2 7.5 7.6
Larsen & Toubro
57.4 3,527 111.1 137.2 160.3
20.5
31.7 25.7 22.0 4.9 4.3
Mahindra & Mahindra
39.9 2,809 99.7 116.2 136.7
14.4
28.2 24.2 20.5 5.5 4.7
Power Grid Corp.
34.4
312 17.5 18.4 19.5
5.0
17.8 16.9 16.0 3.2 3.1
Titan Company
33.6 3,184 43.0 53.6 64.0
16.9
74.0 59.4 49.8 23.5 18.4
Trent
27.2 6,461 47.8 65.9 89.8
50.2
135.3 98.0 72.0 37.2 26.5
Mankind Pharma
12.4 2,606 54.6 60.1 76.6
12.2
47.7 43.3 34.0 9.5 8.1
Preferred midcap/smallcap stocks
Indian Hotels
12.5
741 11.8 14.3 16.1
26.8
62.8 52.0 46.0 9.4 8.0
Cummins India
10.9 3,328 74.1 88.7 104.3
21.6
44.9 37.5 31.9 13.3 11.6
Persistent Systems
10.6 5,714 89.5 115.0 133.8
23.7
63.8 49.7 42.7 15.2 12.8
Dixon Tech.
10.5 14,766 134.3 177.4 232.2
69.8
110.0 83.2 63.6 35.6 25.1
Godrej Properties
8.5 2,595 52.0 32.8 27.8
10.5
49.9 79.1 93.2 6.3 5.8
Coforge
6.4 8,081 147.1 239.2 291.0
34.0
54.9 33.8 27.8 13.0 11.0
Metro Brands
3.6 1,126 14.1 17.5 22.0
17.2
79.8 64.3 51.1 13.7 11.6
Global Health
3.4 1,071 19.1 24.0 30.2
16.0
56.1 44.7 35.5 8.6 7.5
Angel One
2.9 2,697 169.0 189.7 264.1
18.2
16.0 14.2 10.2 3.8 3.2
PNB Housing
2.8
904 72.3 88.8 108.4
23.7
12.5 10.2 8.3 1.4 1.2
Cello World
2.0
808 17.0 22.1 27.3
19.0
47.4 36.6 29.6 11.5 8.8
Note: LP = Loss to profit; Large Cap, Mid Cap and Small Cap Stocks listed above are as per the SEBI categorization
MCap CMP
EPS (INR)
PE (x)
PB (x)
ROE (%)
EPS CAGR (%)
(USDb) (INR) FY25E FY26E FY27E FY24-26 FY25E FY26E FY27E FY25E FY26E FY27E FY25E FY26E FY27E
2.1
6.7
2.4
1.1
7.7
3.7
4.0
3.0
14.6
19.0
6.9
6.9
10.2
10.9
18.0
5.5
9.2
9.8
6.4
2.7
1.1
6.8
14.4
24.0
18.0
18.8
25.6
16.5
21.0
18.4
35.7
34.5
21.5
16.2
31.3
25.6
38.5
13.5
24.6
19.0
16.4
31.2
11.8
24.2
14.6
27.0
17.4
17.4
29.3
17.9
20.8
18.7
34.7
33.8
20.2
16.6
33.0
27.9
35.3
7.7
34.9
20.1
17.9
24.5
12.9
24.1
14.9
30.0
17.4
17.2
33.1
18.2
20.8
19.1
32.7
32.9
21.9
16.1
34.0
27.5
33.0
6.1
35.7
21.3
19.3
29.0
14.0
26.0
Sector Review Compendium
Highlights / Surprise / Guidance… (Page 18 onwards)
Automobiles
Capital Goods
Cement
Chemicals
Consumer – FMCG | QSR
Consumer Durables
EMS
Healthcare
Infrastructure
Logistics
Metals
Oil & Gas
Real Estate
Retail
Financials – Banks
Financials – NBFC: Lending
Financials – NBFC: Non Lending
Technology
Telecom
Utilities
November 2024
3
 Motilal Oswal Financial Services
India Strategy | Review 2QFY25
Performance in line: BFSI drives modest earnings growth
The MOFSL Universe’s sales/EBITDA/PBT/PAT were +5%/+1%/-1%/-1% YoY (vs.
est. of +7%/+2%/0%/0%). Excluding Metals and O&G, the MOFSL Universe
companies recorded sales/EBITDA/PBT/PAT growth of 8%/11%/11%/12% YoY
(v/s est. of +8%/10%/10%/11%) in 2QFY25.
The modest earnings growth was driven once again by BFSI, with positive
contributions from Technology, Telecom, Healthcare, Utilities, Capital Goods, and
Automobiles. Conversely, earnings growth was weighed down by global cyclicals,
such as O&G (OMC’s profit plunged 92% YoY), which saw a dip of 41% YoY, along
with Cement, Chemicals, and Consumer (flat YoY).
The EBITDA margin for the MOFSL Universe (ex-Financials) contracted 180bp YoY
to 16.2% vs. exp of 16.5%, lowest in seven quarters .
The gross margin for two-thirds of the sectors contracted. Nine of the 15 major
sectors under MOFSL Coverage reported a contraction in gross margin YoY.
Exhibit 2: Sector-wise 2QFY25 performance of the MOFSL Universe companies (INRb)
Sector
Sep-24
(no of companies)
Automobiles (25)
2,873
Capital Goods (11)
869
Cement (11)
510
Chemicals-Specialty (12)
168
Consumer (19)
870
Consumer Durables (5)
167
EMS (7)
154
Financials (49)
2,819
Banks-Private (13)
925
Banks-PSU (6)
883
Insurance (6)
655
NBFC - Lending (19)
326
NBFC - Non Lending (5)
30
Healthcare (24)
871
Infrastructure (3)
36
Logistics (8)
156
Media (3)
45
Metals (10)
2,715
Oil & Gas (15)
7,309
Ex OMCs (12)
3,543
Real Estate (12)
135
Retail (19)
535
Staffing (4)
119
Technology (12)
1,944
Telecom (4)
656
Utilities (5)
697
Others (17)
565
MOFSL Universe (275)
24,211
MOFSL Ex Financials (226)
21,392
MOFSL Ex Metals & Oil (250) 14,187
MOFSL Ex OMCs (272)
20,446
Nifty (50)
14,333
Sensex (30)
10,468
LP: Loss to profit; PL: Profit to loss
Sales
Chg. % Var. over
YoY Exp. (%)
3.8
0.1
18.9
5.6
-2.3
1.1
8.2
-1.2
6.5
0.9
19.9
5.5
103.9
16.9
10.1
-1.6
11.3
0.0
5.1
-0.8
10.1
-5.5
18.2
-0.1
59.6
0.1
10.5
1.7
-16.2
-17.9
8.0
-2.9
-17.1
-0.5
-1.4
-0.5
0.6
-8.2
1.7
-0.1
31.9
0.6
18.4
0.1
11.5
-1.2
6.2
1.1
9.8
0.5
0.2
-6.9
10.5
9.8
4.7
-2.4
4.1
-2.5
8.4
0.5
5.8
0.3
4.0
0.1
3.9
0.9
EBITDA
Chg. % Var. over
Sep-24
YoY Exp. (%)
369
-2
-4.9
102
20.4
5.8
56
-28
-2.5
31
-0.5
-2.8
204
1
-1.9
15
7.1
-12.9
8
82
11.1
1,660
19.1
3.8
706
14
1.8
661
25.2
8.6
31
2
-13.1
245
18.1
0.5
16
89
2.7
209
17.3
3.3
10
-11
-13.6
59
12.1
0.6
10
-30
7.0
464
9.0
2.3
772
-33
-14.3
661
-7.2
-3.7
36
24
-9.0
57
12.5
-5.1
4
12
-5.9
435
6.7
2.2
324
15
2.4
240
0.2
-9.0
68
2
11.7
0.7
-1.5
5,132
-6.2
-3.9
3,472
10.7
1.0
3,896
7.8
0.5
5,021
4.8
-0.9
3,479
7.7
0.6
2,814
PBT
Chg. % Var. over
Sep-24
Sep-24
YoY
Exp. (%)
285
1.8
-1.6
217
92
20.3
7.0
61
31
-45.8
-9.8
23
24
-0.6
0.1
18
190
-1.1
-3.9
142
15
11.9
-10.7
10
8
167.4
40.9
4
1,315
16.0
3.2
985
569
6.4
-2.0
437
539
31.1
13.4
393
23
23.3
-1.9
22
166
4.7
-6.5
120
17
87.8
3.7
13
173
21.3
4.6
129
6
8.0
11.6
4
41
15.6
-3.1
33
8
-32.3
4.3
6
297
16.4
4.7
197
512
-40.6
-13.6
370
482
-5.5
5.6
350
29
26.2
-7.8
27
30
5.3
-11.0
22
2
14.0
-21.3
2
409
9.3
2.4
300
28
LP
6.9
-17
130
11.4
-1.7
97
12
-50.2
-23.7
6
-0.5
-0.8
3,637
2,637
-8.0
-2.9
2,322
1,652
11.4
1.4
2,828
2,070
9.2
2.2
3,607
2,616
4.5
1.3
2,647
1,923
6.3
1.8
2,077
1,486
PAT
Chg. % Var. over
YoY Exp. (%)
5.8
-1.8
17.2
5.5
-46.2
-9.4
-4.0
1.1
-0.2
-3.9
13.0
-12.3
80.3
2.2
15.3
3.9
5.2
0.3
33.5
13.9
16.0
-1.2
0.6
-9.8
91.9
3.7
17.0
1.6
14.0
13.2
10.3
-3.6
-26.0
7.2
3.1
1.4
-40.7
-11.9
-2.4
10.0
45.0
0.9
7.2
-8.7
9.0
-23.3
8.3
1.1
Loss
Loss
17.3
-5.9
-70.5
-23.1
-1.3
-1.4
-9.1
-4.4
11.5
0.4
8.8
1.7
4.0
1.0
5.4
1.1
November 2024
4
 Motilal Oswal Financial Services
India Strategy | Review 2QFY25
Exhibit 3: PAT declined 1% YoY for the
MOFSL Universe
MOFSL Universe
46
23
50
45
28
Exhibit 4: PAT declined 9% YoY for the
MOFSL Universe, excluding Financials
53
17 10
4
MOFSL Ex Financials
46 51
32
5
-11
-22
Exhibit 5: PAT rose 12% YoY for the
MOFSL Universe, sans Metals & O&G
MOFSL Ex Metals & Oil
51
37
4
-5
24
25
14
22
19
15
2
-6
15
28 30
29
22
17 14
9
1
-1
-9
12
Exhibit 6: PAT growth for the Nifty
Universe stood at 4% YoY
Nifty Universe
39
26
21 24
10 11
35
29
18
20
12
4
Exhibit 7: PAT for the Nifty Universe,
sans Financials, was flat YoY
Nifty Ex Financials
41
22
20
9
26
30
22
Exhibit 8: PAT grew 11% YoY for the
Nifty Universe, sans Metals & O&G
Nifty Ex Metals & Oil
51
35 33
24
31
23
17 16
13
15
4
-2
0
7
0
14
18
10
11
0
Earnings upgrade-to-downgrade ratio unfavorable for FY25E
For the MOFSL Universe, the earnings upgrade-to-downgrade ratio has turned
weaker for FY25E as 43 companies’ earnings have been upgraded by >3%, while
121 companies’ earnings have been downgraded by >3%. The earnings
upgrade/downgrade ratio of 0.4x was the worst since 1QFY21.
The beat-miss ratio for the MOFSL Universe was unfavorable, with 38% of the
companies missing our estimates, while 35% reported a beat at the PAT level.
Of the 25 sectors under our coverage, 4/12/9 sectors reported profits above/in
line/below our estimates.
Exhibit 9: The upgrade-to-downgrade ratio trend for the MOFSL Universe – the worst since 1QFY21
2.7
1.7
1.0
0.7
0.9
Earnings upgrade/downgrade ratio
1.7
0.7
0.7
0.3
0.6
0.7
0.8
0.6
0.8
0.9
0.9
1.0
0.6
0.9
0.4
0.4
November 2024
5
 Motilal Oswal Financial Services
India Strategy | Review 2QFY25
Exhibit 10: Surprise/miss ratio for the MOFSL Universe at
0.9x in 2QFY25
MOFSL Universe PAT (Surprise / Miss ratio)
3.4
2.4
1.8
0.9 0.8
1.2
1.1
2.3
1.5
1.0
1.8
1.5
1.1
1.3
1.4
1.0
0.9
1.2
Exhibit 11: Sectoral surprise/miss ratio at 0.4x, for the
MOFSL Universe, in 2QFY25
6.5
7.0
MOFSL Sector PAT (Surprise / Miss ratio)
5.0
2.8
1.2
1.7
1.3
1.2
0.5 0.5 0.9
0.9
1.2
0.9
0.9
0.7
2.3
1.0 0.8
0.4
Exhibit 12: Two and three-year profit CAGR for the MOFSL Universe
EBITDA (INR b)
CAGR (%)
PBT (INR b)
CAGR (%)
PAT (INR b)
CAGR (%)
Sector
2QFY22 2QFY23 2QFY25 2-year 3-year 2QFY22 2QFY23 2QFY25 2-year 3-year 2QFY22 2QFY23 2QFY25 2-year 3-year
Automobiles
160
228
369
27
32
63
127
285
50
66
31
97
217
50
92
Capital Goods
60
71
102
20
19
48
59
92
25
24
30
37
61
28
26
Cement
85
47
56
9
-13
68
27
31
8
-23
47
20
23
6
-22
Chemicals-Specialty 26
35
31
-6
6
21
29
24
-10
5
16
24
18
-14
4
Consumer
152
178
204
7
10
145
166
190
7
9
109
126
142
6
9
Consumer Durables 10
10
15
19
13
10
8
15
31
15
7
7
10
23
15
EMS
2
4
8
49
62
1
2
8
86
84
1
2
4
54
61
Financials
1,027 1,199 1,660
18
17
563
859 1,315
24
33
426
642
985
24
32
Banks-Private
437
505
706
18
17
253
409
569
18
31
190
306
437
19
32
Banks-PSU
427
498
661
15
16
195
305
539
33
40
148
226
393
32
39
Insurance
20
28
31
5
17
14
16
23
19
20
13
15
22
20
18
NBFC - Lending
138
160
245
24
21
95
121
166
17
20
71
89
120
16
19
NBFC - Non Lending 5
7
16
49
46
6
8
17
48
42
4
6
13
50
44
Healthcare
144
153
209
17
13
118
127
173
17
14
94
97
129
15
11
Infrastructure
12
11
10
-4
-4
5
6
6
4
9
3
4
4
1
7
Logistics
36
46
59
14
18
24
31
41
14
19
20
26
33
12
19
Media
8
9
10
9
9
7
7
8
7
5
5
5
6
15
6
Metals
680
367
464
12
-12
555
221
297
16
-19
416
139
197
19
-22
Oil & Gas
653
616
772
12
6
517
378
512
16
0
385
276
370
16
-1
Real Estate
22
21
36
30
18
15
13
29
47
25
15
15
27
35
21
Retail
35
46
57
10
17
22
29
30
1
LP
16
22
22
1
LP
Staffing
3
3
4
18
10
2
2
2
23
6
2
2
2
14
10
Technology
352
386
435
6
7
330
355
409
7
7
247
264
300
7
7
Telecom
224
256
324
12
13
-23
-16
28
LP
LP
-46
-42
-17
Loss
Loss
Utilities
190
209
240
7
8
82
90
130
21
17
73
84
97
8
10
Others
32
45
68
24
29
1
9
12
13
LP
77
2
6
86
LP
MOFSL Universe
3,911 3,941 5,132
14
9
2,574 2,528 3,637
20
12
1,976 1,848 2,637
19
10
Nifty Universe
2,506 2,739 3,479
13
12
1,777 1,968 2,647
16
14
1,309 1,438 1,923
16
14
November 2024
6
 Motilal Oswal Financial Services
India Strategy | Review 2QFY25
Exhibit 13: Sales for the MOFSL Universe up 5% YoY (est. 7%)
52
31 29
18
2
-1 0 -4
-29
-4
25
43
29
18 13
4 3 5 6 7
Exhibit 14: EBITDA for the MOFSL Universe up 1% YoY (est. 2%)
50
40
22
14
21
12 12
7
1
8 10
27 29
13 10
3
5
2
12
1
-5
-14
Exhibit 15: PAT for the MOFSL Universe at -1% YoY (est. 0%)
131
102
46
23 19 15
2
15
50 45
Exhibit 16: EBITDA margin, excluding Financials, contracted
180bp YoY to 16.2%
4 4
19
35
28
9
1
-22-41
-6
-1
.
.
Exhibit 17: MOFSL Universe (ex-Nifty) posted a decline of 11% YoY in profits, due to OMCs
193
153
83
46
4
-5
-22
95
60
16
96
56
3
-3
15
-6
-16
11
-11
-55
-37
Exhibit 18: Sales growth for the MOFSL Universe, excluding
Nifty companies, stood at 7% YoY
58
35 33
18
4
-2 -1 -4
-32
-4
29
52
31
17 13
Exhibit 19: EBITDA was -5% YoY for the MOFSL Universe,
excluding Nifty companies
66 62
30
36
18
5 6
0
-11
-16
-6
-1
-13
7
40
46
23
8
0
0
4 6 7
20
7
0
-5
November 2024
7
 Motilal Oswal Financial Services
India Strategy | Review 2QFY25
Margin contracts owing to a high base
Sales for the MOFSL Universe companies grew 5% YoY (in line). Excluding Metals
and O&G, sales growth was in line at 8% YoY (in line).
Sectoral sales growth: EMS (104%), NBFC - Non Lending (60%), Real Estate
(32%), Consumer Durables (20%), and Capital Goods (19%).
EBITDA margin for the MOFSL Universe (ex-Financials) contracted 180bp YoY to
16.2%. Gross margins for two-thirds of the sectors contracted.
In 2QFY25, nine of the 15 major sectors under MOFSL Coverage reported a
contraction in gross margin YoY.
Exhibit 20: Gross margin contracted in several sectors due to a high base
Change
2QFY22 3QFY22 4QFY22 1QFY23 2QFY23 3QFY23 4QFY23 1QFY24 2QFY24 3QFY24 4QFY24 1QFY25 2QFY25 in GM
bps YoY
Cement
65.8
61.0
59.7
59.7
56.3
56.1
55.0
62.6
57.4
60.4
57.7
57.8
63.9
657
Healthcare
63.4
63.0
62.8
62.4
64.0
64.0
63.7
65.1
65.6
65.9
67.2
68.1
68.2
253
Utilities
0.2
0.2
0.2
27.1
27.2
33.1
31.3
47.8
46.8
49.0
49.3
47.0
48.9
210
Infrastructure
40.8
41.4
36.0
40.7
71.4
39.1
36.6
36.7
40.2
51.7
33.0
39.5
42.2
200
Automobiles
29.1
29.8
29.3
31.6
32.0
33.3
34.0
34.9
34.7
36.0
36.4
36.5
35.8
110
Logistics
18.5
18.6
18.5
51.5
49.9
48.4
50.8
52.7
51.7
52.0
52.2
51.8
52.7
97
Technology
35.5
35.2
34.5
33.1
33.6
34.4
34.5
33.9
34.0
34.4
34.3
35.1
33.7
-25
Retail
31.9
32.9
32.6
32.9
32.5
31.6
31.3
30.6
30.2
30.9
30.7
30.7
29.9
-33
Chemicals-Specialty 51.5
53.2
53.8
53.3
51.0
54.8
54.3
54.6
53.3
54.1
54.2
52.6
53.0
-35
Others
38.7
43.1
40.3
42.9
38.6
43.5
41.7
48.9
43.9
45.0
45.1
47.9
43.4
-50
Consumer
49.6
48.7
48.7
47.6
48.5
50.0
51.2
51.6
52.6
53.0
53.7
52.8
51.7
-98
Consumer Durables 16.7
16.0
14.8
18.8
18.5
19.5
18.4
25.4
27.2
26.6
25.4
25.1
25.7
-143
Oil & Gas
22.9
20.8
21.8
16.8
17.0
18.4
22.5
25.2
25.0
22.2
22.7
20.9
22.6
-243
Real Estate
46.3
50.8
41.1
44.2
53.2
49.3
43.2
48.6
52.3
54.3
49.3
52.6
49.5
-274
Metals
59.4
55.9
54.1
56.2
47.9
51.1
54.1
52.8
49.9
55.5
53.7
52.7
38.0 -1,189
Source: 211 companies that form part of the MOFSL Universe, excluding Financials, Telecom, Media, and Staffing
Exhibit 21: Several sectors recovered YoY in terms of operating margins
Sep-23
Jun-24
Sep-24
Contributions of BFSI and Technology in profit pool improve
The BFSI contribution to the overall MOFSL profit pool accounted for more than
one-third of the profits. The contribution improved to 37.3% and was the
highest since Sep’20.
The Technology contribution to profit pool saw an improvement for the third
consecutive quarter to 11.4% in 2QFY25 – this was at a seven-quarter high.
The Oil & Gas contribution to profit pool, which slipped to a multi-quarter low of
13.7% in 1QFY25, saw an uptick in 2QFY25 to reach 14%.
November 2024
8
 Motilal Oswal Financial Services
India Strategy | Review 2QFY25
Exhibit 22: Financials’ contribution was up in 2Q; it
rd
accounted for more than 1/3 of the overall profit pool
Financials
Contribution to MOFSL universe profits (%)
34.8
34.5
30.9
30.7
32.0
32.8
34.3
PAT (INR b)
37.3
Exhibit 23: IT sector’s contribution to the overall profit pool
improved in 2QFY25
Technology
Contribution to MOFSL universe profits (%)
14.3
13.7
10.9
10.2
10.4
10.6
10.2
10.8
11.4
PAT (INR b)
35.1
Exhibit 24: O&G’s PAT contribution to the overall profit pool
saw an uptick in 2QFY25
Oil & Gas
Contribution to MOFSL universe profits (%)
23.7 23.4
20.5
17.5 17.4
14.9 16.2
PAT (INR b)
Exhibit 25: Metals’ PAT contribution to the MOFSL Universe
decreased in 2QFY25
Metals
Contribution to MOFSL universe profits (%)
9.3
7.5
8.5
7.2
9.0
7.4
PAT (INR b)
9.9
13.7
14.0
6.4
7.5
Exhibit 26: Auto sector’s contribution to the overall profit
pool declined marginally in 2QFY25
Automobiles
Contribution to MOFSL universe profits (%)
6.8
5.2
7.1
6.5
7.7
8.5
8.5
PAT (INR b)
8.3
8.2
Exhibit 27: Consumer sector’s contribution dipped in 2QFY25
Consumer
Contribution to MOFSL universe profits (%)
6.8
6.3
5.1
5.5
5.3
5.5
PAT (INR b)
5.0
5.6
5.4
November 2024
9
 Motilal Oswal Financial Services
India Strategy | Review 2QFY25
A Story of Two Halves: 1HFY25 and 2HFY25E
The MOFSL Universe delivered a flat YoY earnings growth in 1HFY25. Excluding
Metals and O&G, it reported 13% YoY earnings growth.
During 1HFY25, out of 25 sectors under our coverage, 19 sectors saw a YoY
growth in PAT, while six saw a decline. NBFC Non Lending (+82%), EMS (+68%),
Real Estate (+54%), Consumer Durables (+24%), PSU Banks (+23%), Healthcare
(+23%), Insurance (+22%), and Capital Goods (+20%) were top gainers.
Conversely, Oil & Gas (-41%), Cement (-34%), Media (-17%), and Chemicals (-
12%) were the laggards.
For 2HFY25, we expect MOFSL earnings to report a growth of 9% YoY (13% for
MOFSL Ex Metals & O&G). This will be contributed by BFSI, Metals, Telecom,
Technology, and Healthcare.
Exhibit 28: Sector wise 1HFY25 performance (%) – dragged by Oil & Gas
82
68
1HFY25 PAT growth YoY (%)
54
24
23
23
22
20
16
16
11
11
11
8
8
7
7
1
0
0
-12 -17
-34 -39 -41
Loss
Exhibit 29: Sector wise 2HFY25E performance (%) – Oil & Gas and Cement will continue to be the laggards
LP
99
95
62
58
48
33
31
31
29
2HFY25E PAT growth YoY (%)
27
27
26
24
23
18
17
12
11
9
7
6
5
4
-20 -22
Exhibit 30: Sector-wise contribution to 2HFY25E earnings growth (%)
27
18
2HFY25E contribution to PAT growth (%)
12
10
10
9
9
7
7
7
4
4
3
3
2
2
2
2
1
1
1
1
1
-5
-39
November 2024
10
 Motilal Oswal Financial Services
India Strategy | Review 2QFY25
Performance highlights of the Nifty constituents in 2QFY25
Top five stocks account for ~140% of the incremental profit YoY
Sales/EBITDA/PBT/PAT growth for Nifty constituents was in line at +4%/+5%/
+4%/+4% YoY in 2QFY25. Excluding Financials, profits for Nifty constituents were
flat YoY (vs. est. of flat YoY).
Among Nifty constituents, 34% exceeded our PAT estimates, while 28% missed
our estimates.
SBI, Hindalco, ONGC, ICICI Bank, Wipro, Mahindra & Mahindra, HCL
Technologies, Bharat Electronics, Tech Mahindra, Maruti Suzuki, Hero Moto,
Larsen & Toubro, Trent, Cipla, Tata Consumer, Tata Steel, and JSW Steel
delivered higher-than-estimated earnings.
In contrast, Bharti Airtel, NTPC, Kotak Mahindra Bank, Titan Company, Britannia,
Nestle, Asian Paints, Grasim, Ultratech Cement, Tata Motors, Indusind Bank,
Coal India, and BPCL missed our profit estimates.
Five Nifty companies witnessed earnings upgrades of over 5% in their FY25 EPS
estimates, while 14 companies witnessed downgrades of over 5%.
Exhibit 32: Nifty EBITDA up 5% YoY (est. 6%) in 2QFY25
43
Exhibit 31: Nifty sales up 4% YoY (in line) in 2QFY25
48
38
17
0
0
-5
-26
-4
2
28 27
24
29
18
13
6 5 6
7
7
27
22
4
4
8
15
6
-2
-12
17 16 16
22 21
9
13 13
10 11
5
5
Exhibit 33: Nifty PAT up 4% YoY (est. 3%)
109
84
39
4
9
10
19
26 21 24
35 29
Exhibit 34: Nifty EBITDA margin (ex-Financials) contracted
90bp YoY to 19.1%
10 11 18
20 12
4
4
-23
-34
November 2024
11
 Motilal Oswal Financial Services
India Strategy | Review 2QFY25
Exhibit 35: BFSI, Technology, and Metals to drive FY25E earnings for the Nifty
Sector
Automobiles
BFSI
Capital Goods
Cement
Consumer
Healthcare
Logistics
Metals
Oil & Gas
Retail
Technology
Telecom
Utilities
Others
Nifty
FY22
76
1,433
108
130
319
143
59
926
1,107
24
919
35
307
8
5,593
FY23
289
2,026
134
115
386
164
77
540
1,089
37
977
82
323
27
6,266
PAT (INR b)
FY24
FY25E
624
667
2,541
2,845
170
201
134
115
437
432
204
236
89
110
599
650
1,550
1,259
45
55
1,009
1,111
113
206
364
373
35
57
7,914
8,319
FY26E
733
3,259
248
159
483
278
131
873
1,577
71
1,245
275
421
57
9,809
FY27E
841
3,841
293
194
532
297
156
1,033
1,731
89
1,371
367
452
57
11,253
FY22
-57
37
22
31
9
31
30
169
43
198
16
Loss
6
-29
37
FY23
278
41
24
-11
21
15
30
-42
-2
54
6
Loss
5
249
12
Growth YoY (%)
FY24 FY25E FY26E
116
7
10
25
12
15
27
18
23
16
-14
38
13
-1
12
24
16
18
16
23
19
11
9
34
42
-19
25
24
22
29
3
10
12
LP
82
33
13
2
13
30
63
0
26
5
18
FY27E
15
18
18
22
10
7
19
18
10
25
10
34
7
0
15
Exhibit 36: Sectoral upgrades/downgrades for the MOFSL Universe
PAT (INR b) - preview
Sector
Automobiles
Capital Goods
Cement
Chemicals-Specialty
Consumer
Consumer Durables
EMS
Financials
Banks-Private
Banks-PSU
Insurance
NBFC - Lending
NBFC - Non Lending
Healthcare
Infrastructure
Logistics
Media
Metals
Oil & Gas
Excl. OMCs
Real Estate
Retail
Staffing
Technology
Telecom
Utilities
Others
FY25E
934
275
209
76
618
55
18
4,098
1,849
1,540
93
568
48
532
21
148
26
1,070
1,902
1,554
137
115
11
1,223
-3
483
163
FY26E
1,138
348
283
99
701
69
28
4,778
2,141
1,750
108
723
56
630
28
187
33
1,413
2,355
1,914
169
156
14
1,381
111
533
239
FY27E
1,348
415
346
119
780
84
39
5,662
2,544
2,020
131
900
67
705
31
221
39
1,647
2,543
2,090
175
200
17
1,527
202
566
325
16,989
PAT (INR b) - review
FY25E
927
276
180
72
601
52
20
4,041
1,823
1,561
91
519
47
527
20
146
27
1,049
1,635
1,452
124
105
10
1,228
-4
451
159
11,646
FY26E
1,062
347
260
95
682
65
29
4,702
2,117
1,729
105
693
57
628
26
181
33
1,415
2,093
1,793
178
142
14
1,388
95
519
245
14,198
FY27E
1,238
415
327
116
761
81
41
5,539
2,502
1,977
128
863
69
707
32
219
38
1,648
2,288
1,978
178
182
16
1,540
224
549
340
16,478
Upgrade/downgrade (%)
FY25E
-0.8
0.6
-14.0
-5.4
-2.7
-5.8
9.6
-1.4
-1.4
1.3
-2.3
-8.6
-1.2
-1.0
-4.2
-1.5
2.9
-2.0
-14.0
-6.6
-9.3
-9.1
-6.8
0.4
-244.5
-6.6
-2.8
-3.8
FY26E
-6.7
-0.4
-8.0
-4.1
-2.6
-4.5
3.7
-1.6
-1.1
-1.2
-2.8
-4.0
1.0
-0.3
-5.3
-3.2
1.0
0.1
-11.1
-6.4
4.9
-8.9
-4.4
0.5
-14.9
-2.6
2.7
-3.4
FY27E
-8.2
0.0
-5.5
-2.6
-2.4
-3.0
5.7
-2.2
-1.7
-2.1
-2.8
-4.0
4.0
0.2
0.4
-0.8
-1.4
0.0
-10.0
-5.4
1.2
-9.0
-3.3
0.9
10.9
-2.9
4.7
-3.0
Growth YoY (%)
FY25E FY26E FY27E
8.5
23.9
-22.9
5.5
2.6
24.9
84.3
12.8
7.8
20.6
22.6
5.3
49.8
22.7
17.6
20.2
9.8
20.4
-32.6
-8.6
31.1
21.5
49.8
10.0
Loss
7.5
12.6
3.8
14.5
25.4
44.6
31.4
13.5
25.7
48.1
16.3
16.1
10.8
15.2
33.5
20.6
19.2
27.5
24.0
23.5
34.9
28.0
23.5
43.2
35.8
31.8
13.0
LP
15.1
54.6
21.9
16.6
19.7
25.8
22.3
11.5
24.3
41.4
17.8
18.2
14.3
21.6
24.5
22.1
12.5
20.9
21.1
16.3
16.4
9.3
10.3
0.0
27.7
19.7
11.0
136.7
5.8
38.7
16.1
MOFSL Universe
12,112 14,692
Note: PL: Profit to loss; LP: Loss to profit
November 2024
12
 Motilal Oswal Financial Services
India Strategy | Review 2QFY25
Exhibit 37: Nifty delivered 4% YoY profit growth in 2QFY25
Sales
Chg. Var.
Sep 2024
YoY (%) (%)
2
4
-6
-8
-3
1
-3
0
2
2
1
0
0
-1
-4
-9
1
2
1
0
0
-4
2
-1
-4
1
8
1
0
1
1
-2
0
3
11
1
0
1
0
-5
-2
1
-3
-6
4
0
-2
-4
-4
0
1
EBITDA
Sep
Chg. Var.
2024 YoY (%) (%)
79
8
6
15
14
218
97
293
18
38
46
27
40
107
182
9
167
15
39
73
19
44
64
6
11
79
64
247
44
168
51
88
98
22
68
15
38
3
391
12
8
117
72
12
55
20
36
45
54
3,479
2,601
40
30
39
-3
38
12
-8
51
24
25
8
24
14
24
-1
17
18
14
26
25
9
13
7
17
0
23
13
9
-8
7
11
3
3
10
5
8
0
-45
-5
-5
-10
-14
-20
-28
29
-21
-8
-65
-31
5
12
20
8
-8
-14
26
1
-19
9
7
8
4
2
-4
5
-1
-4
6
3
7
2
2
1
7
7
-8
-1
5
1
-4
-1
-4
-4
4
1
1
-7
0
-17
-2
-11
-16
-11
-28
-18
18
-7
-10
-42
20
-1
0
PBT
Sep
Chg. Var.
2024 YoY (%) (%)
62
6
6
5
15
68
61
248
17
35
43
29
27
85
150
4
155
16
49
54
18
29
57
4
12
60
56
220
43
160
44
44
93
19
68
12
36
11
250
10
7
57
80
11
16
10
18
32
12
2,647
2,045
92
47
48
41
35
23
14
28
55
23
22
22
17
9
12
32
14
15
14
13
9
17
11
-16
4
13
11
11
-11
5
5
1
6
13
3
-1
-1
10
-5
-8
-10
-7
-22
-32
2,633
-40
-39
-72
-70
4
11
48
9
5
4
18
-1
-4
12
37
3
12
3
-1
-4
22
2
7
8
16
-1
4
-5
8
-8
-4
-3
8
1
-11
-4
-5
-2
3
4
-1
-14
-1
-8
3
-15
-18
-2
-24
-21
139
-18
-36
-49
85
1
1
PAT
Sep
Chg. Var.
2024 YoY (%) (%)
43
4
4
5
11
39
42
183
13
29
32
22
21
69
120
4
117
12
38
40
13
25
42
4
11
21
34
168
39
120
33
35
65
14
50
9
26
8
166
8
5
33
63
9
5
8
13
24
6
1,923
1,497
97
64
46
39
34
32
29
28
28
22
21
21
18
18
17
15
14
14
13
13
11
11
11
10
8
8
5
5
5
5
5
5
5
2
2
2
-2
-5
-5
-7
-9
-14
-22
-29
-36
-36
-40
-72
-80
4
11
36
5
6
3
18
-12
-9
12
31
2
11
3
0
4
30
3
8
7
14
0
6
-4
9
14
2
-11
6
3
6
-4
-5
-3
-1
-5
-2
-14
-3
-18
4
-17
-18
-22
-22
-19
LP
-12
-36
-48
35
1
1
EBITDA Margin
Sep 2024 Chg.
(%)
YoY bp
13.5
14.6
15.9
7.1
30.3
52.7
24.0
70.4
13.1
28.5
20.5
20.2
72.9
79.5
53.8
5.7
83.4
14.5
14.3
82.7
26.7
61.8
22.1
14.9
25.5
28.4
10.3
82.0
11.9
26.1
72.6
85.6
23.8
27.5
32.6
10.5
23.8
4.3
16.9
23.3
16.8
11.6
23.3
15.4
10.2
12.9
67.3
4.4
13.7
24.3
29.5
3.2
1.6
-0.1
-0.3
5.1
0.0
-1.8
21.2
2.2
3.3
1.7
0.4
-2.8
9.4
1.6
0.2
5.7
0.4
1.5
1.6
0.8
3.4
-0.2
0.5
-0.9
-1.1
-0.7
-0.8
-1.0
-0.2
-0.6
-1.9
-0.5
-1.5
-3.7
-0.8
-0.5
-4.9
-0.8
-1.5
-2.9
-1.5
-3.8
-4.8
2.6
-3.0
-9.7
-8.2
-4.0
0.2
1.1
Company
High PAT growth
Hindalco
582
7
Apollo Hospitals
56
15
Trent
40
40
SBI Life Insurance
204
1
Bharat Electronics
46
15
Bharti Airtel
415
12
NTPC
403
-1
State Bank
416
5
Tech Mahindra
133
3
Sun Pharma
133
11
Wipro
223
-1
Bajaj Auto
131
22
Med/Low PAT growth
Shriram Finance
55
19
Axis Bank
135
9
ONGC
339
-4
HDFC Life Insur.
166
12
ICICI Bank
200
10
Hero Motocorp
105
11
Mahindra & Mahindra
276
13
Bajaj Finance
88
23
Cipla
71
6
Adani Ports
71
6
HCL Technologies
289
8
Tata Consumer
42
13
Eicher Motors
43
4
Bajaj Finserv
277
28
Larsen & Toubro
616
21
HDFC Bank
301
10
Maruti Suzuki
372
0
TCS
643
8
Kotak Mahindra Bank
70
11
Power Grid Corp.
103
5
Infosys
410
5
Dr Reddy’ s Labs
80
17
ITC
207
17
Titan Company
145
16
PAT Decline
Hind. Unilever
159
2
Grasim Industries
76
18
Reliance Inds.
2,315
0
Nestle
51
1
Britannia
47
5
Tata Motors
1,015
-3
Coal India
307
-6
Asian Paints
80
-5
Tata Steel
539
-3
Ultratech Cement
156
-2
IndusInd Bank
53
5
BPCL
1,028
0
JSW Steel
397
-11
Nifty Universe
14,333
4
Ex-Metals & Oil
8,827
8
Note: PL: Profit to loss; LP: Loss to profit
November 2024
13
 Motilal Oswal Financial Services
India Strategy | Review 2QFY25
Nifty EPS experiences a downward revision
The Nifty EPS for FY25E was cut 1.4% to INR1,057, largely owing to ONGC, BPCL, Reliance Inds, and Coal India.
Ex-Commodities, Nifty EPS saw no downgrade for FY25E. FY26E EPS was also trimmed 2.2% to INR1,241 (vs.
INR1,269) led by downgrades in ONGC, BPCL, Reliance Inds, and Tata Motors.
The top earnings upgrades in FY25E:
Bharti Airtel (16.3%), Tata Motors (11.6%), Tech Mahindra (8.8%), Hindalco
(8.6%), and Tata Consumer (6.3%).
The top earnings downgrades in FY25E:
BPCL (-34.3%), Indusind Bank (-16.7%), Ultratech Cement (-15.5%),
Asian Paints (-14%), and Trent (-12.1%).
Current EPS (INR)
FY25E
FY26E
FY27E
35.9
45.4
60.6
63.7
63.0
68.3
47.9
63.7
71.1
68.4
63.1
74.4
16.0
19.5
21.5
97.4
126.3
164.5
111.1
137.2
160.3
65.4
73.3
85.4
63.7
71.9
80.3
22.6
24.5
25.9
89.3
98.8
115.4
95.5
108.5
130.5
49.3
59.3
67.4
302.1
387.9
492.8
6.7
8.2
9.9
85.1
98.2
115.5
223.3
264.7
321.6
63.4
71.1
79.6
50.8
60.5
72.2
141.0
156.8
172.0
88.2
100.1
115.6
227.4
249.1
278.7
158.8
171.3
196.6
16.7
18.2
19.8
45.3
51.0
56.2
69.3
79.7
69.9
266.7
343.8
441.2
23.9
24.8
27.7
8.3
9.5
10.6
99.7
116.2
136.7
31.5
67.8
85.5
56.8
62.7
66.1
5.7
12.2
18.0
17.5
18.4
19.5
43.0
53.6
64.0
48.4
64.8
73.5
34.0
38.6
43.6
444.6
500.6
566.9
56.8
67.4
70.5
93.5
107.0
120.7
21.6
25.7
27.8
82.1
100.5
119.2
40.8
46.7
49.3
47.8
65.9
89.8
47.5
55.2
62.7
211.9
313.6
392.7
94.9
128.2
163.1
21.4
26.2
26.9
1,057
1,241
1,432
EPS Upgrade / Downgrade (%)
FY25E
FY26E
FY27E
16.3
-2.7
-0.8
11.6
-9.4
-14.9
8.8
0.8
1.1
8.6
0.0
-0.3
6.3
-3.0
-2.7
3.1
0.6
12.8
2.9
1.0
1.4
2.8
1.8
0.0
2.4
2.7
3.4
2.3
0.1
0.8
1.8
-2.1
-2.9
1.0
-1.8
-4.1
0.3
2.4
1.6
0.0
0.0
0.0
0.0
0.0
0.0
-0.5
-0.4
-0.4
-0.7
-2.9
-2.9
-0.8
-1.5
-1.0
-0.9
-0.9
-0.9
-1.0
0.1
0.1
-1.2
-0.6
0.5
-1.3
-11.0
-15.9
-1.5
-2.5
-1.3
-1.9
-1.8
-1.7
-2.1
-2.5
-2.2
-2.1
2.4
-1.8
-2.4
-5.4
-7.2
-2.5
-0.8
-0.7
-2.7
-0.6
-6.5
-3.1
-5.3
-6.6
-3.1
0.0
0.0
-3.2
-4.4
-3.1
-3.3
-1.5
0.4
-4.5
-4.0
-3.1
-5.4
-4.9
-4.2
-5.6
-3.4
-2.0
-6.1
-3.9
-4.2
-6.4
-9.0
-8.8
-7.3
0.0
0.0
-7.6
-6.1
-5.1
-8.3
-2.8
-3.1
-8.4
-2.9
-0.7
-9.4
-11.4
-11.3
-12.1
-9.9
-6.4
-14.0
-10.7
-10.2
-15.5
-6.8
-3.9
-16.7
-8.7
-7.2
-34.3
-26.3
-25.3
-1.4
-2.2
-2.2
EPS Growth (%)
FY25E
FY26E
82.5
26.6
8.6
-1.2
16.5
33.1
49.9
-7.7
11.3
22.3
56.0
29.7
17.6
23.4
12.0
12.1
10.1
12.9
11.0
8.1
18.7
10.7
4.3
13.6
19.0
20.2
9.4
28.4
21.0
22.7
5.4
15.5
16.7
18.5
0.2
12.0
23.0
19.2
11.7
11.2
10.2
13.5
11.1
9.6
8.5
7.9
1.9
9.2
3.7
12.5
9.2
15.0
14.1
28.9
26.1
3.8
13.2
14.8
12.4
16.5
-14.3
114.8
8.3
10.3
111.6
112.4
4.7
5.2
9.6
24.7
-6.0
34.1
-17.1
13.5
3.6
12.6
-6.5
18.7
5.5
14.4
0.7
18.8
-14.2
22.5
-12.0
14.6
63.4
38.1
-18.0
16.2
-13.3
48.0
-17.9
35.1
-66.2
22.2
5.1
17.4
Exhibit 38: FY25E EPS revisions – Five Nifty constituents saw upgrades of over 5%, while 14 witnessed downgrades of over 5%
Company
Bharti Airtel
Tata Motors
Tech Mahindra
Hindalco
Tata Consumer
Apollo Hospitals
Larsen & Toubro
ICICI Bank
HCL Technologies
Wipro
State Bank
Kotak Mahindra Bank
Sun Pharma
Bajaj Auto
Bharat Electronics
Axis Bank
Shriram Finance
Infosys
Adani Ports
TCS
HDFC Bank
Hero MotoCorp
Eicher Motors
ITC
Hind. Unilever
Dr Reddy’ s Labs
Bajaj Finance
SBI Life Insurance
HDFC Life Insur.
Mahindra & Mahindra
JSW Steel
Cipla
Tata Steel
Power Grid Corp.
Titan Company
Reliance Inds.
Nestle
Maruti Suzuki
Coal India
Britannia
NTPC
Grasim Industries
ONGC
Trent
Asian Paints
Ultratech Cement
IndusInd Bank
BPCL
Nifty (50)
FY24
36.7
2628.0
-28.2
0.8
26.1
29.6
24.5
27.5
5.6
-1.5
20.6
21.9
15.8
28.9
33.7
14.9
19.8
10.0
16.5
9.5
1.0
40.5
37.3
9.0
0.7
29.6
22.8
9.9
15.3
34.0
148.7
39.0
-61.8
1.0
6.8
4.4
62.5
56.8
17.8
10.1
23.1
-2.9
44.9
162.5
30.9
39.4
20.3
1271.9
24.1
FY27E
33.5
8.5
11.5
17.8
10.0
30.2
16.9
16.6
11.6
5.9
16.8
20.3
13.7
27.0
20.9
17.6
21.5
12.1
19.3
9.7
15.4
11.9
14.8
8.4
10.1
-12.3
28.3
11.7
11.5
17.7
26.2
5.5
48.2
5.9
19.3
13.4
12.8
13.2
4.7
12.8
8.3
18.5
5.5
36.1
13.6
25.2
27.2
3.0
15.4
November 2024
14
 Motilal Oswal Financial Services
India Strategy | Review 2QFY25
Exhibit 39: We estimate a 12% CAGR for the Nifty free-float PAT over FY24–26
Company
High PAT Growth (20%+)
Tata Steel
Bharti Airtel
Trent
Apollo Hospitals
JSW Steel
Adani Enterprises
Tech Mahindra
Bajaj Finserv
Bharat Electronics
Bajaj Finance
Adani Ports
Larsen & Toubro
Sun Pharma
Medium PAT Growth (0-20%)
Tata Consumer
Bajaj Auto
Shriram Finance
Hindalco
Titan Company
State Bank
Ultratech Cement
Mahindra & Mahindra
SBI Life Insurance
HDFC Life Insur.
Reliance Inds.
ICICI Bank
Dr Reddy’ s Labs
HDFC Bank
HCL Technologies
TCS
Hero MotoCorp
Axis Bank
Infosys
Britannia
NTPC
Cipla
Kotak Mahindra Bank
Eicher Motors
Hind. Unilever
Maruti Suzuki
Wipro
ITC
IndusInd Bank
Coal India
Power Grid Corp.
Grasim Industries
Tata Motors
ONGC
PAT de-growth (<0%)
Asian Paints
Nestle
BPCL
Nifty (PAT free float)
Sales
CAGR %
24-26
12
6
12
36
15
11
3
4
32
19
26
14
15
10
7
10
18
21
7
17
8
11
12
13
18
7
11
16
12
8
8
10
12
8
9
8
8
12
9
6
6
2
9
12
9
6
17
5
-4
-7
5
-3
-8
7
EBITDA Margin (%)
FY25E
24
12
53
16
14
15
13
13
68
25
82
59
11
27
25
15
20
74
13
10
67
17
14
7
5
17
82
28
82
22
27
14
77
23
18
30
25
76
27
24
13
20
35
71
34
86
5
13
17
7
18
24
5
24
FY26E
26
15
55
16
14
19
13
16
61
25
80
60
11
29
27
15
21
74
12
10
67
20
14
7
6
20
83
28
83
22
28
14
79
24
18
31
25
75
26
24
14
20
36
73
35
85
8
13
19
8
19
25
6
25
FY27E
27
17
56
17
14
19
13
16
58
25
79
60
11
29
27
15
21
75
12
10
67
21
15
7
6
20
83
25
85
22
28
14
79
25
19
32
25
75
26
24
14
20
36
75
35
84
9
13
19
8
20
25
6
26
EBITDA
CAGR %
24-26
19
30
15
40
22
20
12
25
20
20
26
15
18
16
11
13
22
20
9
17
20
14
17
14
17
12
14
15
10
9
11
10
15
9
7
13
9
12
7
7
9
5
7
9
11
5
11
4
2
-22
0
-3
-30
11
PAT (INR b)
FY24
912
34
113
10
9
90
35
36
81
40
144
89
130
100
6,637
14
77
72
101
35
671
71
106
19
16
696
409
53
608
157
462
41
249
243
21
208
42
182
40
103
135
110
205
90
374
156
63
225
583
366
56
40
271
4,461
FY25E
1,183
71
206
17
14
77
57
42
103
49
165
110
153
119
6,966
16
84
84
152
38
797
61
120
24
18
654
459
58
670
174
512
46
263
263
23
210
46
190
43
107
140
120
209
74
350
163
54
234
513
170
46
33
91
4,748
FY26E
1,607
152
275
23
18
165
57
57
125
60
213
131
189
143
8,000
19
108
99
140
48
882
92
139
25
20
877
514
66
761
196
569
50
303
295
26
249
51
216
47
120
157
128
228
100
415
172
66
231
588
202
53
37
112
5,574
FY27E
2,006
225
367
32
24
209
57
63
146
72
273
156
220
162
9,029
21
138
121
165
57
1,030
116
164
28
23
995
600
58
878
218
624
56
356
330
29
270
53
259
54
132
178
136
247
127
435
182
78
251
620
217
60
42
115
6,434
PAT
Contbn to
CAGR %
Delta %
24-26
33
37
112
6
56
9
50
1
42
0
36
4
28
1
25
1
24
2
22
1
21
4
21
2
20
3
20
2
10
72
19
0
19
2
18
1
18
2
17
1
15
11
14
1
14
2
14
0
14
0
12
10
12
6
12
1
12
8
12
2
11
6
10
0
10
3
10
3
10
0
9
2
9
0
9
2
8
0
8
1
8
1
8
1
6
1
5
1
5
2
5
1
3
0
1
0
0
0
-26
-9
-2
0
-3
0
-36
-8
12
100
November 2024
15
 Motilal Oswal Financial Services
India Strategy | Review 2QFY25
FY25E earnings highlights: Banks, Metals, and Technology to
drive the incremental earnings
The MOFSL Universe is likely to deliver sales/EBITDA/PAT growth of 6%/5%/4% YoY
in FY25E. The Banks, Metals, and Technology sectors are projected to be the key
growth engines, with 13%, 20%, and 10% YoY earnings growth, respectively. They
are likely to contribute 161% of the incremental earnings in FY25E.
Exhibit 40: Banks, Metals, and Technology to lead the incremental profits for FY25E (PAT, INR b)
97
267 178 132 130 112
73
53
31
29
26
25
19
18
17
16 15
10
9
4
3
3
2
54 790
Exhibit 41: Delta contribution to FY25E profit for the MOFSL Universe (%)
63
42
Delta Contribution (%)
31
31
26
23
17
12
7
7
6
6
4
4
4
4
4
2
2
1
1
1
1
-13
-185
November 2024
16
 Motilal Oswal Financial Services
India Strategy | Review 2QFY25
MOFSL Universe saw 9% earnings downgrade for FY25E on a TTM
basis
Cement, Chemicals, and Retail witness downgrades
Over the last one year, earnings revisions for the MOFSL Universe saw a cut of
9%.
NBFC Non-lending, Autos, Healthcare, and PSU Banks saw upgrades of 30%, 7%,
5%, and 2%, while Cement, Chemicals, Retail, O&G & Consumer witnessed
significant earnings downgrades of 33%, 32%, 26%,18% and 12%, respectively.
Exhibit 42: Autos and Healthcare saw major earnings upgrades, while Cement saw downgrades over the last one year
30
7
5
2
0
-5
% revision in PAT
-8
-9
-9
-10
-12
-12
-14
-16
-18
-23
-24
-26
-26
-32
-33
PL
Note: Comparable MOFSL Universe of 233 companies
Exhibit 43: Annual Sales/EBITDA/PAT estimates for the MOFSL Universe
Sales (INRb)
Growth YoY (%)
EBITDA (INRb)
Growth YoY (%)
PAT (INRb)
Growth YoY (%)
Sector
FY25E FY26E FY27E FY25E FY26E FY27E FY25E FY26E FY27E FY25E FY26E FY27E FY25E FY26E FY27E FY25E FY26E FY27E
Automobiles
12,078 13,536 15,132 6
12
12 1,646 1,886 2,141 5
15
14 927 1,062 1,238 9
15
17
Capital Goods
3,788 4,329 4,968 19
14
15 449 536 621 23
19
16 276 347 415 24
25
20
Cement
2,314 2,676 2,986
2
16
12 333 461 560 -12 39
21 180 260 327 -23 45
26
Chemicals-Specialty 680
773
874
10
14
13 128 160 190
8
26
18
72
95
116
5
31
22
Consumer
3,490 3,847 4,238
6
10
10 846 946 1,049 4
12
11 601 682 761
3
14
12
Consumer Durables 744
860
994
17
16
16
72
91
112 19
26
23
52
65
81
25
26
24
EMS
565
738
912
77
31
24
34
47
63
68
39
32
20
29
41
84
48
41
Financials
11,782 13,484 15,595 12
14
16 6,602 7,598 8,883 15
15
17 4,041 4,702 5,539 13
16
18
Banks-Private
3,771 4,309 5,050 12
14
17 2,853 3,309 3,922 11
16
19 1,823 2,117 2,502 8
16
18
Banks-PSU
3,606 3,988 4,441
6
11
11 2,543 2,818 3,166 17
11
12 1,561 1,729 1,977 21
11
14
Insurance
2,939 3,414 3,957 14
16
16 136 169 205 10
25
21
91
105 128 23
15
22
NBFC-Lending
1,344 1,630 1,980 20
21
21 1,010 1,231 1,504 19
22
22 519 693 863
5
34
24
NBFC-Non Lending 123
143
167
46
16
17
59
71
86
70
20
20
47
57
69
50
21
22
Healthcare
3,489 3,927 4,350 11
13
11 842 974 1,076 20
16
10 527 628 707 23
19
13
Infrastructure
186
216
252
-2
16
17
52
62
73
3
18
18
20
26
32
18
28
21
Logistics
655
769
910
13
17
18 246 291 343 14
19
18 146 181 219 20
24
21
Media
189
207
226
0
9
9
44
51
57
3
17
13
27
33
38
10
24
16
Metals
11,735 13,254 14,307 5
13
8 2,179 2,705 3,021 16
24
12 1,049 1,415 1,648 20
35
16
Oil & Gas
35,370 36,871 38,178 0
4
4 3,653 4,428 4,759 -21 21
7 1,635 2,093 2,288 -33 28
9
Excl. OMCs
19,070 19,799 21,025 1
4
6 3,080 3,689 3,987 -3
20
8 1,452 1,793 1,978 -9
23
10
Real Estate
606
730
761
28
20
4
170 236 240 29
38
2
124 178 178 31
43
0
Retail
2,255 2,678 3,147 20
19
17 253 311 373 19
23
20 105 142 182 22
36
28
Staffing
482
549
625
12
14
14
17
22
25
16
24
18
10
14
16
50
32
20
Technology
7,819 8,533 9,305
6
9
9 1,759 1,999 2,207 7
14
10 1,228 1,388 1,540 10
13
11
Telecom
2,654 2,957 3,305 10
11
12 1,325 1,480 1,681 16
12
14
-4
95
224 Loss LP 137
Utilities
3,332 3,594 3,819 12
8
6 1,215 1,323 1,441 15
9
9
451 519 549
7
15
6
Others
2,383 2,745 3,166 13
15
15 393 466 587 20
19
26 159 245 340 13
55
39
MOFSL Universe
106,593 117,270 128,048
6
10
9
22,258 26,074 29,504
5
17
13 11,646 14,198 16,478
4
22
16
Source: MOFSL
November 2024
17
 Motilal Oswal Financial Services
India Strategy | Review 2QFY25
SECTOR-WISE:
Highlights / Surprise / Guidance
AUTOS: Demand moderation drives earnings cuts
Rural demand boosts outlook for tractors and 2Ws; PV and CV to remain moderate in 2H:
Auto OEMs reported
~9% YoY volume growth for the quarter, driven entirely by 2W and 3W segments, which grew around 13% and
7% YoY, respectively. PV volumes declined ~2% YoY, with a 9% growth in SUVs offsetting 20% YoY drop in
passenger cars. CV volumes declined 11% YoY, while tractor volumes rose moderately by 1% YoY. We are
witnessing an uptick in rural demand after several quarters, spurred by a healthy monsoon and an increase in
MSP for major crops. Further, the ongoing marriage season in November is expected to help drive momentum
for segments such as 2Ws and tractors. Overall, the 2W demand is likely to remain steady for the rest of the
fiscal year, with the industry likely to post a high single-digit growth for FY25. Tractor OEMs have already raised
their FY25 volume growth guidance to 6-7% (from low single digits previously). For PVs, volume growth is likely
to stay muted due to weak entry-level demand and limited SUV growth from a high base last year. After a weak
H1, we expect CV demand to pick up in 2H (4% YoY decline) as the government is likely to revive its capex plans
in H2.
Exports – Weak demand in Europe continues:
2W export volumes grew ~16% YoY (on a low base). The outlook
remains upbeat for regions such as Latin America, while weak for Africa and Bangladesh. However, PV demand
challenges persist, particularly in Europe and China. This slowdown is likely to impact not only OEMs such as JLR
but also ancillary companies that export to these regions. Additionally, rising freight and energy costs are
expected to impact margins going forward.
EBITDA miss driven by higher RM, discounts, and rising operational costs:
Total revenue/EBITDA/PAT for our
coverage universe grew ~3.8%/-1.5%/5.8% YoY. While revenue and PAT aligned with expectations, EBITDA fell
short, largely due to higher discounts, particularly for OEMs. Additionally, increased operational costs, including
freight and advertising, further impacted margins, which resulted in an EBITDA margin contraction of ~70bp YoY
to 12.8% (vs. an estimated 13.5%). OEMs saw a similar trend, with revenue, EBITDA, and PAT growing ~1.6%, -
2.5%, and 6% YoY and EBITDA missing estimates.
Expect margins to remain range-bound in the coming quarters:
Commodity prices, excluding rubber, are
expected to remain stable in 2H. However, while we expect H2 volumes to be better than 1H, the increase in
operating costs, such as freight and energy costs, is likely to offset these gains. Hence, we expect margins to
remain at similar levels in 2H across most business segments. On the other hand, tire company margins are
expected to face continued pressure in 3Q, and start improving from 4Q onwards as input costs are likely to
peak out by then.
Several EPS downgrades amid demand moderation:
The quarter witnessed several downgrades in FY25 EPS
estimates. Among OEMs, we saw EPS downgrades in MSIL (-6%), AL (-11%), BHFC (-16%), MOTHERSO (-13%),
CEAT (-9%), APTY (-16%), MRF (-6%), MSUMI (-11%), TIINDIA (-24%), and CRAFTSMA (-17%), largely due to
moderate demand in the underlying segments. Our ratings remain unchanged during the quarter.
Valuation and view:
As highlighted above, given the moderation in demand across various segments and an
uncertain outlook for exports, majority of our coverage companies (~11/17 in FY25E/26E, respectively, out of 26
companies) witnessed earnings downgrades during the 2QFY25 results. However, post the recent correction in
stock prices over the last quarter, we expect the sector to be back on investors’ radar. With the PV sector having
seen base correction this fiscal, we expect it to witness gradual demand revival from FY26 onwards. Given this,
along with the relatively attractive valuations, we continue to prefer PVs over 2Ws. MSIL is our top pick in Autos
along with MM and Hyundai.
Surprises:
MM, SONACOMS
Misses:
APTY, BHFC, CEAT, CRAFTSMA, ESCORTS, MSUMI, MOTHERSO, TTMT, TIINDIA
Note:
We have not considered Hyundai financials for comparison as it was not part of our coverage universe during
the 2QFY25 preview estimates.
Guidance highlights:
MSIL:
The management has given retail growth guidance of 3-4% for FY25. Rural is outperforming the urban
market. Its inventory level post the festive season is expected to normalize to approximately one-month level.
November 2024
18
 Motilal Oswal Financial Services
India Strategy | Review 2QFY25
The management indicated that during the period from Shradh to the festive end (i.e. from 29th Sep to 12th
Nov’23 and from 17th Sep to 31st Oct’24), MSIL is likely to experience 14% YoY growth in retail to 297k units (vs.
260k units in the same period last year).
MM:
Auto -
The management has reiterated its FY25 volume growth guidance of 15-18% YoY for its UV
segment. Despite tepid demand, new launches should help MM outperform. Urban pockets have shown stress,
while its rural mix for LCVs/UVs stands at 65%/50%.
Tractors:
MM has increased its growth guidance to 6-7% for
FY25, mainly due to positive macroeconomic factors such as higher reservoir levels, growth in the kharif output,
and a hike in the MSP of key crops.
TTMT:
JLR -
Despite tough market conditions, JLR maintained its FY25 guidance for EBIT margin at 8.5% and
reduced its FCF to GBP1.3b from GBP1.8b.
CV -
With the festive demand and increased infra spending, CV
demand is expected to revive in 2H. Passenger bus is expected to experience further growth in 2H.
PV -
Channel
inventory now stands at below 30 days. It expects lower industry wholesales in the next few months as OEMs
focus on streamlining inventory to adequate levels ahead.
AL:
An upturn
is expected in demand with favorable government spending and possible rate cuts. Replacement
demand and MHCV volumes have shown a decline due to uneven weather and rainfall and slow GOI spending.
Management remained upbeat on MHCV demand, aiming at 35% market share. Fleet age is at its peak
currently at 10-11 years (vs. average 7-8 years). This, coupled with a high fleet utilization level, instills confidence
in recovery in replacement starting this month.
BJAUT:
Domestic 2W -
The management is hopeful of a demand recovery in Diwali and expects the overall
festive season to end with 3-5% YoY growth. The management expects the 2W industry to clock 5% growth in
FY25.
Exports 2W -
2Q was better than 1Q and 3Q is expected to improve further with over 10% growth. On
account of a richer mix and favorable USD exchange rates, export revenue growth is likely to be better than
volume growth going forward.
HMCL:
It has witnessed good recovery in both the entry and 125cc segments for the last couple of quarters.
Moreover, rural growth is ahead of urban growth. The management has indicated that its retail market share
was ahead of the wholesale market share in 2Ws in 1Q.
TVSL:
Domestic 2W industry has grown 11% YoY during Navratras (4% YoY growth seen to date in 3QFY25), with
TVSL outperforming the industry. Overall, the industry is expected to see 7-8% YoY growth in 3QFY25.
Exports -
The ongoing Red Sea crisis continued to hurt the export transit time and timely availability of containers.
However, TVSL has seen a pick-up in retail, which is higher than the industry.
EIM:
Domestic -
After strong growth of 26% YoY during the festival season (vs. industry growth of 6-7% YoY), RE
is now witnessing better demand compared to the pre-festive period. This can be attributed to its new launches,
the high availability of all the models, and increased promotional activities to drive consumer interest.
VECV -
2HFY25 CV demand is expected to witness a revival, according to the management. 1HFY25 remained subdued
due to elections, delays in tenders, and monsoons.
MOTHERSO:
The demand has grown 4-5% YoY despite a decline in the global light vehicle market due to
premiumization and EV penetration. Booked business stands at USD87.7b, this would be executed over the next
5-6 years. Almost 24% of this comes from EVs.
BHFC:
Domestic CV -
It expects to see a visible pickup in demand in another 1-2 quarters as elections are now
behind us and the government should resume its capex.
Defense business -
With order wins of INR6.4b in 2Q
(1HFY25=INR14b), the executable order book as of Sep’24 stood at INR59b, with a mix of artillery guns, vehicles,
and consumables. Given this order book, the management expects to post 50%+ growth in the defense business
in FY25 and expects the same to continue next year as well.
BIL:
The management has guided for minor volume growth YoY in FY25 due to persistent recessionary pressure
in the US, elevated sea freight, and geopolitical challenges. EBITDA margin guidance for the full year is ~25%.
Increased capex guidance -
The company has increased its capex guidance to INR8-10b for FY25 vs. INR6-7b
earlier.
November 2024
19
 Motilal Oswal Financial Services
India Strategy | Review 2QFY25
Exhibit 44: Key operating indicators
Volumes ('000 units)
EBITDA Margins (%)
Adj PAT (INR M)
2QFY25 2QFY24 YoY % 1QFY25 QoQ % 2QFY25 2QFY24 YoY bp 1QFY25 QoQ bp 2QFY25 2QFY24 YoY % 1QFY25 QoQ %
Bajaj Auto
1,222 1,054 15.9 1,102 10.8
20.2
19.8
40
20.2
0
22,160 18,361 20.7 19,884 11.4
Hero MotoCorp
1,520 1,417 7.3 1,535 -1.0
14.5
14.1
40
14.4
10
12,035 10,538 14.2 11,226 7.2
TVS Motor
1,228 1,074 14.3 1,087 13.0
11.7
11.0
70
11.5
20
6,626
5,366 23.5 5,773 14.8
Maruti Suzuki
542
552
-1.9
522
3.8
11.9
12.9 -100 12.7
-80 39,068 37,165 5.1 36,499 7.0
M&M
324
303
7.1
333 -2.6
14.3
12.8
150 14.9
-50 38,409 33,931 13.2 26,126 47.0
TTMT India CV**
86
107 -19.5
94
-8.2
10.7
10.4
30
11.6
-90 13,140 15,270 -13.9 15,350 -14.4
TTMT India PV**
131
139
-6.1
139 -6.0
6.2
6.4
-20
5.8
40
2,290
2,980 -23.2 1,730 32.4
TTMT (JLR)
97
109 -10.9 110 -12.0 11.7
14.9 -320 15.8 -410
283
272
4.0
496
-43.0
Ashok Leyland
46
50
-8.5
44
3.9
11.6
11.2
40
10.6 100
6,933
5,768 20.2 5,256 31.9
Eicher(Consol)
26.3
27.9 -160 27.9 -160 11,003 10,163 8.3 11,015 -0.1
Eicher - RE
228
229
-0.6
226
0.8
26.3
27.9 -160 27.9 -160 10,099 9,385 7.6 10,880 -7.2
Eicher - VECV
21
20
6.3
20
5.4
7.1
7.8
-70
7.6
-50
2,090
1,870 11.8 2,330 -10.3
Aggregate **
5,443 5,042 7.9 5,179 5.1
13.1
12.8
40
13.4
-30 1,36,235 1,38,718 -1.8 1,15,780 17.7
# We have not captured Hyundai in the sheet as it was not the part of preview ** PBT instead of PAT; JLR in GBP m; Source: MOFSL, Company
Exhibit 45: Aggregate EBITDA margin contracted 30bp QoQ
to 13.1% mainly due to higher operational costs, discounts
Aggregate (excl JLR)
11.7
12.0
7.5
11.0
8.2
8.4
9.2
11.7
9.9
9.9
11.2
11.5
12.8
13.2 13.1
Exhibit 46: Gross margins contracted 70bp QoQ, led by
higher discounts and rising RM
Agg RM cost (%, Ex JLR)
73.1
75.1
75.4
75.4
75.5
73.7
72.1
71.5 71.4
72.3
70.7
12.8
13.4
73.2
59.6
58.8
75.6
74.0
73.4
Revised EPS Estimates (INR)
Rev
302.1
227.4
53.6
158.8
444.6
99.7
63.7
68.3
9.7
102.0
53.8
13.5
732
60.2
22.0
28.0
5.5
10.7
131.9
21.3
85.0
4,472.1
1.4
46.0
120.1
30.2
FY25E
Old
302.0
230.3
52.5
161.1
475.1
103.0
57.1
68.7
10.9
99.9
54.5
13.7
732
61.9
21.7
33.4
6.3
10.2
145.0
25.4
82.0
4,745.7
1.6
60.6
144.4
30.5
Chg (%)
0.0
-1.3
2.2
-1.5
-6.4
-3.1
11.6
-0.5
-10.8
2.0
-1.4
-1.4
0.0
-2.8
1.4
-16.2
-13.1
4.3
-9.0
-16.1
3.7
-5.8
-11.1
-24.1
-16.8
-1.0
Rev
387.9
249.1
67.9
171.3
500.6
116.2
63.0
77.3
12.1
113.8
61.3
16.0
877
75.4
25.5
39.5
7.3
13.5
176.3
29.0
110.6
5,093.3
1.9
64.2
193.3
40.8
FY26E
Old
387.9
280.1
67.9
175.7
550.4
122.7
69.5
79.8
13.2
127.4
61.7
16.8
877.2
74.3
26.8
44.3
8.4
13.2
193.4
33.2
108.8
5,546.8
2.1
74.4
223.1
42.7
Chg (%)
0.0
-11.0
0.0
-2.5
-9.0
-5.3
-9.4
-3.2
-8.3
-10.7
-0.7
-4.5
0.0
1.5
-4.9
-10.9
-13.5
2.5
-8.9
-12.6
1.7
-8.2
-9.8
-13.7
-13.3
-4.5
BJAUT
HMCL
TVSL
EIM *
MSIL *
MM
TTMT *
Hyundai*
AL
ESCORTS
ARE&M
EXID
BOSCH
ENDU
CIEINDIA
BHFC
MOTHERSO *
SONACOMS
CEAT
APTY *
BIL
MRF
MSUMI
TIINDIA
CRAFTSMA
HAPPYFORG
* Consolidated; Source: MOFSL, Company
November 2024
20
 Motilal Oswal Financial Services
India Strategy | Review 2QFY25
CAPITAL GOODS: Ordering and execution beat expectations
Ordering above expectations:
Order inflow growth was healthier than expected, despite a seasonally weak
quarter. While domestic ordering has been slow for LT and TRIV, we believe this will see an uptick in 2HFY25,
with government capex poised for a pickup and improvement in private sector ordering from select pockets, as
large sectors such as cement, steel, petrochemicals, etc. are yet to witness a meaningful traction. Sectors such as
power T&D, renewable energy, data centers, real estate, defense, etc. continue to drive momentum.
Execution growth exceeds estimates:
Overall execution of our coverage universe (excluding Siemens) grew by
19% YoY (vs. our estimates of 12%) on the back of healthy opening order books, with both EPC and product
companies clocking 19% growth. Accordingly, LT, KKC, TRIV, and ZEN saw healthy revenue growth, while ABB
was noticeably weaker as its order book mix had a higher share of long-gestation projects.
Margin trajectory stable:
With relatively benign commodity prices, margins remained stable for EPC players,
which are witnessing a sequential improvement, with 2HFY25 poised to see a healthy expansion. Product
companies continue to benefit from a shorter execution cycle, robust demand, tech-led offerings and a healthy
pricing environment. Notable examples include ABB, BHE, KKC, KOEL, TRIV, and TMX, which reported healthy
margin expansion in 2QFY25.
Exports improve sequentially:
While LT, TRIV, and TMX reported a good uptick in international ordering, KKC
saw a 13% YoY decline in export revenue owing to continued weakness in key markets amid high inflation,
geopolitical tensions, etc. However, there was 13% QoQ growth, marking the third straight quarter of sequential
improvement. Going ahead, sustainability of the same would be a key monitorable.
Top picks:
With the recent correction in stock prices, we remain positive on LT, ABB and KKC.
Surprises:
LT, KKC, TRIV, ZEN, TMX, BHE
Misses:
KECI, POWERIND, ABB, KPIL
Guidance highlights:
Most managements remained optimistic about a robust order pipeline, which is expected to materialize from
2HFY25, with a healthy pickup seen in domestic ordering.
LT:
Maintained FY25 revenue and order inflow guidance at 15% and 10% respectively, with core margin guidance
of 8.25%. Remainder of FY25 has an order pipeline of ~INR9t.
BHE:
Retained FY25 revenue growth guidance of 15%, margin guidance of 23-25% and order inflow guidance of
INR250b (excluding QRSAM).
KKC:
Reiterated double-digit revenue growth guidance for FY25 at 2x the GDP growth rate.
KOEL:
Maintained its aim of “2B2B” – to achieve USD2b size in the next five years; margins to be in double digits.
KECI:
Retained FY25 order inflow guidance at ~INR250b, revenue growth of 15%, and margin guidance of 7.5%. It
expects double-digit margin performance in FY26.
KPIL:
Reiterated FY25 guidance of 20% revenue growth, PBT margin at 4.5-5%, NWC below 100 days and capex
at ~INR5b. Order inflow guidance is INR220-230b.
TRIV:
Domestic ordering expected to pick up 2HFY25 onward, while export opportunities continue to be robust.
ZEN:
Guidance maintained for FY25 with revenue/EBITDA margin/PAT margin to be INR9b/35%/25%.
Exhibit 47: Aggregate order book seeing a steady build-up (INR b)
Order book (INR b)
5,154 5,319
5,620
5,821
6,251
6,880
6,562 6,676
7,120
3,891
3,808
4,659
4,346 4,539
4,137 4,101 4,101 4,184
Source: Company, MOFSL
November 2024
21
 Motilal Oswal Financial Services
India Strategy | Review 2QFY25
Exhibit 48: Aggregate revenue growth (%)
Capital goods revenue growth (%)
Exhibit 49: Aggregate EBITDA growth (%)
Capital goods EBITDA growth (%)
Source: Company, MOFSL
Exhibit 50: Aggregate EBITDA margin (%)
Capital goods EBITDA margin (%)
Exhibit 51: Aggregate PAT growth (%)
Capital goods PAT growth (%)
213
46
79
6 2
7 21
-30
26 22 18 38 37 28 24 20 17
-75
Source: Company, MOFSL
CEMENT: Muted volume growth and price drop dent margins
Muted volume growth and weak realization on expected line:
Cement demand in 2QFY25 was hit by intense
monsoons across the country and lower government spending. Aggregate sales volume of our coverage universe
grew ~2% YoY (in line). Conversely, cement realization declined ~8% YoY (down 3% QoQ; in line). ACEM reported
the highest volume growth of ~9% YoY, followed by DALBHARA and UTCEM at ~8% and 4%, respectively. In
contrast, the rest of the players under our coverage universe posted a volume decline in the range of 3-9% YoY.
Muted volume growth and weak realization led to ~6% YoY decline in aggregate revenue (ex-GRASIM; in line).
GRASIM’s standalone revenue rose 18% YoY in 2QFY25, aided by an incremental revenue from its new growth
businesses (Birla Opus and Birla Pivot). GRASIM’s VSF/chemical segment’s revenue was up 6%/3% YoY (in line).
Gross margin for our cement coverage dipped 50bp YoY to ~57%,
as the impact of weak realizations was partly
offset by lower variable costs (average variable cost/t declined 7% YoY). Total opex/t declined 4% YoY (in line).
Aggregate EBITDA for coverage companies declined 29% YoY (including GRASIM, which registered an EBITDA
decline of 45% YoY), and OPM dipped 3.7pp YoY to 12.5% (in line with our estimate).
The EBITDA of JKLC
declined 59% YoY, while that of BCORP/JKCE/SRCM declined 32-39%. The EBITDA of ACC/DALBHARA/TRCL/
UTCEM declined 21%-26% YoY, while EBITDA of ACEM declined 15% YoY. ICEM reported an operating loss of
INR1.6b vs. EBITDA of INR81m in 2QFY24.
Avg. EBITDA/t declined 29% YoY to INR657 (vs. estimated INR674).
PAT declines 47% YoY (ex-Grasim, PAT down ~58%):
Aggregate interest/depreciation expenses for our coverage
universe grew 15%/26% YoY, and other income increased 30% YoY.
Aggregate profit declined 58% YoY to
INR12.7b for cement companies (profit down 47% YoY to INR20.3b, including GRASIM, as it reported PAT
decline of 5% YoY to INR7.6b in 2QFY25, aided by higher other income).
Profits declined 75%-81% YoY for JKCE/
SRCM/TRCL, 54% for DALBHARA and 33%-39% for ACC/ACEM/UTCEM. BCROP/JKLC/ICEM reported net losses
during the quarter.
November 2024
22
 Motilal Oswal Financial Services
India Strategy | Review 2QFY25
Several earnings downgrades due to lower volume guidance and pricing pressure:
We cut our aggregate
EBITDA estimates by ~7% for FY25, but there were no rating downgrades. For FY25, we cut our EBITDA estimates
by ~15% for JKLC, ~12% for GRASIM, 8%-9% for ACC/BCORP/JKCE/UTCEM and ~5% for SRCM and DALBHARA
(each). In contrast, we broadly maintained our FY25 EBITDA estimates for ACEM and TRCL.
Top picks:
We remain positive on UTCEM, ACEM, and JKCE within our coverage universe.
Surprises:
ACEM and TRCL
Misses:
UTCEM, JKCE, JKLC, and ICEM
Guidance highlights:
Most of the management teams guided an industry demand growth of ~6-7% YoY in FY25E, with demand growth of
~8-9% YoY in 2HFY25. Pent-up demand, pick-up in construction activities, and infrastructure projects post-festive
period should lead to demand recovery going forward. Cement prices are marginally up and steady (until Oct’24) as
compared to 2QFY25 average. Consolidation is intensifying in the industry and this should benefit in the longer term.
UTCEM:
Guided a double-digit volume growth in 2HFY25 and anticipates outperforming the industry’s volume
growth. Its high-cost fuel contracts are nearing the end and will have a slight impact in 3QFY25. It commissioned
9mtpa grinding capacity in 1HFY25 and will commission another ~8mtpa in 2HFY25.
ACEM:
Estimate cement demand to grow ~4-5% in FY25 (implies ~7-8% growth in 2HFY25). It will commission
4.0mtpa clinker and 6.4mtpa grinding capacity in 2HFY25. Further, it aims to increase its market share from
~15% currently to ~20% by FY28E.
SRCM:
Guided volume growth to be in line with the industry in 2HFY25. It is following a strategy of value over
volume and focusing on increasing premium cement share, which helps it to restrict the drop in realization. It
reiterated its capacity target of +80mtpa by FY28 vs. 56.4mtpa currently.
DALBHARA:
It estimates demand growth at ~6% YoY in FY25 (vs. previous estimate of ~8%). Further, better
demand is likely to lead to price improvements; though competitive intensity needs to be monitored. Reiterated
the company’s volume at 1.5x of the industry growth.
JKCE:
It trimmed its gray cement volume guidance to ~6-7% YoY (vs. earlier estimate of ~10%). The capacity
expansion plan of 6mtpa is on track and expected to be commissioned in 2HFY26. Further, the company aims to
realize cost savings of up to INR60/t in FY25E out of its cost-saving target of INR150-200/t in the next two years.
JKLC:
Expects industry volume growth at ~4-5% in FY25 and believes the company’s growth will align with the
industry in 2HFY25. It maintained its market share in its core markets. Its capacity expansion plans remain intact,
but the expected timelines of commissioning have been extended by six months.
BCORP:
It is cautiously optimistic about demand recovery in the near term and expects it to be delayed until
end-Nov’24. It aims to scale up the capacity utilization at its central India plant to ~100% and Mukutban plant to
~60%. Management estimates an EBITDA/t improvement of up to INR150-170/t in 2HFY25.
Exhibit 52: Sales volume grew ~2% YoY in 2QFY25
Aggregate Vol (mt)
45
6
9
20
4
(3) 2
YoY change (%)
6
2
2
Exhibit 53: Blended realization was down 8% YoY in 2QFY25
Realization (INR/ton)
8
4
YoY Change (%)
10
4
5
4
-2
1
2
-6
-3
-8
16 13
15 9 10
10
7 11 4
6
3
56 66 72 61 59 64 74 69 64 70 82 80 73 75 91 83 74
0
Source: Company, MOFSL
November 2024
23
 Motilal Oswal Financial Services
India Strategy | Review 2QFY25
Exhibit 54: Aggregate EBITDA declined 27% YoY in 2QFY25
Aggregate EBITDA (INR b)
51
37 43 43
-6
-26 -20
-18
-46
-6
-1
10
YoY Change (%)
59
78
30
-5
-27
Exhibit 55: Average EBITDA/t was down 29% YoY in 2QFY25
Average EBITDA (INR/t)
Source: Company, MOFSL; Note: *EBITDA excluding Grasim
Source: Company, MOFSL
CHEMICALS: Margins still under pressure; 2HFY25 could be better than 1HFY25
Overall performance:
Revenue was in line with our estimates (FINEORG beats our estimates, while NOCIL
missed our estimates). EBITDA was in line with our estimates too (DN, FINEORG, NFIL beat our estimates, while
CLEAN, GALSURF, NOCIL, SRF missed our estimates). Adj. PAT was in line with our expectation (CLEAN, GALSURF,
SRF, TTCH missed our estimates, while the rest were above our estimates). Aggregate revenue was up 8% YoY at
INR168.2b, EBITDA was flat YoY at INR30.6b, and adj. PAT declined 4% YoY to INR17.6b.
Aggregate gross margin for our coverage universe declined 40bp YoY in 2QFY25 (vs. 200bp fall YoY in 1QFY25).
CLEAN, DN, FINEORG, and SRF saw gross margin decline YoY. Aggregate EBITDA margin dipped 160bp YoY. AACL,
ATLP, FINEORG, PI, and VO posted YoY expansion in EBITDAM, while there was a YoY contraction for the rest of
the companies in our coverage universe.
Ratings and earnings revisions:
There was no rating change for our coverage universe after 2QFY25 earnings.
However, we have lowered our estimates for AACL, DN, NOCIL, PI, SRF, VO. There were no upgrade in estimates.
Top picks:
ATLP –
Improving demand, capacity expansions, project ramp-ups, and efficiency initiatives should
drive growth in 2HFY25, with a ramp-up in key projects, including a 50ktpa epoxy plant, and Anaven's utilization.
PI –
Medium- to long-term growth will be driven by CSM momentum, product launches in FY25, and pharma
segment ramp-up, despite near-term global challenges.
VO –
Growth is supported by new capacities in FY25, AO
ramp-up (INR1.3b revenue in FY24), and VAPL amalgamation, despite Chinese competition.
Surprises:
DN, FINEORG, NFIL
Misses:
CLEAN, GALSURF, NOCIL, SRF
Guidance highlights:
AACL:
The company expects 10% volume growth in FY25. ADD on ACN could be imposed in 4-5 months. MIPA
challenges persist due to Chinese imports. 2HFY25 will focus on volumes with margin improvement, while
Ethylamines offers significant growth potential.
CLEAN:
The business environment remains encouraging, given the launch of a pharma intermediate product in
3QFY25, the commissioning of a performance chemicals product by Jul'25, the commercialization of a water
treatment product by Dec'25, and a focus on volume growth in 3QFY25.
DN:
DN: 3Q performance would be mixed, but 4QFY25 should be strong in the existing business. Newer projects
ramp up is expected by 2HFY26, potentially adding 2-4% EBITDAM in the standalone business. Key projects
include nitric acid commissioning in 2HFY25, Photochlorination by 4QFY25, MIBK/MIBC and Acetophenone by
1QFY26, and an R&D center by 2HFY25, with a capex plan of INR70b by FY27 and a focus on India's growing PC
demand.
FINEORG:
Higher input costs in 2Q, including increased vegetable oil prices and freight, impacted efficiency, but
demand remained stable, with all plants operating at optimal capacity, except Patalganga-II, which has room for
ramp-up.
GALSURF:
Supply challenges persist in AMET, with 4-5% volume growth guidance for 2HFY25 (up from mid-
Oct'24). RoW saw mid-20% volume growth in 1HFY25 and should sustain momentum in 2HFY25, with mid-teens
volume growth guidance for FY25. There is no risk to EBITDA/kg guidance unless geopolitical issues escalate.
November 2024
24
 Motilal Oswal Financial Services
India Strategy | Review 2QFY25
NFIL:
R32 capacity expansion (INR840m) will be commissioned by Feb'25, AHF project (INR4.5b) by FY25/FY26,
and two new molecules in 3QFY25; Surat project (INR300m) to start commercial supply in Nov'24. Spec Chem
revenue in 2HFY25 is expected to grow, with cGMP4 Phase I (INR1.6b) on track for 3QFY26 and a strong 2HFY25
order book.
PI:
The company revised its FY25 revenue growth guidance to high single digits, expecting strong domestic
branded growth and high single-digit export growth in 2HFY25, while near-term demand is impacted by
inventory issues and pricing pressures. Pharma revenue is targeted at INR2.5-2.7b, with volume growth
expected in 2H, and capex for FY25 is projected at INR1-1.25b, with a reduction in the following year.
SRF:
The company expects margin recovery by 4Q, supported by strong volumes in domestic and Middle Eastern
markets, despite pressure in HFC and Chloromethane pricing. Chemicals business recovery is expected in
2HFY25, with stronger volumes and accelerated offtake in 3Q, peaking in 4Q.
TTCH:
TTCH expects steady operations in 2HFY25 after a volatile 1HFY25, with a strong demand outlook in India
and the US. It plans debt repayments in FY26/FY27. The company is adding 400ktpa of soda ash capacity, with
clearances expected by Mar'25, and aims to complete the plant within 30-36 months.
Aggregate Revenue (INR b)
Exhibit 56: Revenue for our coverage universe
Exhibit 57: Gross margin for our coverage universe
Aggregate Gross margin (%)
Exhibit 58: EBITDAM for our coverage universe
Aggregate EBITDAM (%)
November 2024
25
 Motilal Oswal Financial Services
India Strategy | Review 2QFY25
Exhibit 59: EBIT margin for our coverage universe
Aggregate EBIT margin (%)
Exhibit 60: PAT margin for our coverage universe
Aggregate adj. PAT margin (%)
CONSUMER - FMCG: Urban slowdown a disappointment; expect better print in 2HFY25
Demand challenges in 2Q; expect revenue trend to improve in 2HFY25:
Our coverage universe reported a 6.5%
YoY revenue growth (vs. est. 5.5%). Excluding ITC, our consumer sector grew at a modest rate of 3.6% YoY (est
5.5%). The demand environment was challenging due to adverse weather conditions, including floods and heavy
rains in certain areas, coupled with persistent inflation that impacted urban demand. Volume growth across
most companies was discouraging after seeing a slight pickup in 1QFY25 (see Exhibit 1). Many companies
witnessed rural markets outpacing urban markets, a trend also reflected in Nielsen data, which shows rural
growth at 6.7% compared to 5% in urban areas. Commodity prices have shown a YoY inflation, prompting
several companies to consider potential price hikes going forward. The volume trend is expected to see stability
with a gradual upward trend. Companies are also implementing price hikes, thereby, the price cut led pressure
on revenue growth is behind. The rapid growth of e-commerce and quick commerce channels is putting pressure
on General Trade (GT) growth across the industry. It will be interesting to see how companies use this trend in
their favor. In our coverage universe, six companies reported double-digit revenue growth, while four saw
revenue contraction. Revenue growth was largely in line with our estimates for 15 out of 19 companies under
our coverage. Asian Paints, Jyothy Labs, and PG missed our revenue estimates, while ITC exceeded expectations.
Gross margin weak; A&P spend control helps EBITDA margin:
Gross margins for most companies were weak
due to rising inflation, while some companies saw margin expansion (see Exhibit 3). A few companies controlled
their A&P spending to reduce the pressure of gross margin and operating deleverage. However, most companies
saw weakness in EBITDA growth. A price hike is anticipated in 2HFY25 to offset the rising raw material prices.
Our coverage universe reported a modest 1% YoY (est. 3%) EBITDA growth in 2QFY25. Excluding ITC, EBITDA
decline marginally by 0.4%, (est. 2.9%) in 2QFY25.
PBT and PAT below expectations:
For 12 of the 19 coverage companies, PBT was either ahead of or in line with
our estimates, with a better-than-expected performance by PAGE and UBBL. Conversely, there were notable
misses by APNT, BRIT, CLGT, JYL, NESTLE, PG, and TATACONSUMER. Aggregate PBT declined 1% YoY (est. +3%).
Aggregate PAT was flat YoY (est. +4%).
Outperformer (2Q):
PAGE, UBBL, MRCO
Underperformer (2Q):
APNT, CLGT, BRIT, NESTLE, DABUR, and TATACONSUMER
Near-term outlook:
Rural demand has consistently been seeing an improving trend, with factors such as
favorable monsoons, we expect rural demand to maintain an upward trend. Weakness in urban demand and
higher inventory in GT impacted urban revenue in 2Q. We remain watchful on whether this is a temporary trend
or a shift that could impact the trajectory over the long term. Companies are leaning on traditional strategies of
enhancing distribution, launching new products, and offering consumer incentives to regain momentum.
Additionally, price hikes are anticipated in 2HFY25 to counter the recent raw material inflation. Gross margin is
likely to witness gradual recovery and a more meaningful improvement in 4Q. Urban pickup, pricing activities,
channel strategy, and RM prices are the key monitorables.
Top picks – HUVR, GCPL and DABUR:
HUVR fits among the best play for consumption recovery, particularly as
demand is expected to improve for low-mid income HHs. HUVR with its wide product basket (presence across
price points), can leverage the opportunity. Rural is still more GT driven market, where competitive pressure is
limited and known (unlike D2C, quick commerce etc in urban), which HUVR can navigate well to drive it's volume
growth. Price cuts impacting value growth was behind in 1HFY25. Volume with price hikes both can drive
November 2024
26
 Motilal Oswal Financial Services
India Strategy | Review 2QFY25
revenue growth from 2HFY25 onwards.
GCPL
is consistently working to expand the total addressable market for
its Indian business through product innovations to drive frequency. Besides, there has been a consistent effort
to address the gaps in profitability and growth in its international business. We see margin headroom from the
RCCL and Indonesia businesses. The valuation is expensive, but earnings are expected to outperform peers.
DABUR:
Recovery in rural markets should support its portfolio as it is heavily skewed toward rural areas. In the
domestic business, we expect healthcare, oral care, and food businesses to grow faster than others. The
distribution drive will further contribute to rural growth. EBITDA margin has remained in the range of 19-20% for
the past several years. The margin is expected to improve in the coming years due to a better mix of products
(such as higher healthcare offerings) and increased pricing in high market-share brands.
Guidance highlights:
Consumption trends remain weak, with CPI inflation rising and demand slowing down in urban
markets. Many companies are planning price hikes across categories to support margin expansion.
APNT:
The management expects EBITDA margin to remain at ~18.5% for FY25. The company implemented a
1.2% price hike in
the
quarter, but full realization is expected in Q3. The company has experienced intense
competitive activity with higher discounting levels.
BRIT:
The company has plans to implement a price hike of 4-5% over the next two quarters, targeting specific
SKUs where prices have not been adjusted recently. Price hikes are expected to expand margins. Rural growth
was at a high single-digit and is growing 2x more than urban growth. Metro areas contribute ~30% to the total
FMCG business.
DABUR:
The management expects mid to high single-digit revenue growth and flattish margin expansion in
2HFY25. Distributor ROI has been improved with a reduction in inventory days from 30 days to 21 days after
inventory correction. The company plans to bring it to 19 days by Dec’24.
HMN:
The company aims to achieve high single-digit revenue growth and double-digit EBITDA growth in FY25.
With a favorable winter forecast, the company expects strong performance from its winter portfolio in 3Q. It
continues to invest in brand-building efforts. Although brand investment declined in 2Q, it increased by 8% in
1HFY25 and is expected to grow further in 2HFY25.
HUVR:
The company will focus on volume-led growth to drive competition and maintain EBITDA margin at the
current level. It will announce a price hike in a low single digit if commodity prices remain at the current level.
The effective tax rate is marginally above 26% for FY25.
GCPL:
The company expects to maintain a volume growth of 6%-8% and significant price growth in the second
half, potentially bordering on double digits. It expects 3-4% annual pricing growth in the household insecticide
segment in a steady state. RCCL's EBITDA target set by the company is between INR 1.4b and INR 1.5b but is
expected to fall slightly short of this target. The effective tax rate is projected to increase by 100bp to 30% this
year but is anticipated to decrease next year with the new tax regime.
MRCO:
The
company expects consolidated revenue growth in double digits in 2HFY25. It will implement further
price hikes to manage input cost pressures in 2HFY25. The company remains focused on driving volume and
revenue growth but may experience an EBITDA margin contraction of up to 40-50 bp in FY25 due to rising raw
material prices.
PIDI:
The management has upheld its guidance for double-digit underlying volume growth for FY25. The
company deferred advertising and promotional spending to 2HFY25. Consequently, margins are expected to
moderate in 2HFY25. EBITDA margin is expected to be 20-24% in the medium term. It targets growth at 1-2x
GDP in its core categories and 2-4x GDP in its high-growth categories.
UBBL:
Premium volume remained strong, with a 27% surge, particularly driven by Kingfisher Ultra, Ultramax, and
Heineken. The company reported minimal impact from slower urban demand during the quarter. It is fast-
tracking plans to set up local production in West Bengal to boost its premium segment. Moreover, it is
prioritizing its efforts to strengthen the portfolio over the next 1-2 years with incremental margin expansions.
VBL:
The company expects to deliver healthy double-digit volume growth in CY24. It is adding ~300-400k outlets
every year. Out of total ~12m outlets, the company has currently reached just 4m outlets. It is launching Nimbu
masala soda and expects to launch a Jeera-related beverage by early next year. The VBL rPET plant is progressing
as per schedule and will be operational by next year.
November 2024
27
 Motilal Oswal Financial Services
India Strategy | Review 2QFY25
Exhibit 61: Quarterly volume growth
Volume growth (%)
Asian Paints
Britannia
Colgate
Dabur
Emami
Godrej Consumer
HUL
ITC
Marico
Nestle
Page Industries
UBBL
United spirits
1QFY23
37.0
-2.0
-2.5
5.0
9.6
-6.0
6.0
26.0
-5.0
7.0
150.0
121.0
17.9
2QFY23
10.0
5.0
-2.5
1.0
-1.0
-5.0
4.0
20.0
3.0
8.8
1.0
23.0
8.3
3QFY23
0.0
3.0
-4.5
-3.0
-3.9
3.0
5.0
15.0
4.0
-2.3
-11.0
4.0
-25.0
4QFY23
16.0
3.0
0.5
1.0
2.0
13.0
4.0
11.5
5.0
5.1
-15.0
3.1
-27.3
1QFY24
10.0
0.0
3.0
3.0
3.0
10.0
3.0
8.0
3.0
5.4
-11.5
-12.4
5.8
2QFY24
6.0
0.0
-1.0
3.0
2.0
4.0
2.0
5.0
3.0
5.4
-8.8
7.0
1.0
3QFY24
12.0
5.5
-1.0
4.0
-1.0
5.0
2.0
-1.0
2.0
4.0
4.6
8.0
-1.8
4QFY24
10.0
6.0
1.0
3.0
6.4
9.0
2.0
2.0
3.0
4.0
6.1
10.9
3.7
1QFY25
7.0
8.0
7.0
5.2
8.7
8.0
4.0
3.0
4.0
4.0
2.6
5.0
3.5
2QFY25
-0.5
8.0
8.0
-7.0
1.7
7.0
3.0
3.5
3.0
5.0
6.7
5.0
-4.4
Exhibit 62: Revenue/EBITDA/PAT growth for 2QFY25
Company Name
Asian Paints
Britannia
Colgate
Dabur
Emami
Godrej Consumer
HUL
Indigo Paints
ITC
Jyothy
Marico
Nestle
P&G Hygiene
Page Industries
Pidilite
Tata consumer
United Breweries
United Spirits
Varun Beverages
Revenue
80,275
46,676
16,191
30,286
8,906
36,663
1,59,260
2,995
2,07,359
7,338
26,640
51,040
11,352
12,463
32,349
42,145
21,147
28,430
48,047
2QFY25
YoY %
-5.0
5.0
10.0
-5.0
3.0
2.0
2.0
7.0
17.0
0.0
8.0
1.0
0.0
11.0
5.0
13.0
12.0
-1.0
24.0
EBITDA
12,395
7,834
4,974
5,526
2,505
7,617
37,930
415
67,618
1,385
5,220
11,888
2,905
2,815
7,688
6,263
2,268
5,070
11,511
2QFY25
YoY %
-28.0
-10.0
3.0
-16.0
7.0
5.0
0.0
-1.0
5.0
2.0
5.0
-5.0
2.0
21.0
13.0
17.0
23.0
8.0
30.0
PAT
8,738
5,317
3,555
4,333
2,333
4,953
26,027
226
49,937
1050
4,132
7,503
2,119
1,953
5,415
3,848
1322
3,350
6,196
2QFY25
YoY %
-29.0
-9.0
5.0
-17.0
19.0
12.0
-2.0
-11.0
2.0
1.0
17.0
-7.0
1.0
30.0
18.0
10.0
23.0
5.0
24.0
Exhibit 63: Gross and EBITDA margin expansion in 2QFY25
Companies
Asian Paints
Britannia
Colgate
Dabur
Emami
Godrej Consumer
HUL
Indigo Paints
ITC
Jyothy
Marico
Nestle
P&G Hygiene
Page Industries
Pidilite
Tata consumer
United Breweries
United Spirits
Varun Beverages
Gross Margin (%)
40.8
41.5
68.5
49.3
70.7
55.6
51.6
43.7
55.9
50.2
50.8
56.6
62.9
56.5
54.4
43.6
43.8
45.2
55.5
YoY (bp)
-259
-136
-23
102
61
70
-139
-186
-433
98
30
14
199
83
304
110
-69
178
22
QoQ (bp)
-176
-188
-210
155
303
-26
-37
-290
-463
-110
-146
-102
371
234
55
-131
81
73
84
EBITDA Margin (%)
15.4
16.8
30.7
18.2
28.1
20.8
23.8
13.9
32.6
18.9
19.6
23.3
25.6
22.6
23.8
14.9
10.7
17.8
24.0
YoY (bp)
QoQ (bp)
-480
-344
-290
-95
-206
-325
-238
-131
111
423
69
-102
-49
-2
-124
-137
-370
-395
38
88
-48
-409
-146
1
56
1150
183
354
167
-17
48
-47
95
-79
142
-164
117
-371
Source: Company, MOFSL
November 2024
28
 Motilal Oswal Financial Services
India Strategy | Review 2QFY25
Exhibit 64: Sales grew 6.5% YoY for our consumer universe
Consumer aggregate YoY sales growth (%)
32.5
Exhibit 65: Aggregate EBITDA margin contracted in 2Q to
23.4%
Consumer aggregate EBITDA margins (%)
25.1
24.5 24.7 24.3
24.8
23.4
18.1
15.9
13.0
17.2
7.0
9.8
6.5
3.6 4.4
3.8 3.8
6.2
23.3 23.0
23.6 23.8
22.9
22.4 22.5
Source: Company, MOFSL
Exhibit 66: Aggregate adjusted PAT flat YoY in 2QFY25
Consumer aggregate YoY PAT growth (%)
34.8
14.5
19.2
17.5
14.3
7.8
3.4
-0.2
9.8
6.2
11.0
12.0
11.1
Source: Company, MOFSL
CONSUMER - QSR: Weakness persists; pressure on profitability
Sluggish demand trajectory:
QSR companies have sustained their sluggish performance as growth metrics (SSSG,
ADS) remained weak during the quarter due to competition from local players and weak dine-in demand. The
delivery business has sustained outperformance over the dine-in business. Companies have initiated several
offers for consumers and waived off delivery charges to drive demand. The value segment is seeing better traffic
growth compared to other segments. Sales were weak in Jul’24 due to the Shravan period and heavy rains
across regions. While some improvements were noted in Aug’24, sales tapered off again in Sep’24 due to the
Shraad period. Weak growth was observed across markets (metros/tier2/ tier3). Our coverage universe posted
revenue growth of 7% YoY (organic growth) in 2QFY25 vs. 6% in 1QFY25 and 9% in 2QFY24. SSSG/ADS continued
to decline, barring Jubilant which reported LFL growth of 3%. Westlife/Devyani KFC/Devyani PH/Sapphire
KFC/Sapphire/RBA registered same-store sales decline of 7%/7%/6%/8%/3%/3%.
Acceleration in store addition:
The store addition momentum improved during the quarter. The management
has maintained its store addition guidance for FY25.
Pressure on profitability:
Given the weak underlying growth, companies witnessed a significant impact on their
unit economics. Both restaurant margin and EBITDA margin contracted for all brands in 2Q. PBT also declined for
all companies.
Outperformer (2Q):
Jubilant Foodworks
Underperformer (2Q):
Sapphire, Devyani, Westlife and RBA
Near-term outlook:
We expect QSR companies to sustain growth weakness in the near term, which will likely
keep operating margins under pressure. Following a sharp contraction in margins, any further contractions will
be closely monitored. We are watchful for any recovery signs (particularly for dine-in) in 2HFY25 and the pace of
store addition in FY25.
November 2024
29
 Motilal Oswal Financial Services
India Strategy | Review 2QFY25
Guidance highlights:
JUBI:
The company expects growth momentum to accelerate in 3Q compared to 2Q. It has not increased prices
in the last nine quarters and has no plan to implement price hikes. It focuses on giving more value to gain more
share. The 20-minute delivery initiative and free delivery options have driven delivery growth, although
takeaway demand has decelerated.
Devyani:
The company’s focus will be on the value-driven portfolio to fuel growth. It is on track to reach the
2,000 store network by FY25. KFC added 49 stores in 1HFY25 and is on track to meet its FY25 target of adding
100-110 stores. PH has added 23 stores in 1HFY25 and plans to open 60-70 stores in FY25.
Westlife:
The company has guided 15-18% operating margin (pre-Ind-AS) and 18-20% operating margin (Post-
Ind-AS) in the medium term. It targets to open 45-50 stores in FY25 with a focus on South India, smaller towns,
and drive-thru. It aims to reach 580-630 restaurants by FY27. The company aims for 15-18% contribution of
McCafé to the total business by FY27.
Sapphire:
The company is focused on expanding its value portfolio, driving product innovation, and optimizing
costs to navigate current challenges. It will take pricing as part of its campaign in the Festive quarter, specifically
in the North and East regions. It plans to open 45-50 new stores in FY25, with a target of expanding its network
to 580-630 restaurants by 2027.
RBA:
RBA aims to expand its footprint in India, with a goal of reaching 510 restaurants by the end of FY25. The
company has set a target to achieve a gross profit margin of ~69% by FY27. This improvement is expected to be
driven by initiatives such as optimized sourcing, menu mix adjustments, and pricing strategies. RBA’s immediate
focus on Indonesia is to reach cash breakeven at a country level.
Barbeque:
The company plans to open 25 stores in FY25 and reach 240 stores. Expansion plans include adding
three international stores in 2HFY25—two in the Middle East and one in Sri Lanka. Management guided ~68%
GP margins for FY25.
Exhibit 67: Quarterly trends
Particulars
Revenue Growth (%)
Barbeque Nation
Devyani
-KFC
-Pizza Hut
Jubilant
Sapphire
-KFC
-Pizza Hut
Restaurant Brands (Consol)
Westlife
Total
SSSG (%)
Barbeque Nation
Devyani - KFC
Devyani - PH
Jubilant (LFL)
Sapphire - KFC
Sapphire - PH
Restaurant Brands
Westlife
Gross profit margin (%)
Barbeque Nation
Devyani
-KFC
-Pizza Hut
Jubilant
Sapphire
-KFC
-Pizza Hut
1QFY23
209.0
100.0
109.0
71.0
41.0
80.0
98.0
85.0
64.0
108.0
75.0
182.0
64.0
32.0
28.0
65.0
47.0
66.0
97.0
66.8
71.1
69.0
76.2
76.7
67.9
67.3
75.3
2QFY23
41.0
45.0
47.0
36.0
17.0
36.0
36.0
60.0
47.0
49.0
34.0
23.0
13.0
3.0
8.0
15.0
23.0
27.0
40.0
66.1
70.2
67.9
74.5
76.2
66.4
65.6
74.7
3QFY23
14.0
27.0
27.0
18.0
10.0
17.0
26.0
20.0
21.0
28.0
18.0
-1.0
3.0
-6.0
0.0
3.0
-4.0
9.0
20.0
66.7
69.3
67.6
73.6
75.5
67.1
66.5
74.4
4QFY23
12.0
28.0
26.0
16.0
8.0
13.0
24.0
18.0
29.0
22.0
17.0
-3.0
2.0
-3.0
-1.0
2.0
-4.0
8.0
14.0
65.8
69.6
68.6
73.2
75.3
67.9
66.8
74.3
1QFY24
3.0
20.0
22.0
11.0
6.0
20.0
21.0
12.0
25.0
14.0
14.0
-8.0
-1.0
-5.0
-1.0
0.0
-9.0
4.0
7.0
64.0
70.8
69.7
74.9
76.0
68.5
68.1
75.1
2QFY24
-3.0
10.0
15.0
2.0
5.0
14.0
19.0
-6.0
19.0
7.0
9.0
-11.0
-4.0
-10.0
-1.0
0.0
-20.0
4.0
1.0
65.9
70.8
69.0
75.7
76.4
68.7
67.9
76.1
3QFY24
1.0
7.0
14.0
-2.0
3.0
12.0
16.0
-4.0
15.0
-2.0
6.0
-5.0
-5.0
-13.0
-3.0
-2.0
-19.0
3.0
-9.0
67.9
70.6
69.4
75.8
76.7
68.9
68.4
75.7
4QFY24
6.0
39.0
11.0
-4.0
6.0
13.0
16.0
-3.0
16.0
1.0
14.0
1.0
-7.0
-14.0
0.0
-3.0
-15.0
2.0
-5.0
68.9
69.2
69.9
77.3
76.6
68.9
68.3
75.5
1QFY25
-6.0
5.0
7.0
-1.0
10.0
10.0
11.0
3.0
6.0
0.0
6.0
-7.0
-7.0
-9.0
3.0
-6.0
-7.0
3.0
-7.0
68.1
69.2
69.5
76.8
76.1
68.6
68.2
76.1
2QFY25
1.0
14.0
7.0
0.0
9.0
8.0
9.0
3.0
1.0
1.0
7.0
-3.0
-7.0
-6.0
3.0
-8.0
-3.0
-3.0
-7.0
68.1
69.3
69.0
76.7
76.1
68.8
68.3
76.5
November 2024
30
 Motilal Oswal Financial Services
India Strategy | Review 2QFY25
Particulars
Restaurant Brands (Consol)
Westlife
EBITDA Pre-Ind AS margins (%)
Barbeque Nation
Devyani
Jubilant
Sapphire
Restaurant Brands (Consol)
Westlife
ADS (‘000’)
Barbeque Nation
Devyani
-KFC
-Pizza Hut
Jubilant
Sapphire
-KFC
-Pizza Hut
Restaurant Brands
Westlife
Store (India)
Barbeque Nation
Devyani
-KFC
-Pizza Hut
Jubilant
Sapphire
-KFC
-Pizza Hut
Restaurant Brands
Westlife
PBT (INR M)
Barbeque Nation
Devyani
Jubilant
Sapphire
Restaurant Brands (Consol)
Westlife
PBT Margins (%)
Barbeque Nation
Devyani
Jubilant
Sapphire
Restaurant Brands (Consol)
Westlife
1QFY23
64.3
68.0
13.7
16.1
18.9
13.2
-2.2
13.0
179
127
44
85
144
61
115
181
195
961
391
436
1,676
516
281
235
328
331
208
771
1,642
356
(509)
318
6.6
10.9
13.2
6.5
-10.4
5.9
2QFY23
64.6
69.3
10.0
15.1
18.7
11.1
-2.9
13.4
168
121
45
84
134
64
121
189
205
1,047
423
466
1,753
550
301
249
334
337
69
700
1,619
269
(551)
420
2.2
9.4
12.6
4.8
-10.5
7.4
3QFY23
63.6
70.2
10.3
14.8
15.7
12.4
-2.4
14.3
172
116
43
84
136
58
113
199
212
1,120
461
483
1,814
599
325
274
379
341
67
736
1,194
336
(559)
480
2.0
9.3
9.1
5.6
-10.6
7.9
4QFY23
64.1
71.9
3.8
12.1
13.4
10.0
-3.8
12.0
144
106
39
78
127
50
108
173
216
1,184
490
506
1,863
627
341
286
391
357
(125)
412
930
123
(800)
277
-4.5
5.5
7.4
2.2
-15.6
5.1
1QFY24
64.0
70.6
5.5
13.2
15.4
11.8
-0.4
12.9
170
117
40
79
138
52
120
189
212
1,230
510
521
1,891
660
358
302
396
361
(55)
603
1,014
336
(541)
406
-1.7
7.1
7.7
5.1
-8.8
6.6
2QFY24
64.2
70.1
4.5
11.5
15.3
10.6
1.5
11.9
158
109
39
78
125
48
126
185
212
1,298
540
535
1,949
692
381
311
404
370
(151)
330
963
214
(507)
302
-5.0
4.0
7.2
3.3
-8.1
4.9
3QFY24
64.4
70.3
11.0
9.3
14.5
10.8
2.8
11.4
175
104
37
78
125
45
119
176
210
1,387
590
565
2,007
725
406
319
441
380
75
97
819
140
(399)
231
2.3
1.1
6.0
2.1
-6.6
3.9
4QFY24
64.2
70.2
8.0
9.2
12.4
8.6
-0.5
8.7
153
93
32
75
114
41
105
157
217
1,429
596
567
2,096
748
429
319
455
397
(9)
44
508
8
(921)
20
-0.3
0.4
3.8
0.1
-15.4
0.4
1QFY25
64.5
70.6
6.9
11.6
13.7
9.8
1.3
8.1
155
104
36
79
122
48
119
170
219
1,473
617
570
2,148
762
442
320
456
403
(55)
381
683
118
(522)
45
-1.8
3.1
4.7
1.6
-8.1
0.7
2QFY25
64.9
69.7
5.4
9.4
13.8
8.5
0.6
7.7
153
96
35
78
111
47
118
168
222
1,524
645
593
2,199
784
461
323
464
408
(100)
(9)
698
53
(655)
7
-3.3
-0.1
4.8
0.8
-10.3
0.1
CONSUMER DURABLES: Strong revenue growth; RM cost volatility hurts margins
Revenue growth higher than our estimates:
Revenue for our consumer durables coverage universe increased 20%
YoY in 2QFY25 (6% above our estimates). As expected, demand for cables and wires (C&W) has improved, led by
stable domestic demand from renewable energy, transmission sector, data centers, etc. Hence, C&W segment
aggregate revenue grew ~21% YoY/15% QoQ (6% above our estimates) in 2QFY25. Secondly, aggregate revenue
of UCP segment (coverage companies) grew 28% YoY in 2QFY25 despite being a seasonally lean period for RAC
(16% above our estimates). Other categories like refrigerators, washing machines and water heaters also posted
better growth during the quarter, led by inventory stocking prior to the festive seasons. Revenue growth for
Polycab/KEII/HAVL/VOLT/RRKABEL stood at 30%/17%/16%/14%/12% YoY. Demand in C&W segment is expected
to improve in 2HFY25, led by a pick-up in government spending, infrastructure projects, real-estate and higher
exports. A recovery in rural demand and festivals should also drive growth in the ECD segment.
November 2024
31
 Motilal Oswal Financial Services
India Strategy | Review 2QFY25
Steep volatility in RM prices hurts margins:
Higher copper/aluminum prices (up ~19%/13% YoY in 2Q) and lower
exports of C&W led to a margin contraction. Gross margin for our coverage companies dipped 1.4pp YoY to 26%
(1.7pp below estimate). Aggregate EBITDA for our coverage universe grew merely 7% YoY (~13% below our
estimates) and EBITDA margin contracted 2pp YoY to ~9% (est. ~11%). VOLT’s EBITDA grew ~131% YoY, aided by
a low base (profit in EMPS segment vs. a loss last year). EBITDA of KEII/Polycab grew ~8%/4% YoY, while it was
flat for HAVL and declined ~29% YoY for RRKABEL. C&W companies expect margin recovery in 2HFY25, backed
by strong growth momentum and favorable RM prices (average copper prices down ~2% QoQ so far in 3Q).
Several EPS downgrades due to margin pressure:
C&W companies saw margin pressure due to higher volatility in
RM prices. Hence, we cut our FY25E/FY26E/FY27E EPS by 26%/13%/8% for RRKABEL, 4-8% for HAVL, and 3-6%
for KEII and 3-4% for Polycab. We maintained our EPS estimates for VOLT.
Top picks:
We remain positive on VOLT and Polycab
Surprises:
VOLT
Misses:
RRKABEL, HAVL, and KEII
Polycab:
Demand momentum to remain strong in the C&W segment and 2H should be better than 1HFY25.
FMEG business is likely to pick up in FY26 on account of robust demand from the real estate sector. It has
participated in the phase III tenders of the BharatNet project, and applied for all 16 packages in different states.
KEII:
Demand remains strong from solar renewable energy and transmission sectors. Thermal power projects,
pump storage projects, data centers, and highway tunneling projects are also driving demand. Volatility impact
of RM costs will average out on a six-month basis, and KEII maintained its OPM guidance of 10.5-11.0% for FY25
(vs. ~10% in 1HFY25). Capex in FY25/FY26 will be INR11b+/INR6-7b. KEII intends to remain a debt-free company
and has obtained board approvals for a fundraise of up to INR20b via QIP.
RRKABEL:
It guided
for
volume growth of ~15% in 2HFY25 in C&W, led by 25% growth from cables and ~10%
from wires. Further, it expects the margin to recover to the range of 8%-8.5% in 2HFY25. It is doubling its power
cable capacity and increasing its wire capacity by ~20-25%, which is expected to be completed by FY25-end.
FMEG business is estimated to achieve break-even by early-FY26.
HAVL:
It has been cautiously optimistic on festive demand improvement and believes that rural demand has also
improved. Further, in C&W segment, HAVL expects margin should be better in 3Q if there is not much volatility
in RM prices, and 4Q should experience normal margins. In lighting segment, margin should bottom out this year
and expects improvement from next year. It expects ECD segment margin to normalize in FY26. In switches and
switchgear segment, HAVL expects low double-digit growth with a recovery in industry demand.
VOLT:
RAC exit market share stood at 21.0% as of Sep’24. It has seen strong growth in Voltbek home appliances
business, with a market share of 7.5% for washing machines and 5% for refrigerators as of Sep’24-YTD. Increased
volume in Voltbek business led to a gradual reduction in losses. It aims to break-even at the EBITDA level in the
near future. In the EMPS segment, project execution was hit by heavy rains. However, it expects business to
return to normal levels going forward.
Exhibit 69: Aggregate* UCP EBIT and margin
UCP EBIT (INR b)
7.6
5.9
4.6
6.4
4.6
3.2
1.3
20 18 22 38 44 20 25 46 50 24 31 60 75 29
1.5 1.1 1.0 2.4 2.0 0.3 0.8 2.9 2.4 0.8 1.3 4.5 5.5 1.5
6.3
4.7
3.3
4.1
UCP EBIT Margin (%)
7.5 7.4
5.0
Guidance highlights:
Exhibit 68: Aggregate* UCP revenue and growth
UCP revenue (INR b)
123
41 34
8
26
YoY Growth (%)
31 49 21
10 17
20
15 22 22
Source: Company, MOFSL; Note: *In UCP revenue and EBIT we consider VOLT, HAVL, and Blue star (not rated)
November 2024
32
 Motilal Oswal Financial Services
India Strategy | Review 2QFY25
Exhibit 70: Aggregate* C&W revenue and growth
Cables and wires Revenue (INR b)
72
43
30
41
51
15 14 13
32
23
22 15 18
11
Exhibit 71: Aggregate* C&W EBIT and margin
Cables and Wires EBIT (INR b)
EBIT Margin (%)
YoY Growth (%)
10
9
10
11
10 10
13 12 13
12 13 13
12
11
33 50 56 65 50 58 64 74 66 71 73 87 73 87
3.3 4.7 5.7 7.2 4.9 5.6 7.7 9.4 8.3 9.2 9.1 11.8 8.7 9.6
Source: Company, MOFSL; Note: *In Cables and Wires revenue and EBIT we considered Polycab, KEII, HAVL
EMS: Stars aligned for EMS: Strong revenue growth and stability in margins drive all-round performance
Strong revenue growth across EMS players:
The EMS sector reported another robust quarter with aggregate
revenue doubling on a YoY basis to INR153.8b. This superlative growth was driven by the execution of a strong order
book at hand. Dixon led the pack with revenue surging 2.3x YoY, followed by Amber (82%), and Kaynes (59%).
Avalon witnessed a strong recovery with revenue up 37% YoY. DATAPATT was the only outlier with revenue
declining ~16% YoY due to deferment of a completed order by the client. Going ahead, we expect the strong
revenue momentum to continue led by healthy demand traction and strong order book (~INR146.6b as of Sep’24;
excluding Dixon and Amber, i.e., ~1.7x of TTM revenue of these companies). We expect aggregate revenue growth
of ~66% for our coverage universe in 2HFY25.
The order book (Ex-Dixon, Amber) remains healthy; tapering of order inflows likely to reverse in 2HFY25:
The
sector continues to witness healthy order inflows (INR26.7b) in 2QFY25. However, the intensity of the inflows has
moderated with order inflows growing ~12% YoY. Most of the companies expect order inflows to accelerate in 2H,
fueled by inflows from newly added clients and healthy traction in a seasonally strong period. Among our coverage
universe, Kaynes saw the highest order book growth of ~57% YoY, followed by Syrma/Avalon at ~26%/19% YoY.
Operating leverage at play; aggregate margins dragged by Dixon:
EBITDA margin for our coverage universe
dipped 60bp YoY due to a 150bp contraction in gross margin. However, the contraction was fully attributable to
Dixon (EBITDA margin down 30bp YoY). Excluding Dixon, the coverage universe witnessed a margin expansion of
~40bp YoY, with all the companies witnessing margin expansion/stability. Avalon witnessed the highest EBITDA
margin expansion of ~470bp YoY, led by a shift in ~45-50% of the US manufacturing operations to India and
favorable operating leverage. It was followed by Syrma (EBITDA margin up 160bp YoY), which benefitted from a
favorable business mix during the quarter. Going forward, we expect the margins for our coverage universe to
remain broadly stable on a YoY basis in 2HFY25.
The quarter experienced five earnings upgrades:
We have upgraded our earnings estimates for Avalon by 36%/10%
for FY25/FY26 as we expect a strong 2HFY25 performance due to restocking by the US customers, incremental
order flows from new customers, and the growing Indian business.
Apart from these, we have upgraded our earnings estimates for Dixon (up 13%/5%/5% in FY25/FY26/FY27 to
factor in higher growth in mobile phones & lighting product segments) and Amber (up 14%/19%/22% in
FY25/FY26/FY27 to factor in higher growth in consumer durables and electronics segments).
Further, we have upgraded our FY25 earnings estimates for Syrma by 6%, factoring in a better-than-expected
operating performance of 2Q (while largely maintaining our FY26 estimates); we have also upgraded our FY26
earnings estimate for Cyient DLM led by integration of a newly acquired US company, Altek Electronics (FY25
estimates revised down by 5% due to higher-than-anticipated interest costs because of a rise in debt).
Surprises:
DIXON, AMBER, AVALON and SYRMA SGS.
Misses:
KAYNES, Cyient DLM and DATA PATTERN.
November 2024
33
 Motilal Oswal Financial Services
India Strategy | Review 2QFY25
Guidance highlights:
Kaynes
maintains its guidance of surpassing INR30b revenue in FY25 with EBITDA margins of ~15%. It is expected
to clock ~USD1b revenue by FY28 and triple its revenue by FY29 (on FY25 base). An increase in the mix of high-
margin sectors, coupled with operating leverage, will drive margin expansion in 2HFY25.
Avalon
has maintained its FY25 revenue growth guidance to 16-20% with gross margins ranging from 33% to
35%. It expects healthy growth to continue in 2HFY25. The US manufacturing mix is expected to come down to
~15% by the end of FY25, resulting in cost benefits and margin expansion.
Syrma SGS
maintains its FY25 revenue growth guidance of 40-45% (i.e., revenue of ~INR45b) and EBITDA margin
of ~7% (i.e., EBITDA of ~INR3.1-3.2b). In 2HFY25, the company expects a better mix from the healthcare and
ODM businesses.
Cyient DLM
maintains its guidance of ~30% revenue CAGR. It expects EBITDA margins to reach near to its earlier
guidance of double digits, but they will be largely flat YoY in FY25.
DATAPATT
guides ~20-25% revenue growth in FY25, with EBITDA margins of ~35-40%. The company expects
revenue growth for 2H, led by deferment of orders.
Revenue (INR m)
2Q
2Q
YoY
1Q
FY25 FY24 (%)
FY25
5,721 3,608 59
5,040
2,750 2,010 37
1,995
3,895 2,918 33
2,579
8,327 7,117 17 11,599
910 1,083 -16
1,041
1,15,341 49,432 133 65,798
16,847 9,271 82 24,013
1,53,791 75,440 104 1,12,064
21,603 16,737 29 22,253
EBITDA margins (%)
2Q
YoY
1Q
FY24 (bp) FY25
13.5
80
13.3
6.3
470
2.2
8.1
10
7.8
6.9
160
3.8
37.6
10
35.7
4.0
-30
3.8
6.4
30
8.2
5.7
-60
5.5
10.4 110
7.8
Adj PAT (INR m)
2Q
YoY
1Q
QoQ
FY24 (%) FY25 (%)
323
86
508
19
73
140
-23
-857
147
5
106
46
297
22
193
88
338
-10
328
-8
1,073 100 1,337 60
-69
NA
724
-73
2,181 80 3,172 24
1,177 36 1,112 44
Source: MOFSL, Company
Exhibit 72: Key operating indicators
QoQ
(%)
14
38
51
-28
-13
75
-30
37
-3
2Q
FY25
14.4
11.0
8.1
8.5
37.7
3.7
6.8
5.1
11.5
QoQ
2Q
(bp) FY25
110
602
880
175
40
155
470
362
200
303
-10 2,144
-140 192
-40 3,933
380 1,597
Kaynes
Avalon
Cyient DLM
Syrma SGS
Data Patterns
Dixon
Amber
Agg.
Agg. (ex. Dixon, Amber)
Exhibit 73: Aggregate EBITDA margin remained under
pressure due to…
Aggregate EBITDA Margins
7.2%
6.3%
7.9%
6.0%
5.7%
6.0%
7.2%
5.1%
5.5%
Exhibit 74: …unfavorable product mix that adversely
impacted aggregate gross margin
Aggregate Gross Margins
18.0%
16.2%
16.2%
15.6%
15.4%
16.0%
13.9%
14.1%
15.7%
Source: MOFSL, Company
FY26E
Old
168.3
95.2
94.2
15.1
22.0
15.0
53.1
Exhibit 75:
Our revised EPS estimates (INR)
Dixon
Amber
Kaynes
Avalon
Cyient DLM
Syrma SGS
Data Patterns
Revised
134.3
78.0
53.8
9.2
13.1
9.5
39.1
FY25E
Old
114.0
68.1
53.4
6.7
13.9
9.0
40.0
Chg (%)
18
15
1
36
-5
6
-2
Revised
177.4
113.0
95.1
16.6
24.7
14.7
51.4
Chg (%)
5
19
1
10
12
-2
-3
November 2024
34
 Motilal Oswal Financial Services
India Strategy | Review 2QFY25
FINANCIALS – BANKS: Earnings growth affected by persistent NIM pressure, unsecured delinquencies;
Deposit growth surpasses credit growth
The banking sector reported a soft quarter amid moderation in margins and a rise in provisioning expenses,
mainly for private banks. NIM declined for many banks as cost pressure persisted amid intense competition for
liabilities and continued pressure on CASA mix. Public sector banks (PSBs) also witnessed margin compression
mainly due to the classification of penal interest to penal charges in other income. Opex growth normalized,
whereas other income for most banks remained healthy. Deposit growth for most private banks remained
steady, surpassing the credit growth, and therefore, the loan-to-deposit (LDR) ratio moderated for some banks.
Growth in corporate segment was tepid, while unsecured retail loan growth also moderated, reflecting the
stress in microfinance and credit card. We have cut our growth estimates for many banks. We note that the
deceleration in credit growth has been sharper than we thought (partly driven by the weakness in the credit
environment, mainly unsecured loans, besides elevated LDR). We have lowered our FY25 credit growth estimate
to 11% from 12.5% earlier.
NII growth stood at 11.3% YoY for private banks and 5.1% YoY for PSBs. In our coverage universe, AUBANK and
Federal Bank reported healthy NII growth sequentially, whereas RBK and UNBK reported a sequential decline,
impacted by penal charge adjustment. Further, we believe that NII growth moderation should continue in the
near term as cost pressure continues. As a result, we believe that the NII growth trajectory should lag credit
growth over the coming quarters. We remain watchful on the margin trajectory as the funding cost remains
elevated and a potential turn in the rate cycle will further put pressure on lending yields. Some banks witnessed
a double-digit decline in margins, with RBK reporting a 32bp decline in margins. HDFCB saw only 1bp contraction
in margins sequentially.
Fresh slippages increased for most banks mainly due to stress in microfinance and other unsecured loan
segments. As the asset quality of unsecured loans has deteriorated, most lenders have adopted a cautious
stance on underwriting and are growing slower in this segment. SMA book of PSBs increased during the quarter
due to state-owned PSU accounts. However, most PSBs have guided for a controlled credit cost (PNB has
reduced its FY25 credit cost guidance to 0.25%-0.30%), supported by healthy recoveries and lower slippages.
Private banks (especially with high MFI exposure) should see elevated credit cost as PAR formation remains high.
PCR increased for select lenders, while the restructured book continued to follow a declining trend.
Private Banks – Deposit growth surpasses credit growth; margin pressure continues:
Advances growth was
healthy in 2Q, barring HDFCB, which saw 1.3% QoQ growth. However, for most banks, deposit growth outpaced
credit growth. ICICIBC/AUBANK saw healthy credit growth of 4.4% /5.8% QoQ and steady deposit growth of 5%/
12.7% QoQ. HDFCB also reported healthy deposit growth of 5.1% QoQ. Among mid-sized banks, DCBB reported
strong business growth, with advances/deposits up 5.4%/5.5% QoQ. The CASA ratio continued to moderate for
most banks (FB saw ~80bp QoQ expansion). NIM continued to contract as yields declined due to slower growth
in microfinance and unsecured segments for most banks. Slippages inched up for select banks due to stress in
the unsecured segment, while others kept them under control.
Public Sector Banks – Earnings momentum steady; asset quality continues to improve:
NII saw flat growth as
NIMs declined for most banks due to adjustment for penal charges. UNBK and PNB saw a 15bp QoQ decline each
in margins. Slippages remained under control for most banks, barring UNBK, which reported higher slippages
due to one large ticket size account. Recoveries and upgrades also remained healthy. As a result, the GNPA ratio
improved 8-50bp QoQ. Overall, PCR continued to be at healthy levels of ~74-90%. SMA book increased due to a
long-term government account; however, the restructured book witnessed a sequential decline.
Small Finance Banks – Business growth healthy; asset quality deteriorates:
AUBANK reported healthy business
growth as advances jumped 48% YoY (merged basis, 5.8% QoQ), led by growth in both retail and commercial
assets. Deposit growth was robust at 12.7% QoQ, whereas the CASA ratio moderated to 32%. Asset quality
deteriorated and credit cost was high due to ongoing stress in unsecured (MFI and Credit Card). EQUITASB
reported healthy advances growth of 18% YoY/6.4% QoQ; however, its MFI book declined as the management
November 2024
35
 Motilal Oswal Financial Services
India Strategy | Review 2QFY25
remains cautious amid rising delinquencies in the sector. Deposits grew at a healthy 6.2% QoQ. NIMs declined to
7.69%. Slippages were elevated and the bank made additional provisions due to stress in microfinance business.
Our view:
After 2QFY25 results, we have lowered our growth estimates for many banks. We earlier estimated a
credit growth of 12.5% YoY for FY25, which we now believe can drift down toward ~10.5% YoY. We remain
vigilant about margins and the delinquency cycle in unsecured loans and factor in some more increase in credit
cost for private banks. We have slightly cut our estimates for private banks by ~1% for FY25/FY26. We thus
expect private banks’ aggregate earnings to grow 8% YoY. However, over FY26/FY27, we estimate earnings to
gain traction and project 16%/18% growth in PAT. For PSBs, we have raised our earnings estimates by 1.4% for
FY25 and reduced by 1.3% for FY26. We estimate aggregate earnings growth for PSBs to moderate to 9-12% over
FY26-27. Robust balance sheets, strong contingency buffers and reasonable sector valuations keep us positive
on the sector.
Our preferred picks
are ICICIBC, HDFCB, SBIN and FB.
Surprises: BOB, PNB, SBIN, AUSFB, FB
Misses: IDFCB, IIB, EQUITASB, SBI Cards
Guidance highlights
HDFCB
is focusing on deposits and has outperformed the industry in deposit growth. The bank expects to
achieve LDR of 85-90% within 2-3 years at an accelerated pace. The bank is motivated to decrease its LDR swiftly
while ensuring profitability.
KMB
is making efforts to build its strong and stable deposits franchise. It focuses on garnering deposits at a
lower cost and has cut the savings account rate by ~50bp. Reductions in yield on advances and NIM are due to a
change in the asset mix more toward secured products. The bank has entered into an agreement to acquire the
personal loan portfolio of Standard Chartered Bank India.
ICICIBC
prioritizes retaining deposits and cultivating strong customer relationships rather than heavily promoting
its products. A substantial segment of the current customer base still does not utilize credit cards, presenting a
potential growth area. Retail deposit rates have increased by 15bp this calendar year, slightly raising the cost of
deposits. The bank has already implemented most of the necessary rate adjustments and does not foresee
further increases in retail deposit rates. A ~7bp effect on the bank’s overall NIMs has resulted from the impact of
day count conventions. The bank anticipates relatively stable NIMs in 2H, barring the start of a rate-cutting cycle.
AXSB
deposit growth was lower compared to peers. Loan growth – HL, VF and corporate have been lagging the
system average growth and the bank expects a pick-up in loan growth in retail. It expects to continue operating
within a similar range of CD ratio. Write-offs have been higher, following the bank's pre-defined policy.
SBIN
delivered a healthy performance with 15.3% credit growth and guides for 14-15% growth, backed by
broad-based sector growth. Deposit growth guidance is 10%+ YoY. Incremental Credit growth will be funded by
incremental deposit growth. The bank is actively engaged with the government regarding SMA accounts to
maintain oversight and manage any potential risks effectively. Credit cost guidance is 0.5% and slippages will be
contained.
IIB
is comfortable with 16-18% growth. It is cautiously optimistic about loan growth and will accelerate growth
as the credit environment improves. The cost of deposits increased 2bp QoQ, while yields declined due to slower
growth in MFI and other higher-yield business. 1H credit cost was at 131bp vs. the guidance of 110-130bp. The
bank does not expect 2H credit cost to exceed the guided range of 110-130bp.
BOB
deposit growth remains challenging, with the bank lowering its guidance to 9-11% from 10-12% earlier. Loan
growth guidance is revised to 12-13% from 12-14% due to a moderation in the international book, though the bank
aims to exceed this target. The bank maintains its previous NIM guidance at 3.15% (+/- 5bp) and anticipates a
decline in the cost of deposits. Credit cost is projected at 0.75%, and the slippage ratio at 1%-1.25%.
November 2024
36
 Motilal Oswal Financial Services
India Strategy | Review 2QFY25
Exhibit 76: Earnings decline led by NIM pressures & elevated credit cost for select private banks; PSBs reported healthy
earnings
INR b
AUBANK
AXSB
BANDHAN
BoB
CBK
DCBB
FB
HDFCB
ICICIBC
IDFCFB
IIB
INBK
KMB
PNB
RBK
SBIN
UNBK
EQUITASFB
2QFY25
19.7
134.8
29.5
116.2
93.2
5.1
23.7
301.1
200.5
47.9
53.5
61.9
70.2
105.2
16.1
416.2
90.5
8.0
NII
YoY (%)
58.1
9.5
20.7
7.3
4.6
7.0
15.1
10.0
9.5
21.2
5.3
7.9
11.5
6.0
9.5
5.4
(0.9)
4.8
QoQ (%)
2.8
0.3
(1.9)
0.2
1.6
2.5
3.3
0.9
2.5
2.0
(1.1)
0.3
2.6
0.4
(5.0)
1.2
(3.9)
0.1
2QFY25
11.3
107.1
18.6
94.8
76.5
2.6
15.7
247.1
167.2
19.6
36.0
47.3
51.0
68.5
9.1
292.9
81.1
3.5
PPOP
YoY (%)
80.0
24.1
17.2
18.2
0.5
21.2
18.2
8.9
17.5
29.9
(7.9)
9.9
10.6
10.2
24.5
50.9
12.4
5.9
QoQ (%)
18.9
6.0
(4.4)
32.3
0.5
24.2
4.3
3.4
4.4
4.2
(8.9)
5.0
(2.9)
4.1
5.9
10.8
4.2
2.7
2QFY25
5.7
69.2
9.4
52.4
40.1
1.6
10.6
168.2
117.5
2.0
13.3
27.1
33.4
43.0
2.2
183.3
47.2
0.1
PAT
YoY (%)
42.1
18.0
30.0
23.2
11.3
22.6
10.8
5.3
14.5
(73.3)
(39.5)
36.2
4.8
145.1
(24.3)
27.9
34.4
(93.5)
QoQ (%)
13.7
14.6
(11.9)
17.5
2.8
18.4
4.7
4.0
6.2
(70.5)
(38.7)
12.6
(5.0)
32.4
(40.1)
7.6
28.3
(50.0)
Total Banking Coverage 1793.3
8.1
0.8
1349.9
19.3
6.3
826.3
17.4
6.7
Source: MOFSL, Company
Exhibit 77: NIMs continue to moderate with some banks reporting double digit compression
NIM (%)
AUBANK
AXSB
BANDHAN
BoB
CBK
DCBB
FB
HDFCB
ICICIBC
IDFCFB
IIB
INBK
KMB
PNB
RBK
SBIN
UNBK
1QFY25
6.00
4.05
7.60
3.18
2.90
3.39
3.16
3.47
4.36
6.22
4.25
3.53
5.02
3.07
5.67
3.22
3.05
2QFY25
6.05
3.99
7.40
3.10
2.86
3.27
3.12
3.46
4.27
6.18
4.08
3.49
4.91
2.92
5.35
3.19
2.90
YoY (bp)
55
(12)
20
3
(14)
(42)
(10)
6
(26)
(14)
(21)
(3)
(31)
(19)
(19)
(10)
(28)
QoQ (bp)
5
(6)
(20)
(8)
(4)
(12)
(4)
(1)
(9)
(4)
(17)
(4)
(11)
(15)
(32)
(3)
(15)
November 2024
37
 Motilal Oswal Financial Services
India Strategy | Review 2QFY25
Exhibit 78: Deposit growth outpaced credit growth of many banks
INR b
AUBANK*
AXSB
BANDHAN
BoB
CBK
DCBB
FB
HDFCB
ICICIBC
IDFCFB
IIB
INBK
KMB
PNB
RBK
SBIN
UNBK
2QFY25
948
10,000
1,261
11,212
9,840
445
2,303
24,951
12,772
2,151
3,572
5,329
3,995
10,196
879
38,574
8,971
Loans
YoY (%)
47.8
11.4
23.6
12.3
10.3
19.3
19.4
7.0
15.0
20.7
13.2
13.2
14.7
14.6
15.1
15.3
11.6
QoQ (%)
5.8
2.0
3.7
7.0
4.0
5.4
4.3
1.3
4.4
6.2
2.7
2.3
2.5
3.6
1.4
2.9
2.1
2QFY25
1,097
10,867
1,425
13,635
13,473
545
2,691
25,001
14,978
2,236
4,124
6,931
4,615
14,583
1,080
51,173
12,419
Deposits
YoY (%)
44.8
13.7
22.8
9.1
9.3
19.9
15.6
15.1
15.7
30.6
14.7
8.2
15.1
11.3
20.2
9.1
9.2
QoQ (%)
12.7
2.3
(1.5)
4.3
0.9
5.5
1.1
5.1
5.0
6.6
3.5
1.8
3.1
3.6
6.5
4.4
1.5
CASA ratio (%)
2QFY25
YoY (%)
QoQ (%)
26.9
(84)
(113)
41.0
(300)
(100)
33.2
(264)
(372)
39.8
(4)
(78)
31.3
(88)
29
25.6
57
20
30.1
(110)
80
35.3
(230)
(70)
40.6
(16)
(28)
48.9
247
228
35.9
(353)
(80)
38.9
(125)
(17)
43.6
(470)
20
39.3
(284)
(77)
33.6
(219)
99
40.0
(185)
(67)
32.7
(194)
(68)
Total Banking Coverage 1,47,399
12.9
2.6
1,80,874
11.9
2.7
39.4
* AU Bank Nos on merged with Fincare, Source: MOFSL, Company
Exhibit 79: Asset quality deteriorates for select banks; Slippage ratio remain elevated
Asset quality
(%)
AUBANK
AXSB
BANDHAN
BoB
CBK
DCBB
FB
HDFCB
ICICIBC
IDFCFB
IIB
INBK
KMB
PNB
RBK
SBIN
UNBK
GNPA
1.78
1.54
4.23
2.88
4.14
3.33
2.11
1.33
2.15
1.90
2.02
3.77
1.39
4.98
2.69
2.21
4.54
1QFY25 (%)
NNPA
0.63
0.34
1.15
0.69
1.24
1.18
0.60
0.39
0.43
0.59
0.60
0.39
0.35
0.60
0.74
0.57
0.90
PCR
67.6
78.1
73.7
76.6
71.0
65.2
71.9
71.2
80.2
69.4
70.6
90.0
74.9
88.4
73.1
74.4
80.9
GNPA
1.98
1.44
4.68
2.50
3.73
3.29
2.09
1.36
1.97
1.92
2.11
3.48
1.49
4.48
2.88
2.13
4.36
2QFY25 (%)
NNPA
0.75
0.34
1.29
0.60
0.99
1.17
0.57
0.41
0.42
0.48
0.64
0.27
0.43
0.46
0.79
0.53
0.98
PCR
62.8
76.6
73.5
76.3
74.1
65.2
72.9
71.2
79.0
75.3
70.1
92.5
71.4
90.2
73.0
75.7
78.4
QoQ change (bp)
GNPA
NNPA
PCR
20
12
(229)
(10)
-
(144)
45
14
(21)
(38)
(9)
(27)
(41)
(25)
308
(4)
(1)
(3)
(2)
(3)
101
3
2
-
(18)
(1)
(117)
2
(11)
588
9
4
(47)
(29)
(12)
243
10
8
(344)
(50)
(14)
174
19
5
(15)
(8)
(4)
125
(18)
8
(255)
2QFY25 (%)
Slippage Ratio
4.59
1.87
3.89
0.28
0.26
4.54
0.82
1.29
1.83
4.13
2.14
1.18
3.75
1.05
5.38
0.59
2.16
Exhibit 80: Snapshot of restructured book across Banks (%)
INR b
AXSB
BANDHAN
DCBB
HDFCB
ICICIBC
IIB
KMB
FB
RBK
AUBANK
BOB
SBIN
INBK
PNB
UNBK
CBK
Absolute
13.2
NA
9.2
NA
25.5
10.4
2.5
16.4
3.3
3.8
NA
148.3
71.4
NA
112.4
NA
Sep’22
0.38
0.2
5.45
0.53
0.7
1.5
0.34
2.03
2.21
1.7
2.12
0.93
3.9
1.8
2.6
2.09
Dec’22
0.3
NA
4.94
0.42
0.5
1.25
0.25
1.81
1.67
1.4
1.87
0.85
3.37
1.54
2.38
1.75
Restructured book
Mar’23
Jun’23
0.22
0.21
NA
NA
4.51
3.97
0.31
NA
0.4
NA
0.84
0.66
0.22
0.19
1.62
1.4
1.21
1.05
1.2
1
1.5
1.31
0.8
0.69
2.51
2.19
1.32
NA
2.2
2
NA
NA
Sep’23
0.2
NA
3.4
0.22
0.32
0.54
0.15
1.3
0.89
0.8
NA
0.62
2.12
NA
1.71
NA
Dec’23
0.18
NA
3
NA
0.29
0.48
0.13
1.1
0.63
0.7
1
0.54
1.93
NA
1.57
NA
Mar’24
0.16
NA
2.62
NA
0.26
0.40
0.10
0.97
0.51
0.60
NA
0.47
1.67
NA
1.48
NA
Jun’24
0.14
NA
2.34
NA
0.22
0.34
0.08
0.83
0.44
0.40
NA
0.43
1.51
NA
1.30
NA
Sep’24
0.13
NA
2.07
NA
0.20
0.29
0.06
0.71
0.38
0.40
NA
0.38
1.34
NA
1.21
NA
November 2024
38
 Motilal Oswal Financial Services
India Strategy | Review 2QFY25
Exhibit 81: We slightly cut our earnings estimate for private banks by ~1% for FY25-26E; while earnings for PSBs remain
steady
PAT (INR b)
Private Banks
AXSB
BANDHAN
DCBB
HDFCB
ICICIBC
IDFCFB
IIB
KMB
FB
RBK
AUBANK
EQUITASB
Total Private Banks
YoY growth
PSU Banks
BOB
CBK
INBK
PNB
SBIN
UNBK
Total PSU Bank
YoY growth
Total for Banks
YoY growth
Other Financials
SBICARD
PAYTM
Old estimates
FY25E
FY26E
263.9
39.3
6.0
678.2
446.8
29.9
88.6
142.5
41.2
12.7
21.6
6.4
1,777.1
9.5%
194.7
161.4
102.2
143.6
698.1
156.2
1,456.2
18.0%
3,233.4
13.2%
26.2
-18.5
304.4
46.0
7.6
764.8
505.4
42.2
109.3
164.9
49.8
17.9
28.8
10.2
2,051.2
15.4%
213.9
175.8
112.2
168.5
782.7
179.2
1,632.3
12.1%
3,683.5
13.9%
35.3
-8.0
Revised estimates
FY25E
FY26E
262.6
39.1
5.9
670.0
459.1
24.4
73.8
144.3
41.6
10.2
22.4
6.4
1,760.0
8.5%
185.5
162.6
104.1
156.5
698.1
155.6
1,462.2
18.5%
3,222.3
12.8%
20.4
-16.9
303.2
42.6
7.7
760.5
514.5
40.2
99.8
161.0
49.4
17.2
29.2
10.2
2,035.4
15.6%
203.6
183.6
112.8
176.8
782.7
170.7
1,630.3
11.5%
3,665.7
13.8%
28.6
-7.0
Change (%)
FY25E
-0.5%
-0.4%
-2.7%
-1.2%
2.8%
-18.3%
-16.7%
1.3%
1.0%
-19.6%
3.7%
-44.3%
-1.1%
FY26E
-0.4%
-7.3%
2.2%
-0.6%
1.8%
-4.8%
-8.7%
-2.3%
-0.8%
-3.9%
1.4%
-18.0%
-0.9%
-4.7%
0.7%
1.8%
8.9%
2.0%
-0.4%
1.4%
0.0%
-4.8%
4.5%
0.5%
4.9%
-2.4%
-4.7%
-1.3%
-1.0%
-22.1%
NA
-19.1%
FINANCIALS – NBFC: Loan growth outlook weakens; unsecured retail keeps credit costs high
NBFCs (incl. HFCs) under our coverage reported AUM growth of ~17% YoY/4% QoQ in 2QFY25. Vehicle financiers
(VFs) clocked AUM growth of 24% YoY, but we expect growth to moderate by FY25 end. Large HFCs (PNBHF and
LICHF) grew 7% YoY; affordable and small-ticket HFCs saw ~15% YoY growth; NBFC-MFIs grew 12% YoY (down
6% QoQ); and gold loan NBFCs grew ~25% YoY. NII/PPoP/PAT grew 19%/17%/2% YoY for our coverage
companies (excl. PIEL).
NIM for HFCs (including affordable HFCs) was either stable QoQ or contracted because of pressure on yields and
an increase in the portfolio cost of borrowings (CoB). For CANF, NIM expanded ~10bp QoQ due to higher yields
and lower CoB. Large HFCs, such as PNBHF, reported stable NIM QoQ, while LICHF reported a ~5bp QoQ decline
in NIM, mainly due to a contraction in yields. Among small HFCs, AB Housing Finance reported stable NIM QoQ
and Aavas reported a sequential NIM compression in 2Q.
While there is no consensus on the quantum and timing of a repo rate cut in India, it will be incrementally
positive for fixed-rate vehicle financing. The demand outlook has weakened in the new vehicle segment amid
weakening demand in the PV segment and sluggishness in last-mile delivery vehicles like LCV/SCV (due to weak
consumption). In the used vehicle segment, there was a divergence in commentaries by VFs, with one suggesting
stable momentum and the other suggesting demand/delinquencies in used CVs were similar to that in new CVs.
VFs indicated that 2H is expected to be better in terms of disbursements and AUM growth. VFs (except SHFL)
reported a minor worsening in asset quality due to industry-wide deterioration in collections accentuated by
floods and extended monsoons in certain parts of the country.
Except for power financiers and select affordable HFCs, a vast majority of NBFCs, including MFIs (particularly in
unsecured product segments), reported a deterioration in asset quality, attributable to customer overleveraging,
sluggishness in consumption, and floods/extended monsoons. In addition to customer overleveraging, MFIs also
November 2024
39
 Motilal Oswal Financial Services
India Strategy | Review 2QFY25
attributed sustained slippages to low center meeting attendance and high attrition at the loan officer levels.
Asset quality remains a concern for MFIs and a recovery is still distant. PNBHF, LICHF, PFC, REC and SHFL
reported a QoQ improvement in asset quality. Credit costs were significantly elevated for NBFC-MFIs, which
posted a sequential decline in loan growth and a sharp deterioration in asset quality. CREDAG/Spandana/Fusion
reported a sequential rise in GS3 of ~100bp/~230bp/~395bp, resulting in high credit costs in 2Q.
HFCs/AHFCs – Expected Interest rate cut and rollout of CLSS scheme are positive for demand outlook; NIM could
exhibit transitory compression:
HFCs reported a steady quarter as disbursements were either sequentially stable
or exhibited minor growth because of lower construction activity during monsoons. PNBHF, LICHF, CANF and
Repco reported a sequential improvement in disbursements. Competitive intensity remains high, which impacted
the incremental yields for HFCs. Affordable HFCs (except for HomeFirst, CANF, Repco) reported a sequential
moderation in margins because of the pressure on yields and a rise in CoB (in some cases). Selectively, some
affordable HFCs have taken PLR increases to offset the compression in spreads and NIM. Asset quality remained
broadly stable or improved across HFCs and AHFCs despite some industry stress seen in other (unsecured)
products, as borrowers prioritized repaying secured loans.
Vehicle financiers – Muted disbursements on slowdown in PVs; minor deterioration in asset quality from
floods and extended monsoons:
Disbursements grew 11% YoY for three VFs in our coverage universe. While
SHFL and CIFC have a diversified AUM mix, we have classified them under VFs for this exercise. Asset quality
deteriorated for CIFC and MMFS, while there was a minor improvement for SHFL. SHFL’s NIM saw a minor
sequential improvement because of better yields. However, NIM for MMFSL saw a minor contraction due to
pressure on yields and some impact of seasonality from higher trade advances before the onset of the festive
season.
Diversified financiers – Stress from unsecured retail loans such as MFI and small-ticket MSME, resulting in
growth calibration and higher credit costs:
Diversified lenders, including BAF, AB Capital, LTFH and even SHFL,
continued to calibrate their growth in personal loans. Poonawalla acknowledged the stress in small-ticket
personal loans and took a one-time credit cost of ~INR6.7b on this book. LTFH performed significantly better
than the overall industry and its MFI peers, and did not exhibit any significant stress in its rural business loans
(MFI portfolio). However, in our view, it remains vulnerable given that the MFI sector is going through a period
of heightened stress and there is no visibility on improvement in collections as yet.
Gold financiers – Gold loan growth remained healthy without any associated trade-off in margins:
Gold loan
growth over the last two quarters has been accompanied by decent gold tonnage growth and customer
additions. MUTH/MGFL reported ~6%/3% QoQ growth in gold loans. Asirvad MFI (subsidiary of MGFL) and
Belstar (subsidiary of MUTH) acknowledged the stress in the MFI segment, which resulted in higher credit costs.
During the quarter, the RBI in its circular instructed gold lenders to review their gold lending policies and
monitor the end use of gold loans. Going forward, we need to closely monitor the trajectory of gold prices and
the impact on competitive industry after the ban on IIFL Finance was revoked by the RBI.
Microfinance institutions (MFIs) – Asset quality deteriorated further and loan growth was muted; high credit
costs impacted profitability; recovery is still distant:
A
significant deterioration in asset quality across the
microfinance sector, with all NBFC-MFIs, SFBs and even larger banks acknowledging the problem of customer
overleveraging, which has resulted in higher delinquencies and lower collection efficiencies. Spandana
attributed its asset quality deterioration to high attrition, low center meeting attendance and disruption in
select geographies due to rainfall and floods. CREDAG continued to see forward flows into higher buckets and
reported a lower collection efficiency, resulting in a rise in GS3. FUSION performed the worst among MFIs,
reporting a GNPA of ~9.4% as of Sep’24; this has perhaps triggered auditors to comment on material uncertainty
in relation to going concern assumption of the company. MFIs have aligned their business teams and have
become compliant with the guardrails proposed by MFIN. We believe credit costs are likely to remain high in 3Q
and will be far from the normal level. We expect a recovery by FY25 end or early FY26.
Power financiers – Good quarter supported by strong disbursements and healthy loan growth; stressed asset
resolutions keep credit costs benign:
Power financiers reported a robust loan growth in 2Q, with PFC/REC
reporting loan growth of ~10%/15% YoY. NIM was broadly stable. Both lenders posted strong sanctions and
guided for healthier disbursements and loan growth in 2HFY25. Asset quality continued to improve, driven by
November 2024
40
 Motilal Oswal Financial Services
India Strategy | Review 2QFY25
resolution of a stressed asset. Given expectations of resolutions in some of the stressed assets, which are in
advanced stages of resolution, credit costs will be benign in 2H.
Our view:
Expected cuts in repo rates in 2HFY25 will be positive for the NBFC sector (in particular for fixed-rate
lending like vehicle finance). The microfinance sector will go through a difficult patch for the next few quarters
because the problem of customer overleveraging is broad-based (spread across different states) and this stress
will run its course before things improve. While we fundamentally have a
positive
stance on the sector, the
regulatory overhang has currently taken the center stage, with most investors/analysts trying to understand the
regulatory risks for each of the NBFCs (including MFIs and mortgage lenders). While VFs will benefit in a
declining interest rate environment, the outlook on their loan growth has become weaker due to a slowdown in
the PV segment. PMAY CLSS announced in the Union budget will spur housing purchases and give a gradual fillip
to demand for mortgages. Our preferred ideas are SHFL, PNBHF, and PFC/REC.
Positive Surprises:
SHFL, MUTH
Misses:
CREDAG, Spandana, Poonawalla, IIFL Finance, MMFSL, Fusion
Rating Change:
NA
Guidance highlights:
a) MMFS guided for flat disbursement growth in FY25; b) MUTH raised its FY25 gold AUM growth
guidance to ~25% YoY; c) BAF guided for ~27-28% AUM growth in FY25 and medium-term AUM growth of ~25-28%;
guided for FY25 credit costs of ~2.05% (vs. ~1.75%-1.85% earlier); d) PNBHF guided for retail recoveries to continue
for the next 4-5 quarters; and e) NBFC-MFIs, particularly CREDAG and Spandana, guided for stabilization in 3Q and
improvement from 4QFY25 onward.
Exhibit 82: PBT (ex-PIEL) down 1% YoY for our NBFC coverage universe*
75
62
PBT - YoY growth (%)
47
19
21
28
40
39
22
22
15
-1
Q3 2022
Q4 2022
Q1 2023
Q2 2023
Q3 2023
Q4 2023
Q1 2024
Q2 2024
Q3 2024
Q4 2024
Q1 2025
Q2 2025
Source: MOFSL, Company, *MOFSL universe excl. PIEL and Indostar
Exhibit 83: LICHF loan growth has lagged the industry, while
PNBHF retail loan growth has been gaining momentum
1HFY24
9MFY24
FY24
Q1 2025
1HFY25
11
7
4
3
8
Exhibit 84: Loan growth moderated for Aavas, while it was
largely stable for Repco and Canfin;
1HFY24
22 23 22 22
20
16
9MFY24
FY24
Q1 2025
1HFY25
6
5
4
4
6
13
11
9 10
9 8 8
7 8
LICHF
PNBHF
Note: YoY AUM growth for large HFCs
AAVAS
CANF
Repco
Note: YoY AUM growth for affordable housing financiers
November 2024
41
 Motilal Oswal Financial Services
India Strategy | Review 2QFY25
Exhibit 85: SHFL is best placed among VFs to exhibit strong
growth in the subsequent quarters
1HFY24
9MFY24
FY24
Q1 2025
42 40
27 25
1HFY25
37 35
Exhibit 86: Gold loan growth picking up pace, aided by
higher gold prices, tonnage growth and customer additions
1HFY24
9MFY24
31
21
23
25
20
8
12
15
9
17
FY24
Q1 2025
Q2 2025
33
20 21 21
21
20
24
23
20
SHFL
MMFS
CIFC
MUTH
MGFL
Note: YoY AUM growth for gold financiers
Note: YoY AUM growth for vehicle financiers
Exhibit 87: PAT (excl. PIEL) grew 2% YoY for our NBFC coverage universe*
INR m
AAVAS
ABCAP (NBFC)
ABCAP (HFC)
BAF
CANF
CIFC
Fivestar
HomeFirst
IIFL Finance
LTHF
LICHF
MMFSL
MASFIN
MGFL
Muthoot
PIEL
PNBHF
PFL
REPCO
SHFL
CREDAG
FUSION
SPANDANA
PFC
REC
Total (excl. PIEL)
NII
PPOP
PAT
NIM
2QFY25 YoY (%) QoQ (%) 2QFY25 YoY (%) QoQ (%) 2QFY25 YoY (%) QoQ (%) 2QFY25 YoY (bp) QoQ (bp)
2,418
9
-1
1,948
19.5
14.9
1,479
21.5
17.3
6.6
-0.7
-0.2
17,114
13
0
11,804
9.0
-1.7
6,290
14.8
1.3
6.2
-0.6
-0.3
2,730
33
20
1,158
18.2
27.6
1,038
7.1
22.5
4.2
-0.7
-0.0
88,377
23
6
73,071
25.2
5.2
40,137
13.0
2.6
9.7
-0.6
-0.1
3,398
7
6
2,878
6.5
3.0
2,115
33.8
5.9
3.8
-0.1
0.1
27,128
35
5
19,221
35.3
3.9
9,631
26.3
2.2
6.8
0.0
-0.1
5,161
30
7
3,800
36.9
7.1
2,679
34.4
6.5
19.4
-0.7
0.1
1,566
19
7
1,261
20.7
5.9
922
24.1
5.1
5.8
-0.8
-0.0
13,394
-6
-7
8,532
-8.9
24.1
-1,577
-
-
3.9
-0.0
0.0
25,431
35
5
15,899
22.5
8.3
6,967
17.2
1.7
11.2
1.6
0.0
19,739
-6
-1
17,417
-8.3
-1.7
13,289
11.9
2.2
2.7
-0.3
-0.1
18,106
14
2
11,961
26.9
5.4
3,695
57.1
-28.0
6.6
-0.4
-0.2
1,324
29
7
1,284
23.9
8.5
766
27.6
8.7
7.2
0.2
0.3
16,354
21
6
10,331
19.2
5.3
5,721
2.0
2.8
14.8
-0.2
0.3
25,180
35
9
19,150
42.7
11.6
12,511
26.3
16.0
11.8
0.6
0.0
7,754
6
7
3,166
-35.5
33.4
1,630
238.2
-10.2
8.0
-1.0
3.0
6,618
3
3
5,591
1.3
3.1
4,697
22.6
8.5
3.7
-0.3
0.0
5,592
18
-3
2,792
-16.8
-35.4
-4,710
-
-
9.2
-1.7
-0.8
1,884
7
3
1,367
2.2
-0.9
1,125
14.7
6.7
5.1
-0.3
-
54,641
19
4
39,848
14.5
3.4
20,696
18.2
4.5
9.2
-0.1
0.0
4,846
14
-5
6,721
19.5
-5.2
1,861
-46.4
-53.2
13.5
0.4
0.5
3,987
30
0
2,838
17.4
-4.7
-3,050
-
-
11.5
0.4
-0.1
3,487
10
-20
2,278
-11.6
-20.6
-2,163
-
-
14.0
-0.8
-1.9
44,083
18
2
53,284
13.7
15.8
43,704
13.6
17.6
3.6
0.1
0.0
49,678
23
6
48,955
21.0
2.0
40,055
6.2
16.4
3.7
0.3
0.1
4,42,235
19
4
3,63,391
17.5
5.2
2,07,876
2.4
-1.5
Source: MOFSL, Company, *MOFSL universe excl. PIEL and Indostar
November 2024
42
 Motilal Oswal Financial Services
India Strategy | Review 2QFY25
Exhibit 88: Advances/AUM growth
INR b
AAVAS
ABCAP (NBFC)
ABCAP (HFC)
BAF
CANF
CIFC
Fivestar
HomeFirst
IIFL Finance
LTHF
LICHF
MMFSL
MASFIN
MGFL
Muthoot
PIEL
PNBHF
PFL
REPCO
SHFL
CREDAG
FUSION
SPANDANA
PFC
REC
Total
2QFY25
184
1,147
232
3,739
366
1,646
109
112
670
930
2,946
1,125
110
457
902
747
747
284
140
2,430
251
116
105
4,934
5,461
29,891
Advances/AUM
YoY (%)
20.1
22.7
50.5
28.8
9.7
32.5
32.2
34.2
-8.4
18.1
6.0
20.0
21.8
17.4
30.7
11.6
10.8
40.5
8.1
19.9
11.8
15.4
7.7
9.8
15.1
16.52
QoQ (%)
3.1
6.9
13.9
5.6
2.9
5.9
5.6
7.2
-3.8
4.8
2.1
5.8
6.1
1.7
7.0
5.8
3.0
5.3
1.9
4.1
-4.5
-5.1
-10.1
3.9
3.1
3.9
Source: MOFSL, Company
Exhibit 89: Asset quality snapshot
Asset quality
(%)
AAVAS
ABCAP (NBFC)
ABCAP (HFC)
BAF
CANF
CIFC
HomeFirst
IIFL Finance
LTFH
LICHF
MMFSL
MASFIN
MGFL
Muthoot
PIEL
PNBHF
PFL
REPCO
SFL
CREDAG
FUSION
SPANDANA
PFC
REC
As on 1QFY25 (%)
GNPA
NNPA
1.0
0.7
2.5
1.3
1.6
NA
0.86
0.4
0.9
0.5
2.6
1.5
1.7
1.3
2.3
1.1
3.1
0.8
3.3
1.7
3.6
1.5
2.5
1.5
2.0
1.7
4.0
NA
2.4
1.0
1.4
0.9
0.7
0.3
4.3
1.7
5.4
2.7
1.5
0.5
5.5
1.3
2.6
0.5
3.4
0.9
2.6
0.8
PCR
28.8
49.5
NA
56.1
47.0
45.5
27.5
51.3
75.3
49.6
59.8
39.1
NA
NA
60.0
32.5
52.4
61.8
51.1
69.2
78.1
79.8
74.4
68.5
As on 2QFY25 (%)
GNPA
NNPA
1.1
0.8
2.5
1.4
1.3
NA
1.06
0.5
0.9
0.5
2.8
1.6
1.7
1.3
2.4
1.1
3.2
1.0
3.1
1.6
3.8
1.6
2.6
1.6
2.4
2.1
4.3
NA
2.8
1.4
1.2
0.8
2.1
0.3
4.0
1.6
5.3
2.6
2.4
0.8
9.4
2.4
4.9
1.1
2.7
0.7
2.5
0.9
PCR
28.7
46.0
NA
57.1
46.0
44.5
26.7
55.5
70.6
49.3
59.5
39.1
NA
NA
53.5
32.7
84.5
60.7
51.7
69.5
76.2
79.7
73.6
65.1
QoQ change (bp)
GNPA
NNPA
PCR
7
5
-16
-1
8
-350
-30
-
-
20
8
106
-3
-2
-100
21
14
-100
-1
0
-78
15
-3
420
5
17
-475
-24
-11
-33
27
13
-31
3
2
-5
40
40
-
33
-
-
37
35
-649
-11
-8
27
143
1
3205
-30
-8
-108
-7
-7
55
98
31
31
395
113
-194
227
52
-13
-67
-15
-81
-8
6
-335
Source: MOFSL, Company
November 2024
43
 Motilal Oswal Financial Services
India Strategy | Review 2QFY25
FINANCIALS – NON-LENDING: Stable momentum for capital market players; elevated claims hurt
profitability of general insurers; subdued VNB margins for life insurers
Capital market activity continues to rise:
Strong momentum in overall volumes remained intact in 2QFY25,
backed by a higher number of trading days. However, cash ADTO witnessed a declining trajectory from the
Jun’24 peak. Demat account addition was at an all-time high of 13.1m, while the number of NSE active clients
increased to 47.9m. The increase in orders due to higher trading days, along with growth across various pockets,
led to 46% YoY growth in Angel One’s revenue. The company demonstrated cost efficiency despite strong client
addition, but investments in headcount for new non-cyclical business segments impacted margins.
F&O surge benefitting exchanges:
Growth momentum was stable in option volumes during the quarter,
improvement in the premium-to-notional turnover ratio and market share gains benefitted BSE’s revenue and
profitability. Star MF continued to report a healthy performance as volumes jumped 70% YoY and revenue
surged 2x. The surge in commodity volumes (110% YoY growth in total ADT), driven by rising participation and
increase in turnover/clients, led to strong revenue growth for MCX. Options ADT surged 125% YoY to INR1.9t,
largely propelled by 194% YoY growth in bullion contracts and 117% YoY growth in energy contracts. Futures
ADT rose 44% YoY to INR269b, fueled by 59%/61%/7% YoY growth in bullion/base metals/ energy contracts.
Robust flow trajectory in asset management:
AAUM of the MF Industry reached INR68t at the end of 2QFY25,
up 10.9% QoQ. Total equity AAUM grew 13.2% QoQ. Net inflows stood at INR2.26t vs. INR3.06t in 1QFY25. SIP
flows continued to gain traction, with INR714b flows in 2QFY25 vs. INR625b in 1QFY25. The consistent growth
momentum in the industry resulted in 55% YoY growth in CAMS’ PAT, supported by a YoY increase in the share
of non-MF business and an improving mix of equity AUM in the total MF AUM. 360ONE continued to witness
strong ARR flows but a sequential decline in ARR yields due to broker code changes, high cost of borrowing and
lower carry income. The company’s plan to diversify across client segments (mass affluent) and geography
(lower-tier cities) is gaining traction, and its global platform has also seen green shoots.
VNB margins hit by product mix changes:
Life insurance players continued to report healthy premium growth.
HDFC Life/Ipru Life/Max Financial witnessed better-than-industry growth of 27%/21%/31% YoY, while SBI Life
saw tepid growth of 3% YoY. However, VNB margins for IPRU/SBILIFE/HDFCLIFE/MAXF contracted 460bp/160bp/
190bp/160bp YoY due to a rising share of ULIPs and the delay in re-aligning non-par prices with a decline in bond
yields. LIC reported APE growth of 26% YoY and VNB margins expansion of 260bp YoY to 17.9%.
Spike in NATCAT claims impacted profitability:
General insurance firms posted modest growth in premiums,
impacted by low automobile sales, while demand for health insurance remained steady. Commercial business
line is growing in line with economic growth. Profitability of insurers was largely impacted by a rise in NATCAT
claims and prolonged monsoon keeping the health loss ratios elevated, while motor segment loss ratios were
steady. For Star Health, the spike in loss ratio due to increasing share of group segment, heightened medical
inflation and elevated claims led to an increase in the combined ratio to 103%. ICICI Lombard’s combined ratio
was impacted by elevated opex. ICICIGI/STARHEAL posted YoY NEP growth of 17%/16% and PAT growth of 20%/
decline of 11% YoY.
Valuation and view:
Capital market participants are benefitting from rising volumes, strong demat additions and
positive market sentiments. We believe that the impending F&O regulations will affect the profitability of players
like Angel One and BSE in the short term. However, a gradual recovery in volumes, Angel One’s strategy to diversify
from core broking revenues, and improvement in BSE’s premium-to-notional turnover ratio will lead to steady
earnings growth in the long run. New product launches and rise in active clients will boost revenue and profitability
of MCX over the medium term. Strong growth in mutual fund flows and steady trend of financialization of savings
will benefit CAMS and 360ONE. General insurers have witnessed modest premium growth in the recent quarters and
we expect growth to recover with automobile sales recovery and continued popularity of health insurance. IRDAI’s
new surrender value regulations w.e.f. Oct’24 will lead to changes in product and commission construct, impacting
growth and profitability in 2HFY25 for life insurers.
Our top picks are ANGELONE, 360 ONE, HDFCLIFE and SBILIFE.
Surprises:
BSE, CAMS
Misses:
STARHEALH, IPRU LIFE
November 2024
44
 Motilal Oswal Financial Services
India Strategy | Review 2QFY25
Guidance highlights:
360ONE:
On the new businesses front, the HNI segment is live and gaining traction, while the global business
completed the Phase 1 of the platform and reported new flows of USD160m. More recruitment and expansion
to new cities will start in Apr’25. MF offerings are growing due to strong fund performance and strengthened
salesforce. 360ONE is deepening its channel presence in the domestic market through MFDs. It plans to reduce
dividend payout from 65-80% currently to 25-40% (mainly from wealth and AMC segments). The management
maintains the flow guidance of INR250-300b as the platform gains traction and the C/I ratio to come down to
46-47% by 4QFY25 or early FY26 from the late 40s currently.
ANGELONE:
Management anticipates a hit of 13-14% in broking revenue owing to volumes decline in the near
term, which can be mitigated through a number of levers, including the pricing action. However, if the current
client addition growth rate continues, the impact will be negligible. To drive brand awareness, the company
continues to invest in marketing, including IPL sponsorships. ANGELONE is actively diversifying beyond broking,
and has taken constructive steps to grow in various areas. While the cost-to-income ratio is currently elevated
due to new business investments, it is expected to stabilize as these operations ramp up.
BSE:
Under the True-to-Label charges regulation, BSE raised the transaction fee for options contracts to
INR3,250 per crore, while for equity cash segment fee remains unchanged (on flat basis since Dec’22). The lot
sizes have increased to 20 for Sensex, 30 for Bankex and 60 for Sensex 50. BSE will continue with Sensex
Derivatives as weekly expiry and shift Bankex and Sensex 50 to monthly contracts. BSE faces challenges with
differential regulatory and clearing fees and has requested regulatory reconsideration. Any relief would benefit
BSE.
CAMS:
The company witnessed the fastest quarterly growth in overall AUM, adding INR4.9t in 2QFY25 to INR45t
as of Sept’24 (a historic high in AUM accretion). Non-MF revenue share stood at ~12.9% of total revenue (in line
with the guidance of 2% increase in share every year). Costs are largely expected to be stable, except variable
portion, which is rising with revenue growth. Management forecasts EBITDA margins of ~47-47.5% in FY25 from
46.6% currently.
MCX:
Key growth drivers include new product launches (futures & options), continued volatility in commodity
prices amid global uncertainties, and sustained growth momentum in retail participation in the options market.
MCX introduced single-tier transaction charge to adhere to true-to-label regulations. This has effectively reduced
the charges for a vast majority of clients.
ICICIGI:
It maintains a combined ratio guidance of 101.5% for FY25. Loss ratio guidance for Motor OD/Motor
TP/Overall stood at 60-65%/65-70%/65-67%, whereas for the health segment, the retail/group segment at
70%/94-95%. The Retail health segment’s market share grew to 3.5% from 2.1%, driven by the ‘Elevate’ product.
The company remains cautious about the group health employer-employee segment due to increased
competitive intensity.
STARHEAL:
Claims ratio increased owing to 1) seasonal impact due to extended monsoons, 2) 10% rise in
severity, 3) 6% increase in frequency, 4) higher reinsurance business taken last year, and 4) rising share in the
group business. The company has reprised 10-12% of the product portfolio and plans to reprise 50-60% more
following the differential pricing method to manage the loss ratios. The management guides for overall growth
at 18% for FY25 with GWP of INR300b and PAT of INR25b by FY28. While the company aims for a long-term
combined ratio of 95-96%, medical inflation poses a short-term challenge.
HDFCLIFE:
An impact of 100bp is expected on VNB margins from the new surrender charges regulations. The
company is renegotiating with channel partners to reduce the impact. It guides for 15-17% growth in VNB in
FY25. However, surrender regulations and the high popularity of ULIP will be an overhang on margins. It also
guides for 18-20% growth in APE for FY25. VNB margins declined to 24.6% (25.5% our est.) due to high ULIP
share in the product mix and repricing of non-par products.
IPRU:
The company expects a minimal impact of new surrender charge regulation and is in discussion with the
channel partners to offset the impact through various models, including commission claw-back, reduction of
commission in certain products, etc. Management will focus on the growth of absolute VNB and product mix,
November 2024
45
 Motilal Oswal Financial Services
India Strategy | Review 2QFY25
while VNB margins being the end result. VNB margins declined 460bp YoY to 23.4%, mainly due to 1) a shift in
the product mix toward ULIPs, and 2) delays in IRR change to accommodate declining G-sec yields.
LIC:
In order to ensure no adverse impact of new regulations on margins, LIC has relaunched 32 out of 54
products and many have undergone revisions in premium rates, along with design changes. Redesigning
products is done with a mindset of 1) aligning with regulator expectations, 2) maintaining investor profitability
and 3) keeping benefits of intermediary intact. There has been no change in commission rates, policies have
been modified to link rewards to better persistency. Persistency improvement has been mixed across cohorts
with respect to policy and premium. The company is incentivizing the sale of higher-ticket size and longer-
duration policies to improve persistency.
SBILIFE:
No change is made to the commission structure due to the minimal impact of new surrender guidelines
as the product mix is skewed toward ULIP. It guides for VNB growth to be in the range of 12-15% and VNB
margin at ~26-27% for FY25. Regarding the product mix, the management has guided for Non-par, Protection
and Par products to constitute ~40% and ULIP to constitute ~60% of the overall product mix. The management
expects protection premiums to report strong growth on account of the recent launch of two new products,
which will boost margins.
Revenue
YoY (%)
48
45
25
EBITDA
YoY (%)
34
65
31
PAT
YoY (%)
32
16,058
37
146
-850
PAT
YoY (%)
23
25
PAT
YoY (%)
15
3
39
-11
-4
INR m
Broking/Wealth/RTA
ANGELONE
IIFLWAM
CAMS
Exchanges
BSE
MCX
General Insurance
ICICIGI
STARHEAL
Life Insurance
2QFY25
9,996
6,175
3,447
7,104
2,729
2QFY25
71,504
43,288
2QFY25
38,580
25,040
53,900
21,700
1,64,650
QoQ (%)
9
3
4
2QFY25
5,446
3,520
1,601
QoQ (%)
37
5
7
2QFY25
4,017
2,907
1,145
2,898
1,430
2QFY25
7,098
1,566
2QFY25
4,330
2,517
5,294
1,393
76,209
QoQ (%)
37
19
7
10
29
QoQ (%)
22
-51
QoQ (%)
-9
12
2
-11
-27
HDFCLIFE
IPRU
SBILIFE
MAXFIN
LIC
126
17
65
16
Gross Premium
YoY (%)
QoQ (%)
14
-10
16
25
APE
YoY (%)
QoQ (%)
27
35
21
28
3
48
31
49
26
42
3,214
127
13
1,724
-701
30
Underwriting Profit/(Loss)
2QFY25
YoY (%)
QoQ (%)
-1,216
NA
NA
-892
14
NA
VNB
2QFY25
YoY (%)
QoQ (%)
9,380
17
31
5,860
2
24
14,500
-3
49
5,120
23
102
29,410
47
83
HEALTHCARE: In-line 2Q; robust mid-teens YoY growth in EBITDA despite seasonal headwinds
Our coverage companies (excluding hospitals) reported in-line sales/EBITDA/PAT in 2QFY25. The profitability was
driven by: a) increased contribution from limited competition products, b) steady growth in chronic therapies, and
c) current higher inventory levels for raw materials at the industry-level benefitting formulators. This was partly
offset by the lower off-take of products in acute therapies due to an unfavorable season.
On an aggregate basis for the pharma segment, sales/EBITDA/PAT grew 10%/17%/15% YoY. EBITDA margins
expanded 150bp YoY for 2QFY25.
In the overall listed hospital space, Revenue/EBITDA grew 18%/20% YoY, led by an increase in volume growth (up
10.7% YoY) supported by the ARPOB growth (up 6% YoY). Meanwhile, occupancy was in line with that of 2QFY24
at ~65%. During the quarter, there was an addition of ~2940 operating beds in listed hospital spaces. From the
2QFY25 performance perspective, APHS/MAX were largely in line with our estimates while MEDANTA was above
our estimates. The performance was driven largely by the growth in volumes, while ARPOB growth was moderate
for the quarter.
Out of 24 companies, six reported a better-than-expected performance. GLAND/GSK/MEDANTA/LPC/MANKIND
specifically beat our earnings estimates by 5.1%/7.1%/19.3%/11.8%/9.1% for the quarter. 5 out of 20 companies
delivered a miss on estimates. ALPM/TRP/IPCA missed our estimates by 16.8%/11.3%/5.5% for the quarter.
November 2024
46
 Motilal Oswal Financial Services
India Strategy | Review 2QFY25
US sales
witnessed a robust performance, up 10.2% YoY (in cc terms) to USD2.4b, on an aggregate basis, for the
companies under our coverage. The YoY growth has been steady for five consecutive quarters now. Improved
segmental mix, increased niche launches, better traction in existing products, and lower price erosion in the
base portfolio resulted in healthy YoY growth in US generics for the quarter.
Among our coverage companies, ZYDUSLIF delivered the highest YoY growth of 28% in US sales, led by niche
product launches such as Mirabegron and volume expansion in the base business. SUNP delivered 20% YoY
growth in US sales, led by strong growth momentum in specialty products including Illumya, Cequa, and Winlevi.
g-revlimid also led the growth in the US market for SUNP. The DRRD US segment delivered 17% YoY growth on
account of the integration of the Mayne portfolio, new launches, and an increase in sales volumes, partially
offset by price erosion. However, ALKEM/TRP witnessed a 25%/6% YoY decline in US sales due to the lack of
approvals and price erosion in the base business.
On an overall basis, our coverage companies received approvals for 74 ANDAs (54 final approvals and 20
tentative approvals) in 2QFY25.
On an aggregate basis,
Domestic Formulation (DF)
exhibited YoY growth of 11% in 2QFY25 led by strong growth
in Chronic therapies offset by the lower offtake of acute therapy. Among therapies, Cardiac/GI/Anti-
diabetic/Derma delivered 11.6%/9.8%/9.1%/9.5% YoY growth, outperforming IPM (8% YoY growth). However,
Ophthal/Respiratory/Gynae underperformed IPM by 11.8%/5.3%/5.6%. Among our coverage companies,
LPC/DRRD/GNP delivered 18.8%/17.8%/14.3% YoY for 2QFY25. ERIS delivered 46.7% YoY growth, partly due to
acquisitions.
Among our coverage companies, nine companies have seen earnings upgrades while 12 have seen earnings
downgrades. The maximum upgrades in FY25/FY26/FY27 earnings were seen in LPC (15.4%/7.6%/7.4%), GLXO
(4.3%/5.2%/4.9%), ZYDUS (2.7%/4.3%/0%), and ALKEM (0.9%/2.5%/10.2%). Conversely, BIOS
(55.8%/48.1%/25.4%), ALPM (15.5%/8.1%/5.3%), GLAND (7.6%/10.1%/7%), and LAURUS (7.9%/4.8%/0%)
witnessed maximum downgrades in earnings estimates.
Top picks:
SUN, MEDANTA, IPCA
Surprises:
DIVI, GLAND, GSK, LPC, MANKIND, MEDANTA
Misses:
ALPM, IPCA
Guidance highlights
SUNP
has reduced its guidance for R&D spending to 7-8% from 8-10% earlier due to a delay in clinical trials in
FY25. The unfavorable court outcome has pushed off the launch of SUNP’s Deuruxolitinib in the US market.
SUNP is gaining traction in Ilumetric in China and expects it to be a meaningful product in the country.
DRRD
expects Abatacept to be launched in FY27. The company expects SG&A expenses to be ~27.5-28% of the
revenue for FY25. DRRD expects to launch b-Rituximab in Feb’25/1HFY26 for the EU/US market.
DIVI’s
DIVI guided for a capex of INR16b for FY25, which is higher than its earlier annual run rate. Production
from phase 1 of Unit 3 would start in Dec’24. Gadolinium-based compounds are currently under the qualification
phase.
CIPLA
has guided for 24.5%-25.5% EBITDA margin in FY25. CIPLA indicated US quarterly sales to moderate to
~USD220m in 3Q due to production modification at its partner’s site for Lanreotide.
BIOS
anticipates better growth outlook for 2HFY25, led by strong growth of Syngene, market share gain in the
key biosimilars, and the launch of GLP-1 in the UK. BIOS expects the generics business to witness recovery in 2H.
LPC
expects EBITDA margin to be 22-23% for FY25. It guided the US business to grow in double digits in FY25, led
by Predforte, gMyrbetriq, Tiotropium, and gProlensa. LPC looks forward to a GLP-1 opportunity in the emerging
markets (from CY26 onwards). It expects opportunities from Glucagon/Dalbavancin in 4QFY25/1QFY26.
ZYDUSLIF
reiterated its FY25 revenue growth guidance for high teens. Mirabegron remains an interesting
opportunity in 2HFY25. ZYDUSLIF guided for 8% R&D spending for the full year. ZYDUS is working closely with
the USFDA to implement Corrective and Preventive Action (CAPA) in order to resolve WL at its Jarod site.
APHS
indicated that ARPOB will witness 6-7% YoY growth going forward, led by a better case mix/ALOS. AHEL
plans to add ~1,600 beds across four hospitals - Gurugram, Hyderabad, Kolkata, and Pune - in FY26.
November 2024
47
 Motilal Oswal Financial Services
India Strategy | Review 2QFY25
LAURUS
maintained its outlook for FY25. It also guided an EBITDA margin of 20% for FY25. The crop protection
intermediate facility qualification is targeted for the end of FY25. LAURUS is on track to build a commercial
fermentation capacity at Vizag.
GLAND
maintained its guidance of mid-teens YoY growth in revenue (ExCenexi) for FY25. It guided ROW markets
to grow at a healthy rate for the year. Moreover, it guided positive EBITDA in 4QFY25 for the Cenexi business.
TRP
expects the current levels of gross margin (~76.5%) to sustain going forward. TRP has guided for 50-100bp
annual EBITDA margin expansion over the next three years, led by price hikes and operating leverage. The
company expects the R&D spend as a % of sales to remain ~5-5.5% for the year.
IPCA
guided revenue growth of 9-10% with EBITDA margins of 22% in FY25. For Unichem, IPCA guided revenue
of INR19b in FY25 with EBITDA margins of ~14-15% in FY25. IPCA expects six product launches in the US in FY25
(three products launched by Sep’24) and 6-7 products in FY26 via Unichem.
MAXHEALTH
expects ARPOB to grow 8-9% over the next 12M. MAXH plans to increase operational bed capacity
from 376 beds currently to 430 beds by end-FY25 and 480 beds in 2HFY26 in Jaypee hospitals, Noida. MAXH will
operationalize 140/141/150/268 beds in Lucknow/Dwarka/Nagpur/Nanvati by the end of FY25.
MEDANTA
has witnessed signs of recovery at the Lucknow hospital. It has also expanded its clinical capabilities
at this site. MEDANTA remains on track to begin the Noida hospital in 1QFY26. The O&M project to cater to
micro markets of Northwest and West Delhi would require a capex spend of INR6b.
Exhibit 91: DF sales grew 11.3% YoY in 2QFY25
17.2
14.0
11.6
12.3
5.1
(3.0) (3.4)
0.6 (0.2)
10.5
13.4
10.3
13.3
10.3
10.2
-2.7
9.4 8.2 8.2
8.0 7.9
5.4
8.8
DF sales growth YoY (%)
12.9
11.3
Exhibit 90: US sales grew 10.2% YoY in 2QFY25 (CC terms)
Growth YoY (%)
27.2
Ex-APHS/MAXHEALT/MEDANTA
Source: MOFSL, Company
Ex-APHS/MAXHEALT/MEDANTA
Source: MOFSL, Company
Exhibit 92: Alkem tops amongst peers in new drug
introduction over last eight quarters
79 77
69
53
42
33
64
53
42
New Launches
68
46
69
Exhibit 93:
54 Final ANDAs approved on an aggregate basis
for our coverage universe in 2QFY25
Approval
8
7
7
5
4
4
4
3
2
2
1
5
0
4
1
0
2
2
2
2
2
1
2
1
0
0
1
0
1
0
1
0 00
Tentative Approval
24
11
19 19
Source: MOFSL, Company
November 2024
48
 Motilal Oswal Financial Services
India Strategy | Review 2QFY25
Exhibit 94: Aggregate EBITDA up 17.3% YoY to INR193b in 2QFY25 for the pharma universe
Aggregate EBITDA (INRb)
250
200
Aggregate EBITDA Growth (%)
37.0
20.9
16.7
45.0
31.4
35.0
22.2
150
114
3.9
133
1.8
127
3QFY22
3.3
117
4QFY22
(12.6)
1QFY23
3.9
136
2QFY23
17.3
25.0
8.7
10.8
15.0
5.0
100
50
(5 .0)
138
3QFY23
129
4QFY23
156
1QFY24
164
2QFY24
161
3QFY24
170
4QFY24
190
1QFY25
193
(1 5.0)
0
2QFY22
2QFY25
Exhibit 95: Aggregate PAT up 15% YoY in 2QFY25 for pharma companies under coverage
140
Aggregate PAT (INRb)
Aggregate PAT Growth (%)
31.9
20.5
21.6
49.6
29.3
15.0
60.0
50.0
120
40.0
100
30.0
80
10.8
60
1.2
40
20
5.2
70
86
(0.9)
(9.2)
(0.1)
73
4QFY23
92
1QFY24
104
2QFY24
98
3QFY24
109
4QFY24
119
1QFY25
20.0
10.0
-
89
0
81
3QFY22
73
4QFY22
(16.1)
1QFY23
2QFY23
81
3QFY23
120
2QFY25
(1 0.0)
(2 0.0)
2QFY22
Ex-APHS/MAXHEALT/MEDANTA/SOLARA
Source: MOFSL, Company
Inspection Facility
OSD - Panalev
OSD - Panalev
FD - Gagillapur
Ahmedabad
Ahmedabad
(FTO-7 & FTO-9) in Duvvada, Visakhapatnam
Unit II - API facility in Telangana
Eugia Steriles Pvt Ltd
Unit III - Eugia Pharma Specialties Ltd.
Unit II - Eugia Pharma Specialties Ltd.
Insulins - Johor Bahru, Malaysia
API facility (Site 2) - Bengaluru
API facility (Site 1) - Bengaluru
Biocon Biologics - Bengaluru
API facility (Site 5) - Andhra Pradesh
API facility (Site 6) - Andhra Pradesh
Injectable - Jarod, Vadodara
Kurkumbh
Virgonagar, Bengaluru
Unit II - Vishakhapatnam
Pashamylaram Facility, Hyderabad
Dundigal Facility, Hyderabad
Chhatrapati Sambhaji Nagar (Aurangabad), India
Pithampur Unit-1 API and finished product
Dabhasa Facility
Dadra facility
Goa formulation facility
API manufacturing facility at Hyderabad
Outcome
Observations
EIR
0
Form 483
0
Form 483
6
EIR
0
Form 483
0
EIR
0
Form 483
10
EIR
0
OAI - Warning letter
OAI
Form 483
5
Form 483
4
Form 483
3
EIR
VAI
EIR
VAI
EIR
0
OAI - Warning letter
VAI
Form 483
8
Form 483
1
Form 483
3
Form 483
2
No observation
0
Form 483
3
EIR
NA
Warning letter
NA
Form 483
5
No observation
0
Source: MOFSL, Company
Exhibit 96: USFDA inspection history of our coverage companies for the quarter
Company
Alembic
Granules
Piramal
Dr. Reddy
Aurobindo
Inspection Date
Sep-24
Jul-24
Jun-24
Sep-24
Jul-24
Aug-24
Sep-24
Sep-24
Aug-24
May-24
Sep-24
Sep-24
Sep-24
Jul-24
Jun-24
Jun-24
Apr-24
Jul-24
Nov-24
Jul-24
Aug-24
Jul-24
Sep-24
Sep-24
Jul-24
Jul-24
Jul-24
Sep-24
Biocon
Zydus Lifesciences
Cipla
Divis Labs
Gland Pharma
Glenmark
Lupin
Sun Pharma
Unichem
Laurus Labs
November 2024
49
 Motilal Oswal Financial Services
India Strategy | Review 2QFY25
Exhibit 97: Performance of top therapies in Sept’24 - (INR b)
Company
IPM
Cardiac
Anti-Infectives
Gastro Intestinal
Anti Diabetic
Respiratory
Pain / Analgesics
Vitamins/Minerals/Nutrients
Derma
Neuro / Cns
Gynaec.
Antineoplast/Immunomodulator
Ophthal / Otologicals
Urology
Hormones
MAT
Sept'24
value
2,253
286
250
241
199
180
179
176
156
135
111
59
43
49
35
One
Market
YoY growth (%) in the last eight quarters
Growth
month
share
(%)
(%)
Dec'22 Mar'23 Jun'23 Sep'23 Dec'23 Mar'24 Jun'24 Sep'24 Sep'24
100.0
7.7
7.4
3.6
9.2
7.2
8.3
5.7
8.9
8.0
5.1
12.7
11.1
5.3
7.1
10.6
9.9
9.0
11.3
12.4
11.6
9.7
11.1
4.9
25.3
6.2
10.6
1.1
8.8
-2.9
6.5
7.0
-0.3
10.7
9.1
-10.1 -1.9
5.5
8.6
9.4
5.5
11.4
9.8
5.6
8.9
7.4
-0.2
0.5
6.6
4.8
5.7
7.1
7.6
9.1
7.7
8.0
1.8
56.5 30.2
11.6
0.0
5.4
-2.7
1.7
2.7
-1.1
8.0
7.6
6.7
-1.5
11.1
7.4
8.3
5.9
8.4
7.6
4.6
7.8
8.0
-2.7
-4.5
6.5
7.4
8.6
6.6
8.8
7.9
4.9
6.9
7.7
10.3 -3.0
8.5
5.5
3.5
8.1
9.6
9.5
8.3
6.0
8.6
3.1
2.9
9.3
8.2
8.8
8.0
8.3
9.2
7.4
4.9
5.0
-6.4
-1.6
5.5
8.3
6.7
5.1
5.8
2.4
1.2
2.6
19.1
5.0
11.0
21.7
25.6
24.3
21.6
20.9
11.0
10.1
1.9
1.4
2.8
2.1
9.9
19.9
0.9
4.0
5.2
-3.8
8.0
2.2
13.3
4.7
5.4
14.8
14.3
12.4
14.0
13.7
13.1
11.5
1.5
5.7
14.8 10.2
11.7
8.0
6.1
3.2
8.5
4.9
2.7
Source: IQVIA, MOFSL
INFRASTRUCTURE: Heavy monsoons hurt execution; sluggish project awarding in 1HFY25
Execution declines YoY amid heavy rainfall:
Infrastructure companies in our coverage universe (excluding IRB)
reported 21% YoY revenue decline in 2QFY25, primarily because of heavy and extended rainfall, delays in land
acquisition and subsequent delays in appointed date (AD) for several projects. KNR/GRIL revenue declined 9%/28%
YoY. GRINFRA faced a slowdown in execution primarily due to fewer projects under execution. NHAI awarding
was sluggish in 1HFY25 and both the companies, KNR and GRIL, are exploring non-road infrastructure opportunities
like power transmission projects, water projects and solar EPC projects in order to diversify their order book. KNR
and GRIL have guided for flat growth or a decline in FY25. Execution is likely to improve in 2HFY25 onward across
our coverage companies.
Awarding activity remains subdued in 1HFY25; pipeline robust:
Awarding activity by NHAI has been subdued
with ~310km of projects awarded in YTDFY25 vs. a target of ~5,000km in FY25. While there is a huge tender
pipeline, order inflows could kick-in materially only in 4QFY25. GRIL and KNR have guided for order inflow
targets of INR200b and INR60-80b, respectively, in FY25. Amid sluggishness in awarding activity by NHAI, both
the companies will focus on diversification toward non-road segments.
Lower execution keeps margins in check:
Our coverage companies reported a 140bp YoY drop in EBITDA margin
due to muted execution despite subdued input costs in 2Q. Steel and aluminum prices have corrected ~30% from
their highs in Apr’22. Cement prices have decreased ~5% from their highs in Oct’23.
Focus on asset monetization:
NHAI is focusing on asset monetization to generate funds beyond budgetary
allocations. NHAI sets up an asset monetization cell and has a monetization target of INR540b in FY25. The cell
will advise on planning, conduct market analysis, and identify high-revenue assets. In FY24, NHAI exceeded its
target by awarding four ToT bundles worth INR159b. For FY25, NHAI plans to offer a dozen bundles for private
bids, aiming to achieve significantly higher monetization than the INR400b reached in FY24.
Top picks:
Awarding activities by NHAI and execution have been muted and are expected to improve only in
2HFY25. Companies with decent order backlogs, a solid financial position, and involvement in multiple segments
are well positioned to benefit in the near to medium term. Our preferred choice in the space is KNR.
November 2024
50
 Motilal Oswal Financial Services
India Strategy | Review 2QFY25
Exhibit 98: Revenue down 19% YoY for our coverage
universe
Infra aggregate sales (INR b)
31.7
26.2
27.3
33.3
33.3
Exhibit 99: Gross margin stagnant on YoY basis
Infra aggregate gross margin (%)
28.8
27.1
26.5
31.2
27.6
26.3
25.9
26.2
28.0
25.2
27.1
27.2
19.8
Exhibit 100: EBITDA contracts on YoY and QoQ basis
Infra aggregate EBITDA margin (%)
17.1
15.9
15.8
15.8
14.3
13.8
15.1
14.1
12.9
Exhibit 101: APAT margins higher on YoY basis
Infra aggregate APAT margin (%)
13.3
10.4
9.2
10.1
10.1
8.9
10.7
8.7
10.4
Note: Data in charts above is for our coverage universe excluding IRB
LOGISTICS: Volumes remain muted amid slowdown in consumption; port operators continue to gain
market share
Logistics activity remains muted; private port operators gain market share:
Logistics activity remained subdued
due to challenges like slowdown in consumption, market fluctuations, and rising labor costs. Express logistics
saw volume decline owing to competitive pressure and heavy rainfall across the country, leading to lower
margins. Logistics companies (excluding APSEZ and JSWINFRA) achieved 9% YoY revenue growth. Organized
freight operators expect better results in 2HFY25 with the onset of the festive season. Multimodal logistics
outperformed pure freight and express logistics. APSEZ and JSWINFRA reported 10% and 16% YoY growth in
cargo volumes, respectively, with market share gains driven by efficiency and expansion. In 1HFY25, APSEZ
managed ~27% of the country’s total cargo and ~45% of container cargo. With volume ramp-up at recently
acquired ports/terminals, volumes are expected to be strong ahead for APSEZ and JSWINFRA.
Margins improve QoQ due to price hikes:
Gross margin for our coverage universe, barring APSEZ and JSWINFRA,
stood at 30.2% in 2QFY25 (down 30bp YoY and up 130bp QoQ). Though margins improved QoQ, operating
expenses such as high fuel prices and high toll charges remained high. EBITDA margin for our coverage universe,
excluding APSEZ and JSWINFRA, increased 140bp YoY and 210bp QoQ to 14.1%. APSEZ’s margins stood at 61.8%
(up 340bp YoY and 80bp QoQ) and JSWINFRA’s margins was 52% (down 130bp YoY and up 100bp QoQ).
Organized players with pan-India network and technological advantage to gain higher market share:
The
introduction of GST, e-way bills, and reduced e-invoicing turnover limits have driven businesses to partner with
organized logistics providers. Express companies are expanding their infrastructure and digitalizing operations.
This positions them to capture higher volumes. The government's port privatization efforts offer opportunities,
with APSEZ and JSWINFRA well-placed to benefit due to their strong balance sheets.
Top picks:
APSEZ is our preferred choice in this space.
Guidance
APSEZ:
In FY25, APSEZ expects cargo volumes of 460-480mmt, revenue of INR290-310b, EBITDA of INR170-180b,
and a net debt-to-EBITDA ratio of 2.2-2.5x. It plans a capex of INR115b, primarily for ports, logistics, and
renewables, including 1,000MW of solar and wind power with imported panels from China.
November 2024
51
 Motilal Oswal Financial Services
India Strategy | Review 2QFY25
JSWINFRA:
For FY25, volume growth is expected at 10% YoY, with capacity utilization of 65-70%. Long-term
growth would be supported by ongoing capex aimed at increasing its capacity to 400mmt by FY30. It has already
spent INR4b on projects in 1HFY25, keeping cumulative expansion on track to achieve the 288mmt capacity
target by FY28. During the quarter, the effective tax rate rose to ~25% due to reduced ATIA benefits and full
taxation on forex gains of INR1.6b. The effective tax rate for FY25 will be ~25%.
VRLL:
Recent price hike will support margins ahead while volume growth remains in mid-single digits. Good
monsoon and a stronger rural economy should boost volume growth for the remainder of FY25, particularly for
textile and agro commodities, which account for ~40% of total tonnage.
TRPC:
In FY25, TRPC expects revenue and PAT growth of 10-15% with marginal margin improvement, driven by
the supply chain and freight businesses, which will be supported by growth in the auto and infrastructure
sectors. During 2QFY25, joint ventures performed well, with Concord achieving ~13% YoY revenue growth, the
cold chain business growing ~35% despite profitability challenges from new truck depreciation and interest, and
Transystem registering ~46% YoY revenue growth. For FY25, total capex is projected at ~INR3.8b.
BDE:
As overall demand improves, a further pickup in volumes is anticipated in 2HFY25. A price hike will be
implemented in Jan’25 based on demand conditions, with no margin impact expected from hub expansions. The
management anticipates a healthy demand outlook will enhance profitability in the coming quarters. PBT
margins are expected to remain in the 7-8% range going forward.
CCRI:
In FY25, EXIM volume is projected to grow by 15% and domestic volume by 25%, leading to an overall
volume growth of 18-20%. Margins are expected to be around 25%. The rail coefficient is anticipated to increase
due to rising rice exports, softening ocean freight rates, and the commissioning of the DFC at Nava Sheva by
Mar’25. Domestic volume growth will be driven by new bulk cement initiatives, a long-term shipping line tie-up
in Sep’24, double stacking at Nava Sheva, and partnerships with major companies like Jindal, Tata, and Reliance
for end-to-end logistics. The First Mile Last Mile (FMLM) mix, currently at 25% of volumes, is targeted to reach
50% in FY25 and 85% in FY26, with FMLM margins around 25%.
MAHLOG:
MLL targets revenue of INR100b and RoE of 18% by FY26. It is focusing on mid-teens growth in the
3PL business to generate INR65b in revenue and rapidly expand its network services. Management is cautiously
optimistic about 3QFY25, expecting the festive season to boost demand in personal care and consumer
durables. Growth will be led by automotive and recovery in FMCG. Strength in the telecom sector owing to tariff
hikes and 5G investments, along with strong quick commerce and grocery segments, supports 15-18% projected
growth despite challenges in the express business.
TCIE:
Weak volume growth, particularly from MSME customers, and higher costs led to a weak performance in 2Q.
TCIE expects mid-single digit volume growth in 2HFY25 and 15% in FY26, with margins normalizing at 14%+ as
volumes rise. Management projects 22-25% revenue contribution from new value-added services by FY25 and
plans to establish 7-8 fully automated centers by FY26, each requiring around INR500m in capex.
Exhibit 102: Sales improved 9% YoY for our Coverage
Universe
Logistics aggregate YoY sales growth (%)
30.8
25.2
10.1 8.8
14.4
Exhibit 103: Margins improved on QoQ basis
MOSL universe Logistics Gross margin (%)
33.1
32.7
10.0
8.4
-0.3
6.0 6.7
9.6 9.2 9.0
33.2
30.1
31.2
29.5
30.9
30.5
29.3
28.9
30.5
29.5
30.2
November 2024
52
 Motilal Oswal Financial Services
India Strategy | Review 2QFY25
Exhibit 104: EBITDA margin improved due to price hikes and marginal pick up in volumes with onset of festive season
16.4
16.3
MOSL universe Logistics EBITDA margin (%)
15.9
15.6
14.9
13.9
13.6
12.7
13.9
14.1
13.3
13.0
12.0
Note: Data in charts above is for our coverage universe excluding APSEZ& JSWINFRA
Source: Company, MOFSL
METALS: Weak operating performance due to weak NSR; muted input costs cushion margin contraction
Volume remains subdued across the board
Ferrous:
The
companies within our coverage universe reported a sales volume decline of 3% YoY (volumes were flat
QoQ). Prices for flat steel were primarily hit by high imports, while muted construction activities led by the
monsoons hurt demand and prices for long steel. Companies expect demand and prices for long steel prices to
rebound with rising construction activities in 2HFY25, whereas flat steel prices would remain under pressure due to
elevated imports and higher supply from the domestic players.
Non-Ferrous:
HNDL/NACL’s domestic aluminum volumes declined 2-4% YoY and copper volumes for HNDL declined
13% YoY and 2% QoQ. HNDL’s international aluminum business (Novelis) saw flat volume during the quarter, led by
muted demand and production interruptions in the Sierre plant. Vedanta posted 3% YoY (+2% QoQ) volume growth
for aluminum business and domestic zinc business (HZ) saw a volume growth of 7% YoY, aided by the lead mode at
pyro plant operations during the quarter.
Mining:
COAL’s sales (dispatches) decline by 3% YoY and 15% QoQ to 168mt led by muted mining activity due to
monsoons, while NMDC’s sales were up 4% YoY to 9.9mt; however, sales declined 1% sequentially.
Ferrous ASPs plunge QoQ; non-ferrous benefits from favorable pricing:
Aggregate revenue for the ferrous
companies under our coverage declined 9% YoY and 5% QoQ, due to weak NSR. The realization decline was
between 4-9% YoY and 3-7% QoQ (excluding JSPL, it was flat YoY). The weakness in ferrous pricing, especially
flats, was due to the higher imports. Aggregate revenue for non-ferrous companies increased 10% YoY and 4%
QoQ fueled by favorable pricing during the quarter. HNDL reported revenue growth of 7% YoY and 2% QoQ, and
HZ/VEDL revenue grew by 22/10% YoY and 2/5% QoQ in 2QFY25.
Ferrous’ QoQ EBITDA/t dragged by weak ASP; non-ferrous delivers strong growth:
a) Ferrous:
Aggregate
EBITDA for our coverage companies declined 13% YoY and 16% QoQ in 2QFY25, owing to weak NSR. Tata Steel
reported an EBITDA/t of INR7,434/t (down 22% YoY and 20% QoQ) as the operating losses from EU operations
widen with weak NSR. For JSTL, the EBITDA/t was INR8,869/t (down 29% YoY and 2% QoQ).
b) Non-ferrous:
EBITDA for non-ferrous companies increased by ~47% YoY and 5% QoQ on account of strong pricing and muted
costs during the quarter. The biggest improvement was visible in NACL, which benefited from alumina sales.
Weak operating profit dents PAT for ferrous companies:
Aggregate APAT for ferrous company declined 72%
YoY and 6% QoQ in 2QFY25, due to weak operating performance. However, non-ferrous companies’ aggregate
APAT jumped 133% YoY and 7% QoQ during the quarter.
Capacity enhancement:
a) Ferrous:
TATA is doubling its domestic crude steel capacity to 40mt from 21mt. The 2BF
at Kalinganagar was commissioned and other associate facilities will be commissioned in the coming years (already
spent ~INR190b and INR70b+ of capex is pending). Similarly, JSP is doubling its finished steel capacity to 13.75mt by
FY26 (with a capex INR310b) from 7.25mt. JSP received all the approvals for Utkal B1 mines and is in an advanced
November 2024
53
 Motilal Oswal Financial Services
India Strategy | Review 2QFY25
stage of opening by 4QFY25. Utkal B2 is under clearance and is likely to open in FY25. The 5MTPA Vijayanagar
integrated facility (Sinter and BF) got commissioned, and SMS is under commissioning. Management expects to
ramp up the capacity by the end of 4QFY25 (earlier guidance by 3QFY25). SAIL plans to increase its capacity from
20mtpa of crude steel to 35mtpa by the end of FY31. SAIL plans to set up a 4.1mt greenfield flat steel facility at
IISCO, predominantly focused on HRC and CRC facilities afterwards.
b) Non-ferrous:
Novelis’s (HNDL) Bay Minette facility is expected to be completed in 2HCY26 and would take 18-24
months to fully ramp up. VEDL commissioned train-I at Lanjigarh refinery of 1.5MTPA and expects to fully ramp up
by Dec’24, whereas it is on track to commission train 2 by Jan-Mar’25.
Surprises:
TATA, HNDL and NACL
Top picks:
COAL and JSTL
Guidance highlights:
TATA:
Management expects NSR for domestic operations to decline INR2,000/t QoQ in 3QFY25 due to low-priced
contracts (six-month) with an auto manufacturer. ASP for the UK operation would fall by GBP45-55/t QoQ, whereas
the Netherlands could see GBP70/t QoQ reduction during 3QFY25. Coal costs on a consumption basis to dip by
USD20/t QoQ for the India operations and in the Netherlands, costs are anticipated to be USD10/t QoQ lower in
3QFY25. Management is confident of reducing the UK fixed costs (employee/other costs) by GBP100/t from 3Q/
4QFY25 until 1QFY26 (Jun’25).
JSTL:
Management foresees the coking coal costs to be USD20-25/t lower QoQ for 3QFY25 and sounded cautious
over iron ore price hikes by NMDC. JSTL believes that iron ore prices will moderate in near future and will be in line
with global iron ore prices. Management aims to increase the captive iron share to offset the high-price impact. The
company revised its capex guidance from INR200b to INR170b, primarily due to the transfer of slurry pipeline to JSW
Infra and Vijaynagar planned shutdown shifted to 1HFY26.
JSP:
Coking coal costs expected to be USD20-25/t lower in 3QFY25 and earnings are likely to be better in 2HFY25 as
compared to 1HFY25, driven by better volumes and realization. The company implemented a price hike of INR1,000-
2,000/t across products during 3Q, and indicated that the prices are holding up on account of healthy demand
following the festive season. Further, it guided iron ore costs to correct; otherwise the spot spreads may compress.
SAIL:
For 3QFY25, management expects coking coal costs to decline further by INR2,000/t QoQ and expects NSR to
be INR1,000-1500/t lower QoQ as spot prices continue to remain muted. High imports dragged down the flat prices
in domestic markets and will remain under pressure. Long steel prices would rebound as construction activities and
Government infra spending picks up.
HNDL:
Aluminum CoP is expected to increase marginally by 1-1.5% QoQ in 3QFY25 due to higher coal auction
premiums. Management expects to clock an EBITDA run rate of INR6b per quarter in copper business. The company
has hedged 30% of the commodity at USD2517/t, while an additional 15% is hedged at USD2262/t, with a ceiling
price of USD2542/t. Bauxite supply disruption in Guinea and Alcova pushed alumina prices higher to USD700/t, and
the high-cost alumina impact will start reflecting from 3Q. Both (aluminum and copper) announced smelters are
brownfield and require a capex outlay of USD1b each and ~USD4-5b of capex for the next 3.0-3.5 years.
VEDL:
It expects coal costs to be USD50-60 lower post-monsoons, due to better coal grades obtained through MCL
e-auctions with nil premiums. Management anticipates achieving 230kt of total MIC production for FY25 in its Zinc
International business. Alumina cost inflation turned to be a potential headwind in 3QFY25, but management
believes it will be offset by lower costs and the Lanjigarh ramp up.
November 2024
54
 Motilal Oswal Financial Services
India Strategy | Review 2QFY25
Exhibit 105: Domestic spot steel spreads (USD/t) contracted
and currently below the LTA
Domestic HRC -RM Spreads (USD/t)
Avg Spread last 7 yrs
800
650
500
350
200
Exhibit 106: Coking coal (USD/t) moderated significantly
from the peak and is now range-bound at USD210-220/t
800
600
400
200
0
Source: MOFSL, Steelmint
Exhibit 107: HRC (INR/t) bottomed out at INR48,000/t on
account of increasing imports
81,000
67,000
53,000
39,000
25,000
Exhibit 108: Rebar (INR/t) prices rebounded to 54,000/t
level with increasing construction activities post-monsoons
80,000
65,000
50,000
35,000
20,000
Source: MOFSL, Steelmint
Exhibit 109: Aluminum prices rebounded to +USD2,500/t
levels
4,600
3,800
3,000
Exhibit 110: Zinc prices surpassed +USD3,100/t levels
4,900
4,100
3,300
2,500
1,700
2,200
1,400
Source: MOFSL, Bloomberg
Exhibit 111: Copper prices recovered to USD10,000/t levels
12,500
10,500
8,500
6,500
Exhibit 112: Lead prices hovered around USD2,000/t
2,500
2,250
2,000
1,750
1,500
4,500
Source: MOFSL, Bloomberg
November 2024
55
 Motilal Oswal Financial Services
India Strategy | Review 2QFY25
Exhibit 113: EBITDA/t for steel companies under our coverage (consolidated)
EBITDA/t
JSW Steel
Tata Steel
SAIL
JSPL
4QFY23
12,158
9,279
6,247
10,775
1QFY24
12,340
7,186
4,245
14,283
2QFY24
12,341
6,037
4,429
11,372
3QFY24
11,967
8,760
5,638
15,705
4QFY24
9,100
8,271
3,879
12,162
1QFY25
2QFY25
9,003
8,869
9,059
7,343
5,536
3,111
13,585
11,893
Source: MOFSL, Company
OIL & GAS: Refining dents OMC performance; CGD margins soften QoQ amid APM de-allocation
Overall performance:
Revenue came in 9% below our estimate (flat YoY). Excluding OMCs, revenue was in line
with our estimate (flat YoY). EBITDA was below our estimate (down 33% YoY), with HPCL, BPCL, IOC, CSTRL, GUJS,
IGL, MAHGL, OINL, MRPL, PLNG, and AEGISLOG missing our estimates. Conversely, GUJGA beat our estimates,
while GAIL, RIL, and ONGC’s EBITDA was in line. Excluding OMCs, EBITDA was also in line (down ~5% YoY).
Adjusted PAT was 12% below est. (down 41% YoY). Adjusted PAT, excluding OMCs, was 10% above our estimate
(down 2% YoY).
RIL:
Jio’s revenue/EBITDA increased 7%/8% QoQ in 2QFY25. RIL performance was in line with our estimates, led
by weak performance in O2C (softer refining/petchem cracks) and Reliance Jio (elevated subscriber churn), offset
by lower depreciation and higher other income.
Upstream:
For
ONGC,
reported EBITDA came in line, but OINL missed our estimates as gas sales (0.65bcm) came
significantly below our estimate of 0.74bcm coupled with a 14% YoY rise in other opex. While ONGC’s oil
production from KG DWN-98/2 field rose to ~25kb/d (1QFY25: 12kb/d) and Crude oil/gas sales came in -1%/+2%
vs. our estimate, OINL’s oil production grew 5% YoY during the quarter.
OMCs – LPG under-recovery drags performance:
IOCL/HPCL/BPCL posted a 57%/41%/42% miss on our EBITDA
estimates due to subdued refining margins, with reported GRMs coming in at USD1.6/USD4.4/ USD3.1 per bbl. In
addition, their earnings took a significant hit due to the LPG under-recovery, amounting to INR37b/INR21b/
INR21b for IOCL/HPCL/BPCL in 2QFY25.
CGDs:
MAHGL and IGL
also missed our estimates due to lower-than-expected EBITDA/scm of INR10.7 and INR6.5
(7%/11% miss), respectively. However,
GUJGA
delivered a beat vs. our estimates, led by higher-than-expected
EBITDA/scm of INR6.4 (est. INR5.6). Volumes for MAHGL/IGL increased 13%/10% YoY to 4/9mmscmd. However,
GUJGA’s volume decreased 6% YoY to 8.8mmscmd.
Gas utilities:
While
GAIL’s
EBITDA was in line with our estimates, PAT came in 14% above our est. EBITDA/PAT grew at
7%/11% YoY, driven by higher other income and lower DDA vs. our estimates. Natural gas transmission volumes were
130.6mmscmd (vs. our est. of 128.5mmscmd; 131.8mmscmd in 1QFY25).
GUJS’s
EBITDA was 18% below our estimate
at INR1.9b, as total volumes came in 13% lower than our estimate. Implied tariff also came in ~13% below at
INR831/mmscm. PAT was boosted by strong other income (dividend from Gujarat Gas and Sabarmati Gas).
PLNG
delivered a 9% miss on EBITDA. Its total volumes stood at 239Tbtu (est. of 232.5Tbtu, +4% YoY).
MRPL
reported a
substantial miss due to weak refining performance, with GRM coming in at USD0.5/bbl.
CSTRL/AEGISLOG
reported a
6%/17% miss on EBITDA, led by lower-than-estimated margins.
Ratings and earnings revisions:
OMCs
– Owing to subdued refining performance and weak refining outlook, we
cut BPCL/HPCL/IOCL’s FY25E adjusted PAT estimates by 34%/49%/59%. Following
MRPL’s
weak 2Q refining
performance, we reduce our FY25/FY26 EPS estimates by 75%/37%.
For OINL,
we cut our FY25/26 PAT by 2/5%,
mainly as we moderate our volume growth assumptions. For
ONGC,
we trim our volume assumptions, and
together with the cut in HPCL/MRPL’s adjusted PAT, these lead to a 9-11% cut in consolidated EPS for ONGC over
FY25-27.
Top picks:
GAIL
– During FY24-27, we estimate a 14% PAT CAGR driven by: 1) an increase in natural gas
transmission volumes to 149mmscmd in FY27 (120mmscmd in FY24); 2) a substantial improvement in petchem
segment’s profitability over 2HFY25-FY27, as new petchem capacity will be operational; and 3) healthy trading
segment profitability with guided EBIT of at least INR45b.
HPCL
– It remains our preferred pick among the three
OMCs. We see the following as key catalysts for the stock: 1) demerger and potential listing of lubricant business,
November 2024
56
 Motilal Oswal Financial Services
India Strategy | Review 2QFY25
2) the commissioning of its bottom upgrade unit, and 3) the commencement of Rajasthan refinery in 4QFY25-
end.
OINL’s
production growth guidance remained robust (5% increase YoY), with drilling activity and
development wells in old areas contributing to this growth. OINL is also implementing new technologies to
increase production besides pursuing the Indradhanush Gas Grid connectivity. Capacity expansion for NRL (from
3mmt to 9mmt) is also expected to be completed by Dec’25, which will drive further growth.
Surprise:
GUJGA
Misses:
BPCL, HPCL, IOC, OINL, CSTRL, GUJS, IGL, MAHGL, MRPL, PLNG, and AEGISLOG
Guidance highlights:
RIL:
Management expects the increase in global oil demand to normalize at ~1mb/d (vs. 2.1mb/d in the previous
year). RIL expects refinery cuts globally in 3QFY25 amid weak refining margins. Some products, such as jet fuel,
may witness a robust 0.45mbd growth YoY in 3QFY25. Petrochemical spreads are expected to receive support
from stimulus package in China and the festive season in 2HFY25.
GAIL:
Management expects 5mmscmd p.a. growth in marketing volumes over the next two years. For the trading
segment, the management guides EBIT of at least INR45b in FY25. For petchem segment, it expects 2Q EBIT run-
rate to continue in 2HFY25. Capex in 2HFY25 shall be higher than 1H, taking FY25 capex to INR90b-INR100b.
Upstream:
ONGC’s
management expects total production volume (incl. JV) to rise by 11% over FY24-FY27 to
46.2mmtoe, mainly driven by KG-98/2 and Daman upside development. Gas production from the KG-98/2 asset,
which will begin in 4QFY25, is expected to ramp up to 10mmscmd by FY25 end-1QFY26, while oil production is
expected to ramp up to 45,000bopd by 4QFY25. ONGC expects capex to average INR360b from FY26.
OINL’s
management guided for a ~5% YoY increase in oil and gas production during FY26. NRL has achieved 70% physical
completion and is slated to start in Dec’25. Standalone/consolidated capex of INR70b/INR120b is planned to be
incurred in FY25, with 75% being incurred on the upstream segment. OINL plans to drill 70+ wells in FY25.
OMCs:
HPCL’s
management expects the mid-cycle GRM to be ~USD6-8/bbl + USD2/bbl benefit post-bottom
upgrade unit commissioning. For FY25, management expects capex of INR120-130b, of which INR65.9b has
already been incurred. Additionally, the company is targeting a 20% ethanol blending rate by FY26. In the CGD
business, management expects to reach INR10b EBITDA over the next five years.
BPCL’s
management expects
similar cracks for the next few quarters. In the CGD business, BPCL plans to add 150/160/182/200 stations in
FY25/FY26/FY27/FY28, with expected volume CAGR at 15-16%. For FY25, management expects a capex of
INR150b-160b, of which INR56 has already been incurred. The annual capex of INR180b-200b is expected in the
next couple of years. Capex shall increase from FY27 and shall amount to ~INR220b-250b going forward.
CGDs:
IGL’s management guided a robust 8-10% YoY growth in CNG volumes. For FY25, management expects
capex of INR17b, of which INR5b has already been incurred. It plans to add 50 LNG stations in the next 3-5 years.
MAHGL’s management guidance on margin and volume growth remained conservative (7% volume growth ex-
UEPL), with EBITDA/scm of INR10-12. For FY25, management expects a capex of INR8-9b, of which INR4.8b has
already been incurred. GUJGA’s management guided a conservative annualized volume CAGR of ~5-7% for FY25.
The management expects EBITDA/scm to range between INR5 and INR6 going forward. Capex shall be INR8b for
FY25. Additionally, the management expects volume from Morbi to be ~3.5mmscmd in 3QFY25.
November 2024
57
 Motilal Oswal Financial Services
India Strategy | Review 2QFY25
Exhibit 114: Implied gross marketing margin (INR/lit)
Implied marketing margin (INR/lit)
IOCL
BPCL
HPCL
Exhibit 115: Reported refining margin (USD/bbl)
IOCL reported GRM
36.0
26.0
16.0
USD/bbl
3.8
6.0
8.0
21.2
7.1
6.2
8.2
4.0
9.5
5.5
7.3
BPCL reported GRM
HPCL Reported GRM
SG GRM (USD/bbl)
6.0
(4.0)
(0.9)
0.1
1.2
1.8
2.0
3.5
3.6
Exhibit 116: Exhibit 3: Sales volume of CGDs (mmscmd)
Volumes mmscmd
9.8
4.1
2.7
1.1
11.4
12.1
10.0
11.4
11.4
GUJGA
9.9
IGL
MAHGL
11.0
8.8
8.6 9.0
3.9
4.0
9.8
7.6
7.3
8.1
3.4
8.9
8.3
3.4
9.2
8.2
3.4
9.3
8.3
3.6
9.2
8.5
3.7
9.7
8.7
3.8
5.5
6.3
6.8
2.9
5.3
2.4
7.2
3.1
7.7
3.3
7.7
3.2
7.9
3.4
8.1
3.5
2.1
2.8
Exhibit 117: Exhibit 4: EBITDA/scm trend for CGDs (INR)
EBITDA/scm
GUJGA
IGL
MAHGL
8.0
8.7
8.0
7.9
8.0
6.7
7.2
8.6
7.1
8.6
8.6
7.2
6.6
7.4
6.5
3.4
5.7
6.2
November 2024
58
 Motilal Oswal Financial Services
India Strategy | Review 2QFY25
REAL ESTATE: Demand remains intact but launches critical for 2HFY25
Sales declined 5% YoY:
Our coverage universe reported bookings of INR231b, a 5% decline YoY, due to
seasonality as well as a lack of launches due to approval delays. Demand was strong on an aggregate basis as
sales were only down 5% YoY even after launches were down 15% YoY, which confirms strong sustenance sales.
While the individual performance was healthy for most of the companies, timely launches for a few companies
such as GPL, LODHA, PEPL, BRGD, and SIGNATUR enabled them to outperform peers. SIGNATUR reported the
best performance with a 3x YoY increase in bookings, aided by a strong response to its premium project launch.
Pre-sales volume declined 13% YoY while our coverage universe witnessed 10% YoY growth in realization, driven
by price hikes and a product mix change. For the LfL product, price hikes were calibrated at a low single digit.
Double-digit growth aspiration intact:
Our coverage universe posted a 43% CAGR in cumulative bookings over
FY21-24 and they aspire for 20-30% growth in FY25 despite a high base. Over the last few quarters, business
development has remained equally strong, led by GPL and LODHA, which added new projects worth GDV of
INR212b and INR203b, respectively, and the traction sustained in 1HFY25 too. Consequently, companies have
identified a vast launch pipeline for FY25, which can support their future growth aspirations.
Launches dominated by few players:
Unlike in 2HFY24, which saw broad-based launches from all key
developers, only a handful of players, such as GPL, PEPL, BRGD, and SIGNATUR, successfully launched multiple
new projects. Cumulative launches in 2QFY25 stood at 19msf (vs. 22msf in 2QFY24). FY24 saw 88msf of new
launches from the coverage universe (vs. 66msf in FY23), which will further pick up as most of them have less
than 12 months of inventory. We expect our coverage universe to launch more than 130msf of projects in FY25.
Collections:
Total collections for 2QFY25 increased 22% YoY to INR189b. Moreover, collection efficiency
(collections-to-sales) improved to 82% vs 65% in 1QFY25 vs. TTM average of 66%, which can be attributed to
sustenance sales and new projects. With progress in construction, we expect efficiency to further move north
going forward, resulting in higher collections.
P&L performance – mixed bag:
Aggregate revenue for coverage universe increased 32% YoY to INR121b (in-
line). The individual performance was a mixed bag as DLF/LODHA/SOBHA/SUNTECK/KPDL/SIGNATUR reported
healthy revenue growth and OBER/PEPL/BRGD/MLIFE were affected by lower project deliveries. Cumulative
EBITDA stood at INR35.7b, up 24% YoY, with an EBITDA margin of 26% (vs. 28% in 2QFY24).
View:
The operational performance of our coverage universe was in line with our expectations. We retain our
FY25 pre-sales estimates (except upward revision for OBER) for all the companies but we will critically monitor
launches as many companies have shown concern regarding approval delays. However, companies were also
confident to meet their annual guidance on the back of strong inherent demand as well as strong sustenance
sales witnessed in 2QFY25. We prefer PEPL, GPL, and SIGNATUR as our top picks.
Positive Surprises:
GPL
Negative Surprises:
DLF
Company commentary:
LODHA:
LODHA has ended its pilot phase in Bengaluru with the success of two projects and plans to increase its
market share to 15% in a decade’s time as it did in other markets. Additionally, the management is now
evaluating a new city that can be a potential market and will decide on it by FY25 end.
OBER:
The company launched the most awaited Pokhran Road project in Thane, for which it witnessed strong
bookings of INR14b. Additionally, it plans to launch a new tower in Borivali and Goregaon in 2HFY25. OBER will
launch its Gurugram, Adarsh Nagar, Worli, and Tardeo projects in FY26.
DLF:
DLF targets to launch INR410b worth of projects in 2HFY25 across all segments. DLF launched its Ultra
Luxury project named ‘The Dahlias’ with a total revenue potential of INR260b with +70% gross margins. Goa,
Mumbai, and the next phase of Privana are in different stages of approval, while DLF is confident of launching its
Mumbai project in 4QFY25. Privana phase-3 would be launched in 4QFY25 and IREO after 1QFY26 (most
definitely in FY26). The management maintained the earlier guidance of INR170-180b bookings in FY25.
However, it indicated that except for the ultra-luxury project in DLF 5, all the new projects are likely to follow the
previous trend of monetizing significant (80-90%) inventory during the launch.
November 2024
59
 Motilal Oswal Financial Services
India Strategy | Review 2QFY25
GPL:
The management remains confident about the sustainability of the demand for a couple of years and
highlighted that it is in the early- to mid-stage of the cycle. GPL remains on track to meet or exceed its guidance
for all key parameters. The management is optimistic about building on the current momentum, with plans to
launch projects in Worli, Golf Course Road in Gurgaon, Sector 44 in Noida, Bangalore, Pune, Kolkata, and
Hyderabad.
PEPL:
PEPL plans to launch The Prestige City Indrapuram NCR, Southern Star & Sunset Park Bangalore, Palava
Gardens Chennai, Prestige Spring Heights Hyderabad, Beach Gardens Goa, and some small projects in Bangalore
and Hyderabad in 3Q. Nautilus is expected to be launched in 4QFY25. With the planned launches, PEPL is confident
about achieving its pre-sales guidance.
BEL:
Launches contributed 47-50% to the total pre-sales during 1HFY25. The company maintained its 13msf
launch guidance, but this will depend on regulatory approvals.
MLIFE:
The management aims to launch over INR30-35b worth of inventories across six projects in the next two
quarters. The key projects include Kandivali Phase 2, Malad redevelopment, Navi, Zen Phase II, Crown Phase 2,
and the plotted project in Jaipur.
SOBHA:
The inventory of 8.9msf across the ongoing projects (including completed) provides healthy visibility.
Additionally, SOBHA has 19.29msf under forthcoming projects at different stages of approval. SOBHA now
intends to foray into Mumbai and Noida but will remain calibrated in the approach.
KOLTE PATIL:
Management has reiterated its business development guidance of INR80b and expects a 25%
CAGR in pre-sales over FY25-27. KPDL is hopeful about launching the Laxmi Ratan Versova, Jal Mangal Deep
Goregaon, Vishwakarmanagar project from the Mumbai portfolio by the end of FY25. KPDL expects to recognize
INR18b in revenue in FY25 and would report EBITDA margin in the early teens. As a framework, the company
targets GM of 26-27%, EBITDA of 17-18%, and PAT margin of 10-11%.
Exhibit 119: …while volumes declined 13% YoY
Sales volumes (msf)
149%
92%
52%
28%
29%
44%
4%
15%
58%
30%
-5%
61%
2%
-13%
Growth YoY %
Exhibit 118: Pre-sales for the coverage universe declined 5%
YoY…
Pre-sales (INR b)
187%
87%
Growth YoY %
42%
2% 2%
17% 6%
47% 37%
34%
153 171 147 153 159 247 168 243 307 321 315 231
16.1 19.1 14.1 14.9 16.4 22.3 15.0 21.9 22.5 22.7 24.2 19.0
Exhibit 120: Collections improved 33% YoY in 2QFY25
Collections (INRb)
64%
123
136
115
7%
0% 0% 113 123
34%
18% 21%
27%
33%
13%
33%
22%
Growth YoY %
Exhibit 121: Expect coverage stocks to deliver 27% YoY
growth in bookings
Bookings (INR b)
FY24
FY25E
81%
23% 20% 22%
32%
24%
23% 42% 28% 29%
39%
161 136 156 163 181 181 190
November 2024
60
 Motilal Oswal Financial Services
India Strategy | Review 2QFY25
Exhibit 122: Estimate changes for our coverage universe
INR b
DLF
Godrej Properties
Macrotech
Oberoi Realty
Prestige Estates
Brigade
Sobha
Mahindra Lifespaces
Sunteck
Kolte Patil
Signature Global
INR b
DLF
Godrej Properties
Macrotech
Oberoi Realty
Prestige Estates
Brigade
Sobha
Mahindra Lifespaces
Sunteck
Kolte Patil
Signature Global
INR b
DLF
Godrej Properties
Macrotech
Oberoi Realty
Prestige Estates
Brigade
Sobha
Mahindra Lifespaces
Sunteck
Kolte Patil
Signature Global
INR b
DLF
Godrej Properties
Macrotech
Oberoi Realty
Prestige Estates
Brigade
Sobha
Mahindra Lifespaces
Sunteck
Kolte Patil
Signature Global
FY25E
180
270
178
59
260
85
85
30
25
35
101
FY25E
41
14
23
18
7
8
3
1
2
1
7
Old
FY26E
230
321
213
79
305
105
110
36
31
43
130
FY25E
181
270
178
73
260
85
85
30
25
35
101
FY25E
27
2
37
26
28
16
6
-2
3
3
9
Old
FY26E
42
10
34
26
10
9
7
1
3
3
10
FY25E
74
35
138
47
104
50
42
4
14
20
37
Old
FY26E
30
2
52
36
32
18
11
-1
5
6
13
Old
FY26E
80
37
181
64
114
50
50
5
18
30
52
Revenue
New
FY25E
FY26E
68
75
35
36
138
181
56
69
104
114
50
50
42
50
4
5
11
21
20
30
37
52
EBITDA
New
FY25E
FY26E
17
31
2
2
37
52
33
40
28
32
16
18
6
11
-2
-1
2
6
3
6
5
10
PAT
New
FY25E
FY26E
26
47
14
9
23
34
24
30
7
10
8
9
3
7
1
1
2
5
1
3
4
8
Pre-sales
New
FY26E
232
321
213
98
305
105
110
36
31
43
130
FY25E
1%
0%
0%
24%
0%
0%
0%
0%
0%
0%
0%
Change
FY25E
-7%
0%
0%
19%
0%
0%
0%
0%
-21%
0%
0%
Change
FY25E
-37%
0%
0%
25%
3178%
0%
0%
0%
-39%
0%
-42%
Change
FY25E
-37%
0%
-1%
32%
0%
0%
0%
0%
-36%
0%
-39%
Change
FY26E
1%
0%
0%
24%
0%
0%
0%
0%
0%
0%
0%
FY26E
12%
-5%
0%
17%
0%
0%
0%
0%
35%
0%
-18%
FY26E
3%
-28%
0%
13%
0%
0%
0%
0%
28%
0%
-20%
FY26E
-6%
-4%
0%
8%
0%
0%
0%
0%
16%
0%
0%
November 2024
61
 Motilal Oswal Financial Services
India Strategy | Review 2QFY25
Collections
Old
DLF
Godrej Properties
Macrotech
Oberoi Realty
Prestige Estates
Brigade
Sobha
Mahindra Lifespaces
Sunteck
Kolte Patil
Signature Global
FY25E
101
218
125
48
152
56
66
22
17
25
62
FY26E
135
263
144
65
218
78
76
31
24
34
94
FY25E
102
218
125
60
152
56
66
22
17
25
62
New
FY26E
137
263
144
76
218
78
76
31
24
34
94
FY25E
1%
0%
0%
23%
0%
0%
0%
0%
0%
0%
0%
Change
FY26E
1%
0%
0%
17%
0%
0%
0%
0%
0%
0%
0%
RETAIL: Modest recovery in 2Q; optimistic outlook on demand recovery in 2H
Modest sequential demand recovery, optimism abound for 2H:
The aggregate revenue for the five apparel stocks
in our coverage grew 22% YoY to INR99b (~3% miss), driven mainly by: 1) robust growth for Trent (+40% YoY) and
VMart (+20% YoY) and 2) recovery in growth for Vedant (+23% YoY). Including DMart, the aggregate revenue was up
~17% YoY to INR240b (1% miss). Productivity/LFL growth during the quarter continued to remain weak for most
retailers, except Trent (double-digit SSSG), V-Mart (+15% SSSG), and Vedant Fashions (+17% SSSG). However, there
was a modest sequential improvement in SSSG driven by an advancement of the festive period. Managements
remained upbeat on demand recovery in 2H driven by the festive season and higher number of weddings.
Aggregate gross profit for grocery and apparel retailers was up 22% YoY (~2% miss) as aggregate gross margins
expanded ~95bp YoY (~15bp miss). The aggregate EBITDA was up 18% YoY (~4% miss) as aggregate margin
remained broadly stable YoY (30bp miss) on weaker margins for heavyweights such as Trent and DMart.
Subdued 2Q for Footwear on non-BIS inventory liquidation and higher discounting:
The aggregate revenue for
the four footwear stocks under our coverage was up ~4% YoY (inline), largely led by 29% YoY growth in Campus’
revenue (on a low base). Aggregate gross profit was up modest ~3% YoY (3% miss), as gross margin contracted
~40bp YoY (115bp miss) on account of non-BIS inventory liquidation and higher discounting. Relaxo was the only
company to report YoY uptick in gross margin as it decided against diluting pricing and margin amid higher
competition from lower-priced unorganized players. The aggregate EBITDA was broadly stable YoY (7% miss) as 56%
YoY growth for Campus was offset by declines for Bata and Relaxo. EBITDA margin contracted ~60bp YoY (120bp
miss) due to 130-150bp EBITDA margin contraction for Bata and Metro. Managements of all four footwear
companies were optimistic on demand recovery in 2H, driven by the festive season and higher number of weddings.
Store additions moderated in 1HFY25 due to store rationalization by apparel retailers:
The revenue growth
during Q2 for our retail coverage (apparel, grocery, and footwear) was largely driven by store addition
(+11%
YoY),
while store productivity was up ~5% YoY, driven by rationalization of unprofitable stores.
Net store
addition in 2QFY25 for the MOFSL Retail sector was 40, reaching 10,715 stores.
Though store additions
supported revenue growth, majority of the retailers moderated the pace of store openings with 75 net store
additions in 1HFY25 (vs. 353 net store additions in 1HFY24). The weak demand environment, increased real
estate prices over the past year, and rationalization of loss-making stores resulted in net closures/slower store
additions for most apparel retailers.
Top picks:
TRENT, DMart, and Metro Brands
Positive surprises:
Vedant Fashions
Guidance highlights:
ABFRL:
Management’s focus was on consolidating unprofitable stores in 1H and expects ~100 store openings in
urban-centric locations in ABLBL Lifestyle brands and Reebok stores in 2H. Further, the management aims to
open 20-25 stores annually in Pantaloons in larger towns. Pujo was slightly weaker in Kolkata due to several
externalities, but management expects demand to pick up driven by festive and wedding seasons in 2H.
Shoppers Stop:
Management expects to deliver mid-single digit LFL growth in 2H, driven by a higher number of
weddings and discretionary spending pick-up. Further, it expects mid-single-digit pre Ind-AS EBITDA margins in
November 2024
62
 Motilal Oswal Financial Services
India Strategy | Review 2QFY25
FY25 (vs. loss in 1H) with further atleast 100bp margin expansion in FY26. It plans to open ~60 new stores in 2H,
including 50 Intune, 7 Department, 6 Beauty, and 2 HomeStop stores, while closing down 5-6 underperforming
departmental stores (closed 3 in 1H).
Vedant Fashions:
The management indicated that store expansions are likely to be higher in 2H, with some
spillover anticipated into FY26. Some store openings in Q2 were postponed to the first week of Q3 (because of
the Shradh period). The company usually closes 2-2.5% of its retail area every year. However, this year, the
closure is expected to be higher at ~4-5% (a major clean up like this happens once in 4-5 years).
VMART: a)
GM of the offline business is expected to remain stable over the medium term; however, the drag
from lower LR commissions could impact blended gross margins. Overall, VMART expects to get back to pre-Ind-
AS EBITDA margin of 7-8% (pre-COVID margins) in the next 2-3 years
.
b
) The management guided for the
addition of 55-60 stores in FY25. Store renovation is driving higher capex; however, the average capex per store
has not increased meaningfully. The management aspires for 12-13% annual sq. ft. additions over the long term.
BATA:
The management highlighted that demand improved modestly in Q2 (vs. Q1) with demand in Sep’24
much better than that in July’24. Tier 2 and below towns witnessed better traction, which was partially offset by
premium products performing better than mid and mass products (<1k products contribution declined to ~30%
from ~40% YoY). Further, management remained confident of gross margin expansion in the medium term.
Campus Activewear:
The margins are expected to expand in H2 led by operating leverage benefits. Despite a
weaker 1H, the management has guided for margin in FY25 to be higher than FY24 (14.6%).
Metro Brands:
The management has maintained its store opening guidance of net 100 store additions for FY25
(despite a slower pace with 35 store openings in 1H). Further, the management has guided for a broad range of
10-15% revenue growth for FY25 (vs. 2% YoY in 1H), driven by a pick-up in demand in 2H.
Relaxo:
Management expects flattish volumes for FY25, with 8- 10% revenue growth for the Sparx brand.
Exhibit 123: Aggregate revenue for retailers under our
coverage grew 16% YoY led by ~11% store additions
Aggregate Revenue (INR b)
YoY growth (%)
20.1
17.7
15.9
30.7
30.3
Exhibit 124: Aggregate gross profit was up ~18% YoY as
gross margin expanded 50bp YoY (~25bp miss)
Aggregate Gross Profit (INR b)
32.4
31.6
31.3
GM (%)
31.8
30.8
19.4
17.6
16.7
18.0
Source: Company, MOFSL
Exhibit 125: Aggregate EBITDA was up 15% YoY as margin
contracted ~5bp due to weak margins for footwear retailers
Aggregate EBITDA (INR b)
10.4
12.2
13.1
11.0
11.1
Aggregate EBITDA margin (%)
11.9
11.0
Exhibit 126: Aggregate PAT rose ~19% YoY, driven mainly by
improvement in Trent’s profitability
Aggregate PAT (INR b)
91.5
7.1
-6.3
-19.8
-23.4
17.5
18.7
YoY growth (%)
Source: Company, MOFSL
November 2024
63
 Motilal Oswal Financial Services
India Strategy | Review 2QFY25
Exhibit 127: Store additions moderated on rationalization of stores by apparel retailers
Total Stores
1QFY24
2QFY24
ABFRL
4,188
4,056
DMART
327
336
SHOP
276
281
TRENT
632
661
VMART
431
437
Vedant Fashions
662
669
Metro
789
817
Campus
225
240
Bata
1,750
1,781
Relaxo
389
394
Total coverage stores
9,669
9,672
Absolute adds QoQ
350
3
Note: Excluding Raymond Lifestyle and Reliance Retail stores
3QFY24
4,753
341
290
715
454
673
840
250
1,835
399
10,550
878
4QFY24
4,664
365
306
811
444
676
839
268
1,862
405
10,640
90
1QFY25
4,607
371
320
823
448
662
854
275
1,916
399
10,675
35
2QFY25
YoY
QoQ
4,538
11.9
-1.5
377
12.2
1.6
341
21.4
6.6
831
25.7
1.0
467
6.9
4.2
650
-2.8
-1.8
873
6.9
2.2
280
16.7
1.8
1,955
9.8
2.0
403
2.3
1.0
10,715
10.8
0.4
40
Source: Company, MOFSL
Retail - Jewelry: Robust revenue growth; positive trend in the festive season
Jewelry companies have delivered robust sales growth driven by recovery in demand post the custom duty
reduction. Titan (Jewelry standalone), Kalyan, and Senco delivered revenue growth of 26%, 37%, and 31%,
respectively. Their SSSG was 15%, 23%, and 20% respectively. Studded jewelry sales declined across companies,
except for Kalyan, due to softer diamond demand, which impacted margins. For Kalyan, a higher revenue
contribution from franchise stores also pressured reported margins. The reduction in customs duty resulted in
an inventory loss of INR2.9b for Titan, INR690m for Kalyan, and ~INR298m for Senco, which hurt the reported
profitability of companies. These losses were partially offset by adjustments in raw material prices, with the
remaining 40-50% impact expected in 2HFY25. Festive demand in October 2024 was robust and we remain
positive on the jewelry sector, anticipating an accelerated shift in consumer preference from unorganized/local
channels to organized retail.
Outperformer (2Q)
Kalyan Jewelers
Underperformer (2Q)
-
Titan, Senco
Guidance highlights:
TTAN:
The company expects standalone (ex-bullion) EBIT margin of 11% to 11.5% for FY25. Demand was healthy
during the festive season.
Kalyan Jewelers:
The company will open 80 Kalyan showrooms and 50 Candare showrooms in FY25. Store
openings in FY26 are expected to be higher than the current year, with additional stores planned for the South
Indian, Middle Eastern, and international markets.
Senco:
The company aims for 18-20% revenue growth in FY25, with 12-13% expected from SSSG and the rest
from new store openings. Profitability growth guidance is of 15-18%. GP margin is expected to be ~16% in FY25.
Store guidance of 18 to 20 stores is maintained for FY25.
TECHNOLOGY: IT services post robust 2Q, but guarded outlook signals gradual recovery
Aggregate performance:
The IT services companies (MOFSL Universe) reported healthy performance (beating
our estimates), with a median revenue growth of 2.0% QoQ CC in 2QFY25 (1.0%/0.7%/1.2% in
3QFY24/4QFY24/1QFY25). While results were encouraging, the outlook remained slightly guarded, signaling
persisting uncertainties. This indicates that despite client pessimism bottoming out, a solid lift-off in
discretionary spending has yet to emerge. Nonetheless, we anticipate a gradual return of modernization and
discretionary spending in selected pockets. The recovery in the US banking sector started taking shape, and this
trend has persisted in this quarter’s commentary as well. Apart from US banking, we anticipate growth in
pockets such as healthcare and manufacturing as well as steady recovery in data and ERP modernization. We
believe the cycle is gradually turning (might not be a J-curve recovery) as clients are beginning to reinvest their
savings from cost-reduction programs to reduce technological debt.
Healthy revenue growth:
Tier-1 saw a median revenue growth of 1.6% QoQ CC, while Tier-2 companies reported
a growth of 3.0% QoQ CC, driven by strong performances of Coforge (26.3% CC QoQ growth, organically 5.5% CC
64
November 2024
 Motilal Oswal Financial Services
India Strategy | Review 2QFY25
QoQ) and Persistent (5.1% QoQ CC). ZENT (0.3% QoQ CC) and WPRO (0.6% QoQ CC) reported a muted growth.
HCLT (+1.6 QoQ CC vs. est. of flat revenue) and Coforge (organic +5.5% QoQ CC vs. 4.0% est.) outperformed their
peers with strong executions in 2Q. On the margins front, Tier-1 and Tier-2 companies both reported ~20bp QoQ
expansion. The margin expansion for Tier-1 was majorly attributed to ramp up of previously won deals, deferred
wage hikes (INFO), and a recovery in ER&D margin (HCLT), whereas for Tier-2, margin expansion came from
better-than-expected Cigniti’ s margins (COFORGE), growth leverage, and operating efficiency.
TCV back to normal run-rate:
The deal TCV growth has normalized for Tier-1 companies, with Infosys being an
exception in 2Q (down 41.5% QoQ). Tier-2 companies also reported robust growth in TCV. HCLT’s new deal TCV
stood at USD2.2b (up 13% QoQ). Within Tier-2, PSYS’s TTM TCV was USD529m, up 14% QoQ and 10% YoY.
COFORGE’s organic order intake of USD448m in 2Q with three large deals, resulted in a robust organic 12-month
executable order book of USD1,105m (+18% YoY). The 2Q book-to-bill was decent at ~1.0x for both Tier-1 and
Tier-2 players.
Headcount movement:
The hiring activities were robust in 2Q; the net headcount reported an addition of
~17.5k for Tier-1, while Tier-2 saw a net addition of ~5.1k. The attrition rate remained range-bound at lower
levels for a majority of the companies, while utilization also remained stable QoQ.
Top picks:
We prefer HCLT and LTIM among large-caps and COFORGE and PSYS in the mid-cap space. We
estimate HCL to lead revenue growth among large caps over the next three years, driven by its resilient portfolio
and engineering services. Our positive outlook on LTIMindtree is based on its best-in-class offerings in data and
ERP modernization, with a recovery in US banks' discretionary spending expected to further support its growth.
We believe Coforge’s healthy executable order book and a rebound in BFS client spending bode well for its
organic business. Cigniti could prove to be an effective long-term asset. Persistent Systems, with its strong
product engineering background, remains the fastest-growing IT services company in our coverage and is well-
positioned to benefit from the long-term GenAI investments.
Significant Beat:
HCLT (revenue growth and margin), Wipro (margin), Coforge (revenue growth), Persistent
(revenue growth)
Significant Miss:
LTIM and LTTS (revenue growth and margin)
Significant Surprise:
Infosys (revenue guidance increased less than expected)
Major EPS upgrades/downgrades:
Infosys’ FY25/FY26/FY27E EPS were upgraded by 2.5%/2.7%/3.4%. LTTS’
FY25/FY26/FY27E EPS were cut by ~2% each. ZENT/CYL’s FY25E EPS were upgraded by 3.5%/3.6%.
Guidance highlights
TCS:
It expects growth markets such as India, EMEA, and Asia Pacific to be sustainable growth drivers going
forward and anticipates one more quarter of margin impact due to the transformational projects, which should
act as a tailwind from 4Q/1Q. Further, TCS anticipates the furlough situation to remain the same as last year. The
company has an aspirational margin range of 26-28% for the long term, with FY25 likely to exit at ~26%. In BFSI,
North America is seeing good growth in banking, and TCS expects this growth to sustain in the coming quarter.
INFO:
Revenue growth guidance has been revised from 3.75% to 4.5%. 2HFY25 will be impacted by seasonality
due to furloughs and fewer working days, but this has been factored into the guidance. EBIT margin guidance
remains at 20-22%. Tailwinds in 2H are expected from pricing improvements and subcontractor cost
optimization.
WPRO:
It expects revenue from the IT Services business to be in the range of -2.0% to 0.0% in CC terms for
3QFY25. Client-specific issues leading to softness in Europe have been factored into the guidance. The company
is focused on doubling down on manufacturing and energy, natural resources, and utilities (ENU) for a potential
revival. The target margin range is 17.0-17.5%.
HCLT:
The outlook for discretionary spending is improving. For FY25, revenue growth guidance was upgraded to
3.5-5% YoY in CC (similar for Services) from 3%-5% earlier. EBIT margin guidance was maintained at 18.0- 19.0%
in FY25. The lower end of growth guidance has increased; 2% growth is needed in Q3 and Q4 to achieve the
upper end guidance of 5%. This growth assumes similar furloughs and the execution of deals signed in recent
quarters.
November 2024
65
 Motilal Oswal Financial Services
India Strategy | Review 2QFY25
TECHM:
The second half of the fiscal year is expected to be better as the foundation for a turnaround has been
established. The company is making steady progress on its FY27 targets based on long-term metrics of three
pillars, viz; growth, margins, and organizational excellence. The outlook for discretionary spending in
manufacturing is conservative, reflecting softness in the sector. A wage hike is unannounced but likely to be
announced in the coming months.
LTIM:
LTIM is cautious on discretionary spend. 2H should see a ramp-up of deals closed in 1HFY25, barring
seasonal impacts. The target margin of 17-18% has been extended due to external challenges. The current focus
is on maintaining margins while waiting for growth to return. 2HFY25 will face margin headwinds such as wage
hikes, large deal ramp-ups, and hiring. It observed continued deal momentum in key verticals; however, it is
cautiously optimistic about maintaining the momentum in 3Q.
Exhibit 129:
Tier-2 posted healthy revenue growth, supported by
a low base and the Cigniti acquisition impact
22.2%
17.8%
8.9%
6.8%
4.4%
4.3%
12.6%
10.1%
12.3%
7.8% 6.7% 6.7% 7.6%
6.1%
Tier II Revenue Growth (USD, YoY %)
Exhibit 128: Tier-1 leading the path to growth recovery
13.8%
10.9%
Tier I Revenue Growth (USD, YoY %)
2.5%
0.8% 0.4%
1.9%
Exhibit 130: Recovery in BFSI is solidifying in 2Q
12.5%
Tier-1 Companies BFSI QoQ Growth
4.5%
3.3%
2.6%
3.2%
1.4%
0.5%
0.3%
-0.8%
-0.6%
-1.4%
-1.4%
1.3%
4.2%
1QFY22 2QFY22 3QFY22 4QFY22 1QFY23 2QFY23 3QFY23 4QFY23 1QFY24 2QFY24 3QFY24 4QFY24 1QFY25 2QFY25
Exhibit 131: Margins improved for both tier-1 and tier-2 players
Tier I EBIT Margin (%)
19.9
20.4
20.1
19.2
15.4
19.9
Tier II EBIT Margin (%)
20.1
20.1
19.9
20.1
14.0
14.6
14.8
14.7
14.9
14.9
13.5
13.7
2QFY23
3QFY23
4QFY23
1QFY24
2QFY24
3QFY24
4QFY24
1QFY25
2QFY25
Source: Company, MOFSL
November 2024
66
 Motilal Oswal Financial Services
India Strategy | Review 2QFY25
Exhibit 132:
Median utilization (%) inched up 70bp QoQ in 2Q
IT Sector - Median Utilization (incl. trainees %)
83.9%
82.9%
81.5% 81.8% 81.9%
81.6%
79.9% 79.7%
84.6%
Exhibit 133: Median attrition (%) inched up 20bp in 2Q
23.8%
21.7%
19.8%
17.3%
14.6%
12.9% 12.5% 12.7% 12.9%
IT Sector - Mediam Attrition (%)
Figures excl. TCS and HCLT; CYL excl. from 1QFY24; LTTS excl. from
1QFY23; MPHL (Offshore); Source: Company, MOFSL
Figures exclude MPHL; Source: Company, MOFSL
TELECOM: Strong quarter on partial benefits of tariff hike flow-through
As expected, 2QFY25 was a strong quarter for telcos, with 8% QoQ growth (17% YoY, inline) in wireless revenue for
the three private telcos. Blended wireless ARPU was up 9% QoQ (+11% YoY), driven by partial benefits of Jul’24 tariff
hikes. However, due to SIM consolidation after the tariff hikes, reported subscribers for private telcos declined by
~21m (-2% QoQ). We expect subscriber churn to moderate over the next few months. EBITDA for private telcos was
up ~10% QoQ (+18% YoY, in line), driven by healthy ~70% incremental margins. Among private telcos, Bharti was
again the biggest gainer in 2QFY25, with ~90bp QoQ gain (~175bp YoY) in revenue market share (RMS) and ~40bp
QoQ (+60bp YoY) subscriber market share (SMS) gains. RJio lost ~45bp QoQ (-15bp YoY) RMS and ~30bp QoQ (still
up 100bp YoY) SMS in 2Q due to the clean-up of inactive subscribers. Vi continued to lose market share, with RMS
down further ~45bp QoQ (-160bp YoY) and SMS down ~10bp QoQ (-165bp YoY). With the completion of the first
phase of 5G rollouts, wireless capex for BHARTI and RJio moderated sharply in 1HFY25, while Vi’s capex inched up
moderately, after the fund raise. Home Broadband subscriber net additions accelerated for Bharti/RJio in 2Q, with
the ramp-up in fixed wireless access (FWA) offerings.
Tariff hike boost partially offset by subscriber churn; Bharti biggest gainer
Driven by the partial flow-through of tariff hikes, blended wireless ARPU was up ~9% for private telcos, with Bharti
leading with ~11% QoQ uptick, followed by ~7% QoQ increase for RJio and Vi. The tariff hikes led to SIM
consolidation and 40-110bp QoQ increase in monthly churn. Their reported subscriber base declined by ~21m (-2%
QoQ), with RJio reporting the highest wireless net subscriber decline of ~12-13m, followed by 5m decline for Vi and
modest ~3m decline for Bharti. We expect subscriber trends to normalize from 3QFY25. With tariff hike flow-
through partly offset by subscriber churn, wireless revenue for private telcos rose ~8% QoQ, with Bharti leading with
~10% growth, followed by 7% for RJio and 5% for Vi. Bharti’s incremental RMS at ~52% remained higher than its 2Q
RMS of ~40.5%.
Robust incremental margin drives 10% sequential growth in combined EBITDA for three private telcos
Driven by tariff hike flow-through, incremental margin for private telcos improved to ~70% (from 66% QoQ). As a
result, combined EBITDA grew ~10% QoQ (~18% YoY), with Bharti leading with ~13% growth, followed by 8% growth
for RJio and Vi. Vi led with ~160bp QoQ EBITDA margin expansion, followed by ~145bp expansion in Bharti’s wireless
EBITDA margin. RJio’s EBITDA margin improved by a modest ~50bp QoQ owing to a sharp ~10% QoQ increase in
customer acquisition costs.
Capex moderating for Bharti and RJio; net debt inches up for Bharti and Vi on spectrum purchases
Bharti’s India wireless capex declined 30% YoY (down 18% QoQ) to INR40b, with India capex down 20% YoY (8%
QoQ) to INR63b. Bharti’s 1HFY25 India capex stood at ~INR130b and it could inch up in 2H, but we believe
Bharti’s India capex likely peaked in FY24 (~INR335b) in the medium term.
RJio’s 1H cash capex was up 17% YoY at ~INR200b, likely on repayment of capex creditors. However, RJio’s asset
additions (an indication of committed capex and interest capitalized) declined to ~INR205b (vs. INR380b YoY).
November 2024
67
 Motilal Oswal Financial Services
India Strategy | Review 2QFY25
Vi’s 2QFY25 capex increased to INR14b (from ~INR8b in 1Q) as it rolled out ~42k 4G sites. Management
indicated that capex would further rise to INR80b in 2HFY25 as Vi targets to further ramp up its 4G population
coverage and selectively roll out 5G services.
Bharti’s consolidated net debt (excl. leases) increased by INR59b QoQ to INR1.41t on spectrum acquisition and
dividend payments.
Vi’s net debt (excl. leases) increased by INR93b QoQ to INR2.12t on account of dues repayment to
vendors/banks, higher cash capex, and spectrum acquisition.
RJio’s net debt declined by ~INR90b in 1HFY25 to INR2t, with 1HFY25 FCF generation of INR28b (vs. INR2b YoY).
Indus continues to benefit from prior period provision reversals:
2Q reported financials came in ahead of our
estimate owing to a higher-than-expected reversal of prior-period bad debt provisions (INR11b vs. our estimate of
INR5b). However, core operational performance was slightly below estimates, with a 2% miss on recurring EBITDA
(+1% QoQ, +7% YoY) on lower tower net additions and weaker energy spreads. Tower additions further moderated
QoQ on adverse weather events but should pick up in 2H. Vi’s fund raise and impending network rollout are
materially positive for Indus as it: 1) helps sustain 100% collections, 2) enables past dues recovery (INR36b), and 3)
provides incremental business to Indus at minimal capex. However, we remain concerned on long-term risks from
potential shortfall in Vi’s payments, given its large cash shortfall (INR200b+ annually over FY27-31E).
TCOM subdued performance continued:
TCOM’s data revenue grew 3% QoQ, with growth primarily led by loss-
making incubation segment. EBITDA declined 1% QoQ (5% miss) as margins contracted 60bp QoQ to 19.4%.
Reported financials were also boosted by INR0.9b prior-period revenue recognition; adjusting the same, growth in
core-business remained subdued.
Top picks:
BHARTI, RIL
Positive surprises:
Airtel Africa
Guidance highlights:
RJio:
RJio has rolled out standalone 5G services and migrated 148m users to 5G. The pace of home connects
accelerated to 1.8m in 2QFY25 (3x vs. past four quarters on average) and management plans to further ramp up
customer acquisition to 1m homes per month with a target to reach 100m connected homes (vs. ~14m in 2Q).
Bharti:
The flow-through of tariff hike has been in line with the management’s expectations, while the SIM
consolidation and customer down-trading came in lower than its initial expectations. Management reiterated its
stance on the need for further tariff hikes and a change in tariff construct to usage-based plans.
Vi:
The company rolled out ~42k 4G sites during 2Q, which led to an increase in 4G population coverage by 22m
to 1.05b by Sep’24. Management expects to reach 4G population coverage of 1.1b by Mar’25 and 1.2b by
Sep’25. Further, it aims to start rolling out 5G services from 4QFY25. Vi is targeting INR80b capex in 2HFY25 (vs.
~INR22b in 1H).
TCOM:
The order book was up 25% YoY in 2Q on account of large deal wins with OTTs and hyper-scalers as well
as the highest order booking in five years in international business. The funnel remains robust, though funnel
additions have been subdued. Management has maintained its ambition of doubling data revenue by FY27 and
bringing EBITDA margins back to 23-25% over the medium term.
Indus:
Tower additions were impacted by seasonality in 2Q. However, the order book remains healthy and
management expects tenancy additions to improve further on account of Vi’s upcoming network rollouts.
Further, Indus’ management remains engaged with Vi for swift clearance of past overdue and to ensure timely
payments.
November 2024
68
 Motilal Oswal Financial Services
India Strategy | Review 2QFY25
Exhibit 134: BSNL gained subscriber market share, post the
tariff hikes by three private telcos
RJio
48%
36%
24%
12%
Bharti
Vi
Other players
Exhibit 135: Bharti continued to lead with highest ARPU
growth
Bharti (India)
VIL
RJio
0%
FY23
FY24
FY25
Exhibit 136: Wireless KPI comparison
1Q
EOP Wireless SUBS (m)
Bharti (India)
Idea
RJio
Avg. Wireless Subs (m)
Bharti (India)
Idea
RJio
ARPU (INR/month)
Bharti (India)
Vi
RJio
MOU/Sub (min)
Bharti (India)
Idea
RJio
Wireless traffic (B min)
Bharti (India)
Idea
RJio
Data usage/Sub (Gb)
Bharti (India)
Idea
RJio
Data traffic (B Gb)
Bharti (India)
Idea
RJio
321
255
441
321
262
433
146
104
138
FY22
2Q
3Q
323
253
430
322
254
435
153
109
144
323
247
421
323
250
425
163
115
152
4Q
326
244
410
324
246
416
178
124
168
1Q
327
240
420
327
242
415
183
128
176
FY23
2Q
3Q
328
234
428
328
237
424
190
131
177
332
229
433
330
232
430
193
135
178
4Q
335
226
439
334
227
436
193
135
179
1Q
339
221
449
337
224
444
200
139
181
FY24
2Q
3Q
342
220
460
340
221
454
203
142
182
346
215
471
344
218
465
208
145
182
4Q
352
213
482
349
214
476
209
146
182
FY25
2Q
1Q
355
210
490
353
211
486
211
146
182
352
205
479
353
208
484
233
156
195
YoY QoQ
(%) (%)
2.7 -0.8
-6.7 -2.4
4.2 -2.2
3.7 -0.1
-5.9 -1.8
6.6 -0.3
14.9 10.6
9.9 6.8
7.4 7.4
1,044 1,053 1,061 1,083 1,104 1,082 1,094 1,122 1,138 1,123 1,127 1,158 1,128 1,135 1.1 0.6
642 629 620 614 620 601 611 623 626 613 615 626 607 586 -4.4 -3.5
815 835 901 962 1001 968 984 1004 1002 979 981 1008 974 977 -0.2 0.3
1,002 1,020 1,030 1,051 1,079 1,063 1,082 1,124 1,149 1,148 1,161 1,210 1,195 1,200 4.5 0.4
504 480 465 452 450 428 424 425 420 406 401 402 385 365 -10.1 -5.2
1060 1090 1150 1200 1246 1230 1270 1313 1335 1334 1370 1440 1420 1420 6.4 0.0
18.5
13.0
15.6
10.8
5.4
20.3
18.6
13.2
17.6
11.3
5.4
23.0
18.3
12.5
18.4
11.3
5.1
23.5
18.8
12.6
19.7
11.8
5.1
24.6
19.5
13.0
20.8
12.6
5.3
25.9
20.3
13.7
22.2
13.5
5.6
28.2
20.3
13.9
22.4
13.9
5.6
29.0
20.3
13.9
23.1
14.2
5.7
30.3
21.1
14.4
24.9
14.9
5.9
33.2
21.7
14.6
26.6
15.7
6.0
36.3
22.0
14.2
27.3
16.4
5.9
38.1
22.6
14.3
28.6
17.4
5.9
40.9
23.7
14.5
30.3
23.9
14.4
31.0
10.1 0.7
-1.6 -1.1
16.2 2.4
18.8 19.8 25.6 5.2
6.0
5.9 -2.1 -1.9
44.1 45.0 24.0 2.0
Source: MOFSL, Company
November 2024
69
 Motilal Oswal Financial Services
India Strategy | Review 2QFY25
Exhibit 137: Financials
1Q
Revenue (INR b)
Bharti (India wireless)
Bharti (consolidated)
Idea
RJio
EBITDA (INR b)
Bharti (India wireless)
Bharti (consolidated)
Idea
RJio
EBITDA Margin (%)
Bharti (India wireless)
Bharti (consolidated)
Idea
RJio
PAT (INR b)
Bharti (consolidated)
Idea
RJio
EPS (INR)
Bharti
Idea
RJio
143
269
92
180
70
130
37
86
49.2
48.3
40.5
47.9
3
(73)
35
FY22
2Q 3Q
152
283
94
187
75
138
39
90
49.2
48.8
41.1
48.0
11
(71)
35
161
299
97
193
79
147
38
95
49.4
49.2
39.3
49.2
8
(72)
36
4Q
176
315
102
209
89
160
46
105
50.6
50.9
45.4
50.3
20
(66)
42
1Q
182
328
104
219
93
165
43
110
51.2
50.4
41.6
50.1
16
(73)
43
FY23
2Q 3Q
190
345
106
225
99
176
41
115
52.4
51.0
38.6
51.0
21
(76)
45
194
358
106
230
104
185
42
120
53.8
51.5
39.4
52.2
16
(80)
46
4Q
195
360
105
234
105
187
42
122
53.8
51.9
40.0
52.2
30
(64)
47
1Q
204
374
107
240
112
196
42
126
54.8
52.3
39.0
52.3
16
(78)
49
FY24
2Q 3Q
210
370
107
248
115
195
43
130
54.9
52.7
40.0
52.3
13
(87)
51
216
379
107
254
119
198
44
133
55.1
52.3
40.8
52.3
24
(70)
52
4Q
221
376
106
260
122
194
43
136
55.1
51.5
40.9
52.4
21
(77)
53
FY25
1Q 2Q
225
385
105
265
125
197
42
139
55.6
51.2
40.0
52.6
42
(64)
54
248
415
109
283
142
218
45
150
57.1
52.7
41.6
53.1
36
(72)
62
YoY
(%)
18.5
12.0
2.0
14.5
23.2
12.0
6.2
16.1
215bps
0bps
165bps
72bps
168.0
-17.9
23.2
162.6
-41.1
23.2
QoQ
(%)
10.3
7.7
4.0
7.0
13.1
10.9
8.2
8.0
145bps
150bps
161bps
49bps
-13.6
11.6
14.4
-13.6
11.6
14.4
0.5 2.1 1.5 3.6 2.9 3.8 2.8 5.3 2.8 2.4 4.3 3.7 7.2 6.2
(2.5) (2.5) (2.5) (2.0) (2.3) (2.4) (2.5) (1.3) (1.6) (1.8) (1.4) (1.5) (0.9) (1.1)
0.8 0.8 0.8 0.9 1.0 1.0 1.0 1.0 1.1 1.1 1.2 1.2 1.2 1.4
Source: MOFSL, Company
UTILITIES: Mixed 2Q; JSWE and IEX beat PAT estimates
Overall performance:
For our coverage universe, revenue was below our estimates by 6.9% (mainly due to an
18% miss for TPWR), EBITDA was below our estimates by 9% (mainly due to a 19%/13% miss for NTPC/JSWE,
while TPWR was 15% above our estimates), and Adjusted PAT (APAT) was below our estimates by 4% (JSWE/IEX
were 20%/3% above our estimates).
Overall mixed 2Q with JSWE and IEX beating PAT estimates:
JSWE’s APAT was 20% above our estimates,
reporting a 14% YoY increase in net generation to 9.8BUs primarily driven by enhanced hydro generation, the
addition of new wind capacity, and an increase in thermal generation. The company also commissioned 204MW
of wind capacity, further expanding its Renewable Energy (RE) portfolio. PWGR’s reported SA PAT was in line
with our estimate, while it added 405ckm of transmission lines and 8,515MVA of transformation capacity.
TPWR’s EBITDA came in 15% above our estimate despite challenges at Mundra (low plant availability) and
Odisha DISCOM operations (impacted by cyclone/heavy rains). However, the adjusted PAT was just a 2% miss vs
our estimate. NTPC’s standalone EBITDA was 19% below our estimate of INR119b, primarily due to a sharp rise
in other opex (Coal plant PLF was 72% (down 5% YoY), hydro plants’ PLF improved to 97%, and gas plants’ PLF
declined to 6.7% (2QFY24: 18.25%)). IEX delivered standalone revenue in line with our estimate, while reported
standalone PAT came in 3% above our est., mainly led by higher other income. IEX’s overall volumes rose 38%
YoY in 2QFY25, with electricity market (DAM, TAM, and RTM) volumes rising 15% YoY and RE volumes surging
277% YoY.
Ratings and earnings revisions:
NTPC -
We cut our standalone FY25E adjusted PAT by 6% to INR199b, primarily
due to weaker profitability observed during the quarter.
TPWR -
Following the weak 2QFY25 result at the
reported PAT level, we cut our FY25 estimate by 13%, mainly as we build in the INR4.4b merger-related charges
and given the weaker profitability at some of the Orissa subsidiaries. We also moderate our FY26 adjusted PAT
by 5% as RE generation ramp-up has been somewhat behind expectations.
PWGR
- Following 2QFY25 results, we
moderate our FY25 PAT estimate marginally (-4%) due to 1H consolidated capitalization (INR40b), trailing
previously provided guidance of INR140-150b for FY25.
November 2024
70
 Motilal Oswal Financial Services
India Strategy | Review 2QFY25
Top picks:
JSWE and PWGR
remain our preferred picks.
Surprises:
JSWE, IEX.
Misses:
PWGR, NTPC, TPWR.
Guidance highlights:
JSWE:
Management maintained its full-year capex guidance of INR150b and highlighted that the locked-in
capacity stands at 19.2GW and only 3.5GW capacity is awaiting PPA. Management also highlighted that
transmission and land-related visibility has been achieved for 80% of the pipeline, which has secured PPAs.
Construction of its 1GWh battery project remains on track for completion by Jun’25. The target to reach 10GW
in operational capacity was revised to FY25-end (from CY24-end earlier).
PWGR:
Management increased FY25 capex guidance marginally to INR200b (INR180b previously), capex and
capitalization guidance for FY26 was INR250-300b, while capitalization for FY27 was guided at INR400b. It was
highlighted that assuming a ~50% win rate, PWGR could secure INR1.92t in upcoming project bids under NEP
2032, in addition to its current INR1.43t order book, implying a minimum cumulative capex of INR3t by 2032.
PWGR management highlighted a total capex potential of INR6.6t in Inter-State Transmission Systems, where
PWGR holds a leading 50-60% market share. Management also highlighted six upcoming HVDC projects and
three cross-border linkage projects (India-Bangladesh, India-Myanmar, and India-Sri Lanka), in which PWGR
remains well-placed to compete and execute.
NTPC:
Management guided that NTPC will add 2.7GW/8.0GW thermal capacities in FY25/FY26. Thermal pipeline
beyond FY26 includes 8.8GW of projects with PPA visibility likely to be achieved by the end of CY24 for this
pipeline. NTPC targets to award an additional thermal capacity of 13.6GW by FY26-27, complementing the
11.16GW already under construction. For FY25, the guided standalone capital outlay stands at INR227b, while
the consolidated capital outlay is INR279b. The current year is expected to see a capacity addition of 3GW in
renewables, with projections of 5GW next year and 8GW in the following year. The company aims to achieve a
RE capacity target of 60GW by FY32, all under NTPC Green Energy. Management expressed confidence in the
timely execution of its RE projects.
TPWR:
Management has reiterated its target of INR110b revenue in FY27 for the EPC business and highlighted
that a large proportion of the current EPC Order Book (OB) projects is expected to be implemented in Q3-
Q4FY25. 5GW of under-construction renewable energy projects will be executed by FY26. The board had
approved an investment in the 1,000 MW PSP project, the work for which will start from 1st Jan’25 and all
necessary approvals for the project have been received barring one. 4.3 GW for cell and module manufacturing
-
full stabilization for the cell line is expected to be achieved by Nov’24-end and by Dec’24 end, both plants should
be producing at full capacity.
IEX:
Management highlighted its commitment to maintaining high dividend payouts (65%-70%). Approval for the
11-month contract and the Green RTM market are expected to enhance trading opportunities.
Exhibit 138: Key Snapshot
Total generation growth (%)
Conv. Generation growth (%)
RE generation growth (%)
Capacity addition (GW)
Net Coal
Solar
Wind
Total capacity addition
FY18
5.4
4.1
24.9
6.0
9.4
1.8
17.2
FY19
5.2
3.6
24.4
3.6
6.5
1.6
12.1
FY20
0.7
0.0
7.8
4.1
6.4
2.1
14.0
FY21
-0.6
-1.6
7.7
4.2
5.5
1.6
12.0
FY22
8.1
7.1
16.2
1.4
13.9
1.1
17.3
FY23
9.0
7.7
19.1
1.2
12.8
2.3
16.6
FY24
7.2
6.7
10.9
1QFY25
10.9
11.5
7.0
2QFY25
1.3
0.3
7.3
5.7
0.0
0.1
15.0
3.7
5.3
3.3
0.8
0.7
25.9
4.2
6.5
Source: Company, MOFSL
November 2024
71
 Motilal Oswal Financial Services
India Strategy | Review 2QFY25
Exhibit 139: India’s power generation
India's Power generation (BU)
9
-3
-1
5
-9
10
3
7
12
2
-2
-10
-20
-1
4
-7
Addition in Power generation (BU)
11
12
6
-5
-3
13
-6
-4
-13
Source: Company, MOFSL
Exhibit 140: India’s power generation capacity (GW)
Source: Company, MOFSL
Exhibit 141: India peak demand
Peak Demand (GW)
29.8
18.0
3.7
-13.3
Addition in Peak demand (GW)
25.7
4.4
-15.1
-21.1 -17.4
9.0 9.7
14.1
-1.3 -0.3 2.4
-5.3
-17.7
-10.3
1.4
6.1
6.8
5.6
2.4
-1.3 -1.9
Source: Company, MOFSL
Exhibit 142: India’s power demand growth
Total Generation including RE (BU)
9%
9%
5%
4% 5%
6% 6% 5% 5%
1%
-1%
% growth
9%
8%
7%
Exhibit 143: Peak demand growth
Peak Demand (GW)
243
190
216
8%
203
119 122
130 135 136
148 153
160 164
177 184
Source: Company, MOFSL
November 2024
72
 Motilal Oswal Financial Services
India Strategy | Review 2QFY25
ANNEXURE:
MOFSL UNIVERSE (ACTUAL V/S EXPECTATIONS)
Sales (INR b)
Gr (%)
Var. over
Sep-24 YoY QoQ Exp. (%)
2,872.9 3.8 -1.2
0.1
31.4
11.6 0.1
1.4
64.4
2.5
1.6
0.3
87.7
-9.0 2.0
-0.9
131.3 21.8 10.1
0.3
24.6
9.7 -10.1
0.1
22.5
-0.1 -3.9
-8.3
43.9
6.4
1.8
-1.5
33.0
8.2
3.5
0.2
21.3
-6.4 -6.9
-3.2
12.1
3.0
5.5
-0.2
42.6
3.6 -3.0
-3.8
29.1
14.4 3.1
0.7
24.8
0.5 -11.6
18.5
42.7
3.9 -1.1
-3.8
3.6
5.3
5.8
1.2
104.6 10.8 3.1
2.2
275.5 12.9 1.9
1.2
372.0
0.4
4.7
-0.1
23.3
10.5 6.4
1.4
67.6
11.1 -4.5
-0.8
278.1 18.2 -3.7
-3.2
9.3
17.0 3.6
5.5
1,014.5 -3.5 -6.1
1.3
20.6
4.8
5.3
-2.5
92.3
13.3 10.2
-3.4
868.9 18.9 11.0
5.6
29.1
5.2
2.9
-15.1
45.8
14.8 9.2
-3.1
24.9
31.2 8.2
11.3
15.5
26.5 17.1
-0.7
41.4
7.6 11.1
0.6
51.1
13.7 13.3
2.0
11.9
12.8 -11.1
-2.1
615.5 20.6 11.7
8.4
26.1
13.4 19.6
1.9
5.0
29.2 8.2
2.7
2.4
277.4 -4.8
20.8
510.0 -2.3 -9.8
1.1
46.1
3.9 -10.6
6.9
75.2
1.2 -9.6
5.9
19.5 -14.6 -10.9
0.6
30.9
-2.0 -14.7
-1.1
76.2
18.3 10.6
0.9
10.2 -16.8 4.6
16.9
25.6
-7.0 -8.8
-4.5
12.3 -21.6 -21.1
-12.5
20.4 -12.5 -2.4
2.4
37.3 -18.3 -22.9
-2.2
156.3 -2.4 -13.5
0.0
168.2
8.2
2.9
-1.2
4.1
17.8 3.8
4.3
13.9
16.7 5.4
1.6
EBITDA (INR b)
Gr (%)
Var. over
YoY QoQ Exp. (%) Sep-24
-1.5 -10.3
-4.9
216.6
7.5
2.4
-1.1
2.4
-24.3 -3.5
-6.3
3.0
-5.8
11.7
-0.6
6.9
24.3
9.8
2.1
22.2
12.9 -13.3
5.1
3.5
-0.2
-6.4
-9.8
3.5
14.1
7.9
4.8
5.0
-20.6 -5.4
-4.5
1.2
-4.3
-8.2
0.0
1.9
-18.8 -2.3
-10.7
0.6
0.1
-6.7
-8.3
11.0
20.0
2.1
0.0
2.0
0.3
-27.6
-7.2
3.3
0.1
-2.2
-7.2
3.0
12.4
8.0
5.5
0.7
14.1
3.8
3.3
12.0
26.4
-1.8
7.2
38.4
-7.7
-1.9
-3.8
39.1
0.6
4.5
-7.1
1.5
-13.8 -14.4
-4.9
4.6
23.1 -11.8
-9.7
7.5
14.2
1.5
5.3
1.5
-14.5 -24.3
-11.5
33.4
-2.1
2.5
-7.0
1.7
20.0 12.5
1.8
6.6
20.4 16.6
5.8
61.1
23.2
-0.4
-18.1
4.4
38.2 48.2
26.0
10.9
42.1
2.9
8.0
4.5
68.0 129.1
-14.5
0.5
13.1 11.0
-1.5
1.3
16.7 18.4
-3.2
0.9
67.3 -16.5
12.6
1.1
13.0 13.3
5.5
34.0
35.8 96.9
5.9
2.0
49.8 16.5
11.4
0.9
264.9 -23.0
13.4
0.7
-28.4 -31.3
-2.5
22.7
-21.7 -36.6
-0.2
2.3
-14.6 -13.2
38.3
5.3
-38.7 -31.4
4.6
-0.3
-26.3 -35.1
-4.6
0.6
-45.2
0.0
-17.2
7.6
PL
Loss
Loss
-2.5
-39.2 -41.6
-21.7
0.4
-58.9 -59.9
-41.7
-0.1
-21.7 -2.3
26.0
0.3
-31.9 -35.3
-3.5
0.9
-20.9 -33.6
-7.1
8.2
-0.5
2.1
-2.8
17.7
52.3
-7.0
3.6
0.5
56.4
8.7
1.9
1.4
PAT (INR b)
Gr (%)
Var. over
YoY QoQ Exp. (%)
5.8
-2.8
-1.8
6.3
-1.6
-4.0
-37.6 -9.2
-19.6
20.2 31.9
9.3
20.7 11.4
2.7
4.3
-26.8
-4.2
0.1
-7.3
-13.2
29.2
6.7
-2.0
-41.4 -18.0
-20.0
4.3
-10.0
0.1
-34.7 16.0
-21.4
8.3
-0.1
2.3
31.3
-0.4
-0.1
53.2
7.6
24.1
3.8
6.5
-2.0
20.6
4.3
1.7
14.2
7.2
6.8
13.2 47.0
14.1
5.1
7.0
5.7
-2.4
2.2
-11.6
-20.4 -19.0
-4.3
65.7 -24.9
-21.0
20.2
9.1
12.9
-13.6 -39.6
-21.7
-7.5
8.6
-12.1
23.5 14.8
2.4
17.2 21.3
5.5
21.7
-0.5
-18.3
34.3 40.6
18.2
37.2
7.3
10.4
111.4 401.8
-28.2
17.1 13.1
-5.1
53.1
-2.5
-14.4
89.6 -17.6
18.0
5.4
21.9
6.0
24.9 81.0
10.3
41.4 13.2
7.9
276.1 -12.1
31.7
-46.2 -32.9
-9.4
-39.1 -36.1
18.1
-33.2 -18.1
41.2
PL
PL
Loss
-53.8 -75.6
-3.6
-4.7
LP
-18.0
Loss
Loss
Loss
-80.0 -80.6
-60.3
PL
PL
PL
-74.7 -27.9
LP
-81.0 -70.7
26.2
-36.0 -50.9
-12.1
-4.0
8.9
1.1
74.2
-2.9
16.9
52.9 24.5
6.3
Company
Automobiles
Amara Raja Energy
Apollo Tyres
Ashok Leyland
Bajaj Auto
Balkrishna Inds
Bharat Forge
Bosch
CEAT
CIE Automotive
Craftsman Auto
Eicher Motors
Endurance Tech.
Escorts Kubota
Exide Inds.
Happy Forgings
Hero Motocorp
Mahindra & Mahindra
Maruti Suzuki
Motherson Wiring
MRF
Samvardhana Motherson
Sona BLW Precis.
Tata Motors
Tube Investments
TVS Motor
Capital Goods
ABB India
Bharat Electronics
Cummins India
Hitachi Energy
Kalpataru Proj.
KEC International
Kirloskar Oil
Larsen & Toubro
Thermax
Triveni Turbine
Zen Technologies
Cement
ACC
Ambuja Cements
Birla Corporation
Dalmia Bharat
Grasim Industries
India Cements
J K Cements
JK Lakshmi Cem.
Ramco Cements
Shree Cement
Ultratech Cement
Chemicals-Specialty
Alkyl Amines
Atul
Sep-24
368.6
4.4
8.8
10.2
26.5
6.2
6.1
5.6
3.6
3.3
1.9
10.9
3.8
2.7
4.8
1.1
15.2
39.5
44.2
2.5
9.7
24.5
2.5
117.4
2.5
10.8
101.8
5.4
13.9
4.8
1.1
3.5
3.2
1.6
63.6
2.8
1.1
0.8
56.1
4.3
11.1
1.8
4.3
3.3
-1.6
2.8
0.9
3.1
5.9
20.2
30.6
0.7
2.4
November 2024
73
 Motilal Oswal Financial Services
India Strategy | Review 2QFY25
Company
Clean Science
Deepak Nitrite
Fine Organic
Galaxy Surfactants
Navin Fluorine
NOCIL
P I Industries
SRF
Tata Chemicals
Vinati Organics
Consumer
Asian Paints
Britannia
Colgate
Dabur
Emami
Godrej Consumer
Hind. Unilever
Indigo Paints
ITC
Jyothy Labs
Marico
Nestle
P&G Hygiene
Page Industries
Pidilite Inds.
Tata Consumer
United Breweries
United Spirits
Consumer Durables
Havells India
KEI Industries
Polycab India
R R Kabel
Voltas
EMS
Amber Enterp.
Avalon Tech
Cyient DLM
Data Pattern
Dixon Tech.
Kaynes Tech
Syrma SGS Tech.
Financials
Banks-Private
AU Small Finance
Axis Bank
Bandhan Bank
DCB Bank
Equitas Small Fin.
Federal Bank
HDFC Bank
ICICI Bank
IDFC First Bank
IndusInd Bank
Sales (INR b)
Gr (%)
Var. over
Sep-24 YoY QoQ Exp. (%) Sep-24
2.4
31.5 6.3
-1.0
0.9
20.3
14.3 -6.2
1.1
3.0
6.0
26.2 17.1
6.7
1.4
10.6
8.1
9.1
-0.6
1.3
5.2
9.9 -1.0
-2.6
1.1
3.6
3.4 -2.5
-7.2
0.4
22.2
4.9
7.4
-3.8
6.3
34.2
7.8 -1.1
-4.5
5.6
40.0
0.0
5.5
-0.6
6.2
5.5
19.5 5.4
3.3
1.3
869.6
6.5
0.0
0.9
203.8
80.3
-5.3 -10.5
-5.8
12.4
46.7
5.3
9.8
-1.5
7.8
16.2
10.1 8.2
-2.6
5.0
30.3
-5.5 -9.6
-0.3
5.5
8.9
3.0 -1.7
-2.0
2.5
36.7
1.8 10.0
-0.6
7.6
159.3
1.9
1.4
-0.4
37.9
3.0
7.4 -3.7
0.8
0.4
207.4 16.7 12.3
10.5
67.6
7.3
0.2 -1.1
-8.1
1.4
26.6
7.6
0.8
0.2
5.2
51.0
1.3
6.0
-4.5
11.9
11.4
-0.3 21.8
-8.6
2.9
12.5
10.8 -2.4
3.9
2.8
32.3
5.2 -4.7
-1.7
7.7
42.1
12.9 -3.2
-0.6
6.3
21.1
12.0 -14.5
1.8
2.3
28.4
-0.8 20.9
-3.3
5.1
167.5 19.9 -13.2
5.5
14.8
45.4
16.4 -21.8
5.4
3.8
22.8
17.1 10.6
0.9
2.2
55.0
30.4 17.0
10.4
6.3
18.1
12.5 0.1
-1.4
0.9
26.2
14.2 -46.8
5.1
1.6
153.8 103.9 37.2
16.9
7.9
16.8
81.7 -29.8
32.7
1.1
2.8
36.8 37.9
16.0
0.3
3.9
33.4 51.0
1.5
0.3
0.9
-16.0 -12.5
-29.4
0.3
115.3 133.3 75.3
21.0
4.3
5.7
58.5 13.5
-5.1
0.8
8.3
17.0 -28.2
-16.4
0.7
2,819.1 10.1 7.0
-1.6
1,660.1
925.2 11.3 1.1
0.0
706.3
19.7
58.1 2.8
0.1
11.3
134.8
9.5
0.3
-1.1
107.1
29.5
20.7 -1.9
-2.5
18.6
5.1
7.0
2.5
-2.1
2.6
8.0
4.8
0.1
-2.5
3.5
23.7
15.1 3.3
-0.6
15.7
301.1 10.0 0.9
1.0
247.1
200.5
9.5
2.5
0.6
167.2
47.9
21.2 2.0
-1.1
19.6
53.5
5.3 -1.1
-1.9
36.0
EBITDA (INR b)
Gr (%)
Var. over
YoY QoQ Exp. (%) Sep-24
19.8
-5.3
-16.8
0.6
-1.6
-3.8
12.3
1.9
36.9 17.4
6.3
1.1
2.2
2.9
-9.5
0.8
9.2
7.0
5.5
0.6
-16.6 -6.7
-19.1
0.4
13.9
7.7
2.7
5.1
-13.1 -9.7
-14.1
2.2
-24.5
7.7
-4.2
1.9
27.9
7.1
1.6
1.1
1.2
-5.5
-1.9
142.3
-27.8 -26.8
-17.5
8.7
-10.2
3.9
-15.9
5.3
3.2
-2.2
-11.7
3.6
-16.4 -15.6
0.0
4.3
7.2
15.7
0.5
2.3
5.3
4.9
1.9
5.0
-0.1
1.3
0.5
26.0
-1.5 -12.4
-4.9
0.2
4.8
0.2
0.7
49.9
2.3
3.7
-8.2
1.1
5.0
-16.6
0.2
4.1
-4.7
6.1
-11.4
7.5
2.0 121.2
-5.0
2.1
20.5 15.7
12.5
2.0
13.1
-5.4
0.9
5.4
16.6
-6.2
7.2
3.8
22.9 -20.3
8.2
1.3
7.8
10.7
3.7
3.4
7.1
-21.9
-12.9
10.5
0.5
-34.5
-25.3
2.7
8.2
2.8
-12.2
1.5
3.7
8.3
-4.5
4.4
-29.1 -9.7
-35.7
0.5
130.8 -61.7
10.7
1.3
82.2 27.9
11.1
3.9
90.9 -42.0
28.0
0.2
139.1 589.3
99.1
0.2
34.4 58.2
-2.0
0.2
-15.8 -7.7
-30.7
0.3
114.4 72.0
13.5
2.1
68.3 22.8
-7.8
0.6
44.8 59.1
18.0
0.4
19.1
6.4
3.8
984.6
14.0
2.7
1.8
437.2
80.0 18.9
12.9
5.7
24.1
6.0
4.6
69.2
17.2
-4.4
-0.7
9.4
21.2 24.2
14.0
1.6
5.9
2.7
-0.1
0.1
18.2
4.3
6.7
10.6
8.9
3.4
1.4
168.2
17.5
4.4
5.6
117.5
29.9
4.2
1.3
2.0
-7.9
-8.9
-10.3
13.3
PAT (INR b)
Gr (%)
Var. over
YoY QoQ Exp. (%)
12.6 -10.9
-24.3
-5.3
-4.1
14.8
42.5 14.3
10.5
9.4
6.3
-5.9
-2.9
14.9
14.6
54.3 52.3
32.3
5.8
13.2
14.8
-30.0 -16.9
-27.7
-44.8 43.7
-9.2
46.4 23.4
16.1
-0.2
-6.1
-3.9
-29.1 -26.4
-18.8
-9.3
0.4
-18.3
4.6
-2.3
-12.3
-17.2 -14.8
-0.9
18.6 37.0
8.9
12.2
6.5
2.9
-2.1
-1.6
-3.5
-10.6 -13.6
-1.5
2.0
-2.0
-2.5
1.0
3.3
-8.3
17.1 -10.9
10.1
-6.9
1.7
-16.8
0.6 133.3
-7.3
29.9 18.2
13.8
17.8
-5.3
1.2
10.2 26.9
14.3
22.9 -23.7
9.6
5.3
12.0
-0.2
13.0 -22.7
-12.3
7.5
-34.3
-24.7
10.4
3.0
-8.3
3.3
11.1
-3.6
-33.2 -23.1
-43.9
265.3 -59.9
8.3
80.3 24.0
2.2
LP
-73.4
104.8
140.1
LP
150.1
5.5
45.8
-21.7
-10.4 -7.7
-27.8
99.8 60.4
1.0
86.4 18.6
-9.7
22.0 87.8
30.3
15.3
4.0
3.9
5.2
0.9
0.3
42.1 13.7
16.0
18.0 14.6
4.4
30.0 -11.9
7.1
22.6 18.4
15.1
-93.5 -50.0
-92.8
10.8
4.7
5.2
5.3
4.0
2.9
14.5
6.2
7.7
-73.3 -70.5
-64.8
-39.5 -38.7
-35.5
November 2024
74
 Motilal Oswal Financial Services
India Strategy | Review 2QFY25
Company
Kotak Mahindra Bank
RBL Bank
SBI Cards
Banks-PSU
Bank of Baroda
Canara Bank
Indian Bank
Punjab National Bank
State Bank
Union Bank
Insurance
HDFC Life Insur.
ICICI Lombard
ICICI Pru Life
Max Financial
SBI Life Insurance
Star Health
NBFC - Lending
AAVAS Financiers
Bajaj Finance
Can Fin Homes
Chola. Inv & Fin.
CreditAccess
Five-Star Business
Home First Fin.
IIFL Finance
L&T Finance
LIC Housing Fin
M & M Financial
Manappuram Finance
MAS Financial
Muthoot Finance
PNB Housing
Poonawalla Fincorp
Repco Home Fin
Shriram Finance
Spandana Sphoorty
NBFC - Non Lending
360 ONE WAM
Angel One
BSE
Cams Services
MCX
Healthcare
Ajanta Pharma
Alembic Pharma
Alkem Lab
Apollo Hospitals
Aurobindo Pharma
Biocon
Cipla
Divis Labs
Dr Reddy’ s Labs
ERIS Lifescience
Gland Pharma
Sales (INR b)
Gr (%)
Var. over
Sep-24 YoY QoQ Exp. (%)
70.2
11.5 2.6
1.0
16.1
9.5 -5.0
-3.2
15.0
15.8 1.7
0.8
883.2
5.1
0.4
-0.8
116.2
7.3
0.2
0.8
93.2
4.6
1.6
1.2
61.9
7.9
0.3
-0.7
105.2
6.0
0.4
-3.5
416.2
5.4
1.2
0.0
90.5
-0.9 -3.9
-5.2
655.3 10.1 31.6
-5.5
165.7 12.3 32.5
-9.4
50.3
16.7 11.6
3.4
120.8 15.8 45.8
2.8
77.4
16.8 43.3
-10.7
204.1
1.2 31.1
-7.9
37.0
15.5 5.2
2.0
325.8 18.2 3.6
-0.1
2.4
8.8 -1.1
-4.9
88.4
22.8 5.6
-0.2
3.4
7.3
5.7
3.8
27.1
34.6 5.4
0.4
9.3
22.2 0.7
2.3
5.2
29.6 6.9
0.4
1.6
18.6 7.0
0.5
13.4
-6.0 -6.9
4.3
21.8
18.1 3.7
-2.0
19.7
-6.3 -0.8
-3.1
18.1
14.1 1.5
-1.9
16.4
20.8 6.3
3.4
1.9
26.0 9.4
2.4
25.2
35.5 9.2
3.7
6.6
2.5
3.1
-0.6
5.6
17.8 -2.9
-8.5
1.7
-2.3 -1.3
-3.9
54.6
18.9 4.4
-0.3
3.5
10.4 -19.7
-5.3
29.6
59.6 10.2
0.1
5.9
37.7 -1.9
-6.7
9.8
44.9 6.8
-2.2
7.5
137.3 22.8
5.1
3.7
32.7 10.2
6.0
2.9
73.0 21.9
4.6
870.9 10.5 4.0
1.7
11.9
15.4 3.6
4.2
16.5
3.3
5.5
1.4
34.1
-0.7 12.6
-1.4
55.9
15.3 9.9
3.6
78.0
8.0
3.0
6.3
35.9
3.7
4.6
-1.2
70.5
5.6
5.3
0.4
23.4
22.5 10.4
6.1
80.2
16.5 4.5
2.6
7.4
46.7 3.0
-2.2
14.1
2.4
0.3
0.2
Sep-24
51.0
9.1
17.6
661.2
94.8
76.5
47.3
68.5
292.9
81.1
31.3
9.4
-1.6
5.9
5.1
14.5
-1.9
245.4
1.9
73.1
2.9
19.2
6.7
3.8
1.3
8.5
15.9
17.4
12.0
10.3
1.3
19.1
5.6
2.8
1.4
39.8
2.3
16.0
2.9
5.7
3.9
1.7
1.8
208.8
3.4
2.4
7.5
8.2
15.7
6.9
18.9
7.2
22.0
2.6
3.0
EBITDA (INR b)
Gr (%)
Var. over
YoY QoQ Exp. (%) Sep-24
10.6
-2.9
-4.1
33.4
24.5
5.9
8.4
2.2
13.3
-7.5
-9.2
4.0
25.2 10.0
8.6
393.1
18.2 32.3
26.2
52.4
0.5
0.5
5.1
40.1
9.9
5.0
2.9
27.1
10.2
4.1
-4.2
43.0
50.9 10.8
9.4
183.3
12.4
4.2
7.4
47.2
2.3
41.8
-13.1
21.6
17.1 30.6
-4.0
4.3
Loss Loss
Loss
6.9
1.6
24.2
-9.2
2.5
23.1 101.6
1.6
1.4
-2.7
49.5
-14.1
5.3
Loss
PL
Loss
1.1
18.1
4.1
0.5
119.8
19.5 14.9
2.7
1.5
25.2
5.2
1.8
40.1
6.5
3.0
2.2
2.1
35.3
3.9
-0.6
9.6
19.5
-5.2
-1.4
1.9
36.9
7.1
3.5
2.7
20.7
5.9
0.6
0.9
-8.9
24.1
35.0
-1.6
22.5
8.3
3.8
7.0
-8.3
-1.7
-4.3
13.3
26.9
5.4
1.4
3.7
19.2
5.3
2.5
5.7
23.9
8.5
1.1
0.8
42.7 11.6
6.5
12.5
1.3
3.1
-1.0
4.7
-16.8 -35.4
-36.7
-4.7
2.2
-0.9
-3.2
1.1
14.5
3.4
-4.1
20.7
-11.6 -20.6
-13.8
-2.2
89.0 23.2
2.7
12.9
35.8 -13.7
-19.4
2.5
40.5 44.2
5.1
4.2
192.2 37.0
21.0
3.5
39.4 13.6
6.3
1.2
LP
35.4
4.1
1.5
17.3
2.5
3.3
128.7
15.9
-6.5
-2.1
2.4
14.9
1.0
-12.4
1.4
0.8
23.7
-5.1
6.9
30.0 20.8
7.6
3.8
11.6
-7.6
1.3
8.2
-7.4
10.5
-4.6
0.4
8.8
9.9
1.7
13.0
43.5 15.1
6.9
4.9
10.3
3.5
1.4
13.6
46.0
5.8
-0.6
0.9
-8.3
12.3
8.0
1.6
PAT (INR b)
Gr (%)
Var. over
YoY QoQ Exp. (%)
4.8
-5.0
-5.1
-24.3 -40.1
-11.8
-32.9 -32.0
-31.4
33.5 13.2
13.9
23.2 17.5
13.8
11.3
2.8
5.7
36.2 12.6
6.4
145.1 32.4
24.3
27.9
7.6
11.7
34.4 28.3
27.4
16.0
-5.2
-1.2
14.9
-9.3
3.2
20.2 19.6
-2.2
3.1
11.7
-6.8
-11.2 -10.6
21.6
39.3
1.9
2.9
-11.2 -65.1
-28.9
0.6
-9.8
-9.8
21.5 17.3
4.9
12.9
2.5
-0.3
33.8
5.9
0.6
26.3
2.2
-2.2
-46.4 -53.2
-28.8
34.4
6.5
2.5
24.1
5.1
1.0
PL
PL
PL
17.1
1.6
0.0
11.9
2.2
11.1
57.1 -28.0
-14.7
2.0
2.8
2.2
27.6
8.7
3.1
26.3 16.0
-3.9
22.6
8.5
6.1
PL
PL
PL
14.7
6.7
3.7
18.2
4.5
0.4
PL
PL
Loss
91.9 26.8
3.7
33.4
1.5
-16.5
39.1 44.7
5.4
192.2 30.9
19.4
44.2 13.0
5.5
LP
38.5
7.4
17.0
1.5
1.6
26.5 -10.2
-2.3
3.6
5.8
-16.8
2.0
26.3
4.9
63.5 24.1
4.8
5.1
-9.3
-0.9
-74.7
LP
42.7
10.9 10.6
5.9
38.3 14.3
2.8
2.4
-2.4
-4.5
-25.8 10.1
-7.3
-15.8 13.7
5.1
November 2024
75
 Motilal Oswal Financial Services
India Strategy | Review 2QFY25
Company
Glenmark Pharma
Global Health
Granules India
GSK Pharma
Ipca Labs.
Laurus Labs
Lupin
Mankind Pharma
Max Healthcare
Piramal Pharma
Sun Pharma
Torrent Pharma
Zydus Lifesciences
Infrastructure
G R Infraproject
IRB Infra
KNR Constructions
Logistics
Adani Ports
Blue Dart Express
Concor
JSW Infra
Mahindra Logistics
Transport Corp.
TCI Express
VRL Logistics
Media
PVR Inox
Sun TV
Zee Entertainment
Metals
Coal India
Hindalco
Hindustan Zinc
JSPL
JSW Steel
Nalco
NMDC
SAIL
Tata Steel
Vedanta
Oil & Gas
Oil Ex OMCs
Aegis Logistics
BPCL
Castrol India
GAIL
Gujarat Gas
Gujarat State Petronet
HPCL
Indraprastha Gas
IOC
Mahanagar Gas
MRPL
Oil India
Sep-24
34.3
9.6
9.7
10.1
23.5
12.2
55.4
30.8
21.2
22.4
132.6
28.9
52.4
35.7
11.3
15.9
8.6
155.5
70.7
14.5
22.8
10.0
15.2
11.2
3.1
8.0
45.2
16.2
9.0
20.0
2,715.2
306.7
582.0
82.5
112.1
396.8
40.0
49.2
230.4
539.0
376.3
7,308.7
3,543.0
17.5
1,027.9
12.9
329.1
37.8
2.4
999.3
37.0
1,738.5
17.1
249.7
55.2
Sales (INR b)
Gr (%)
Var. over
YoY QoQ Exp. (%)
7.1
5.8
2.0
13.3 11.1
8.2
-18.7 -18.1
-1.1
5.6 24.1
3.8
15.8 12.5
3.5
-0.1 2.4
-4.3
10.0 -1.0
1.7
13.6 6.3
2.6
23.3 9.7
5.0
17.3 14.9
1.4
10.5 5.9
2.4
8.6
1.0
-3.8
19.9 -15.6
-4.0
-16.2 -21.9
-17.9
-28.3 -40.5
-32.9
-9.1 -14.4
-8.8
-9.1 4.5
-7.7
8.0
4.4
-2.9
6.3
1.6
-3.5
9.4
7.9
-2.6
4.2
8.9
-3.0
18.0 -0.8
-4.1
11.5 7.1
-2.8
12.8 7.2
0.8
-2.6 6.3
-7.3
12.7 9.9
0.7
-17.1 -1.6
-0.5
-18.9 36.2
3.2
-11.6 -29.5
2.5
-17.9 -6.1
-4.6
-1.4 -3.4
-0.5
-6.4 -15.9
-3.2
7.4
2.1
2.2
21.5 1.5
5.7
-8.5 -17.7
-15.9
-11.0 -7.6
-4.2
31.5 40.1
25.5
22.5 -9.1
1.6
-17.6 -4.0
-12.0
-3.2 -1.6
3.7
10.1 5.2
6.1
0.6 -5.8
-8.2
1.7 -0.5
-0.1
41.8 9.3
-15.7
-0.2 -9.1
-4.0
8.9 -7.8
-0.6
3.4 -2.3
-3.2
-1.7 -15.0
2.8
-47.5 -29.1
-23.1
4.4 -12.2
0.9
6.9
5.0
8.1
-3.3 -10.0
-26.3
9.0
7.7
11.8
29.8 7.4
9.9
-6.7 -5.5
-1.2
Sep-24
6.0
2.3
2.0
3.2
4.4
1.8
12.4
8.5
5.7
3.4
37.8
9.4
14.2
10.2
1.2
7.7
1.4
59.4
43.7
1.2
5.7
5.2
0.7
1.2
0.4
1.3
10.4
1.9
5.3
3.2
463.6
71.5
78.8
41.2
22.0
54.4
15.5
13.9
12.8
55.2
98.3
772.3
661.4
2.2
45.5
2.9
37.4
5.1
1.9
27.7
5.4
37.7
4.0
-4.3
21.8
EBITDA (INR b)
Gr (%)
Var. over
YoY QoQ Exp. (%) Sep-24
19.1
-1.4
-7.4
3.5
7.3
22.6
16.3
1.4
-4.5 -21.6
1.0
1.0
11.1 39.5
7.2
2.5
22.7 12.7
-6.0
2.3
-5.1
4.2
0.3
0.2
34.0
-9.2
7.0
7.7
24.5 17.4
7.0
6.5
17.1 14.8
4.8
3.7
28.6 67.2
31.4
0.2
25.1
7.2
8.2
29.3
13.8
1.6
-4.7
4.5
33.1 -32.9
9.1
8.8
-11.5 -17.5
-13.6
3.6
-39.5 -52.5
-47.2
1.2
-3.5 -10.5
-4.7
1.0
-17.0
1.8
-11.4
1.5
12.1
6.2
0.6
33.4
12.6
2.9
1.1
24.6
-6.6
11.4
-15.9
0.6
7.0
33.1
9.9
4.0
15.1
1.1
-7.1
2.6
23.9
0.2
-16.5
-0.1
16.6 12.8
-0.6
1.1
-27.1 12.3
-17.8
0.3
44.9 53.1
20.8
0.4
-29.8 10.3
7.0
6.2
-56.2
LP
10.4
0.2
-26.1 -25.1
-1.2
4.0
-3.5
18.2
21.4
2.0
9.0
-13.3
2.3
197.0
-19.6 -38.0
-27.7
62.9
40.5
5.1
20.3
42.7
31.3
4.5
6.7
24.1
-3.7 -22.5
-9.0
8.6
-31.1 -1.3
19.7
6.1
290.7 65.8
69.1
10.5
16.4 -40.8
-16.9
12.0
-40.0 -42.5
-15.4
-3.8
29.4 -17.5
17.8
4.5
46.3
-1.2
6.2
29.5
-32.9 -9.5
-14.3
370.1
-7.2
-4.1
-3.7
349.6
7.5
-3.6
-17.2
1.3
-65.1 -19.6
-41.9
24.0
6.5
-11.3
-5.7
2.1
7.3
-17.3
-0.3
26.7
3.5
-4.0
9.5
3.1
-53.0 -35.9
-18.4
3.9
-67.7 33.1
-40.9
6.3
-18.4 -7.9
-8.6
4.3
-83.0 -56.3
-57.4
-9.8
-16.8 -4.8
-7.3
2.8
PL
PL
PL
-6.8
-12.3 -11.5
-10.6
18.3
PAT (INR b)
Gr (%)
Var. over
YoY QoQ Exp. (%)
153.5 -0.6
2.3
9.4
28.8
19.3
-4.8 -27.8
4.2
13.9 35.9
7.1
36.4 19.9
-5.5
-46.3 56.5
16.9
55.5 -14.5
11.8
30.4 14.5
9.1
4.9
19.9
-2.7
348.2
LP
-11.3
21.9
1.9
2.2
17.4
-3.8
-11.2
19.1 -38.9
-0.2
14.0 -11.2
13.2
-5.8 -38.6
-19.3
4.3
-28.6
16.1
47.9 82.9
61.7
10.3
-0.5
-3.6
10.9
-6.5
-3.7
-14.8 17.9
-21.7
10.7 55.1
17.4
4.7
-11.8
-18.1
Loss
Loss
PL
22.3 16.9
6.5
-29.3 12.8
-16.9
84.4 166.7
38.3
-26.0 11.1
7.2
-89.2
LP
18.9
-12.7 -27.2
-3.2
15.1 35.4
34.8
3.1
-26.2
1.4
-21.9 -42.6
-22.1
97.3 25.4
35.7
39.4
2.8
8.2
-38.0 -35.7
-19.9
-80.1 -27.9
34.7
458.3 77.8
80.9
16.5 -39.1
-9.9
PL
PL
Loss
-35.8 -65.8
LP
504.8 -18.2
12.6
-40.7 -0.2
-11.9
-2.4
12.5
10.0
-0.8
-4.2
-5.0
-71.8 -20.5
-48.5
6.7
-10.7
-6.7
11.1
-1.9
13.9
3.1
-6.9
16.9
-26.8 83.6
103.3
-87.7 77.4
-72.7
-19.4
7.4
6.9
PL
PL
PL
-16.5 -0.6
-2.9
PL
PL
PL
-3.9
25.0
10.0
November 2024
76
 Motilal Oswal Financial Services
India Strategy | Review 2QFY25
Company
ONGC
Petronet LNG
Reliance Inds.
Real Estate
Brigade Enterpr.
DLF
Godrej Properties
Kolte Patil Dev.
Macrotech Developers
Mahindra Lifespace
Oberoi Realty
Phoenix Mills
Prestige Estates
SignatureGlobal
Sobha
Sunteck Realty
Retail
Aditya Birla Fashion
Avenue Supermarts
Barbeque Nation
Bata India
Campus Activewear
Devyani Intl.
Jubilant Foodworks
Kalyan Jewellers
Metro Brands
Relaxo Footwear
Restaurant Brands
Sapphire Foods
Senco Gold
Shoppers Stop
Titan Company
Trent
Vedant Fashions
V-Mart Retail
Westlife Foodworld
Staffing
Quess Corp
SIS
Team Lease Serv.
Updater Services
Technology
Coforge
Cyient
HCL Technologies
Infosys
L&T Technology
LTIMindtree
Mphasis
Persistent Systems
TCS
Tech Mahindra
Wipro
Zensar Tech
Telecom
Sales (INR b)
Gr (%)
Var. over
Sep-24 YoY QoQ Exp. (%)
338.8 -3.6 -3.9
-3.7
130.2
3.9 -2.9
-7.1
2,315.4 -0.2 -0.1
0.4
134.8 31.9 11.5
0.6
10.7 -21.5 -0.5
-11.9
19.8
46.5 45.0
40.9
10.9 218.7 47.9
109.8
3.1
55.6 -9.5
-39.3
26.3
50.1 -7.8
-15.6
0.1
-57.2 -96.0
-91.4
13.2
8.4 -6.1
26.6
9.2
4.9
1.5
-0.4
23.0
3.0 23.8
0.5
7.5
660.5 87.0
-17.9
9.3
25.9 45.8
-7.4
1.7
577.3 -46.6
-53.9
534.6 18.4 4.5
0.1
36.4
12.9 6.3
-0.2
144.4 14.4 2.7
-0.1
3.1
1.3
0.0
0.7
8.4
2.2 -11.4
0.2
3.3
28.9 -1.7
8.3
12.2
49.1 0.0
4.8
14.7
9.1
1.9
0.1
60.7
37.4 9.6
2.5
5.9
5.4
1.6
1.0
6.8
-5.0 -9.2
-7.5
4.9
8.5
0.3
-0.9
7.0
8.3 -3.1
-0.2
15.0
30.9 6.9
3.0
10.7
4.2
3.3
-2.4
145.3 16.0 9.6
0.7
40.4
39.6 1.1
-5.7
2.7
22.7 11.7
9.7
6.6
20.3 -15.9
0.0
6.2
0.5
0.3
-1.6
119.2 11.5 4.9
-1.2
51.8
9.1
3.5
0.2
32.7
6.3
4.4
-5.3
28.0
23.1 8.4
2.0
6.8
13.3 4.3
-4.9
1,943.8 6.2
3.3
1.1
30.6
34.5 27.6
20.2
18.5
4.0 10.3
8.4
288.6
8.2
2.9
1.9
409.9
5.1
4.3
0.2
25.7
7.8
4.5
0.0
94.3
5.9
3.2
-0.3
35.4
7.9
3.3
0.8
29.0
20.1 5.8
0.7
642.6
7.7
2.6
0.5
133.1
3.5
2.4
1.6
223.0 -1.0 1.5
1.1
13.1
5.4
1.5
0.2
656.4
9.8
5.8
0.5
EBITDA (INR b)
PAT (INR b)
Gr (%)
Var. over
Gr (%)
Var. over
Sep-24
YoY QoQ Exp. (%) Sep-24 YoY QoQ Exp. (%)
182.4
-0.7
-2.0
-0.7
119.8
17.3 34.1
29.6
12.0
-1.2 -23.2
-8.5
8.5
3.6
-25.8
-4.6
390.6
-4.7
0.8
-1.7
165.6
-4.8
9.4
3.7
35.6
23.8
5.9
-9.0
27.1
45.0
-4.3
0.9
2.9
-10.1 -0.2
-22.7
1.2
-10.9 42.1
-32.7
5.0
8.6 119.6
-2.0
7.8
24.7 20.3
5.6
0.3
LP
LP
-62.2
3.3
359.5 -35.7
40.9
0.2
364.7 -41.8
-75.1
0.1
LP
56.3
-61.2
7.0
69.3
-6.9
-8.2
4.2
101.5 -11.9
-7.0
-0.5
Loss Loss
Loss
-0.1
Loss
PL
PL
8.1
27.5
-0.2
37.3
5.9
29.0
0.8
41.2
5.2
2.3
-2.5
-5.6
2.2
-13.7 -6.4
-9.5
6.3
6.5
-20.7
10.7
1.9
3.6
-17.4
120.3
-0.1
Loss Loss
PL
0.0
LP
-40.6
-97.5
0.8
2.2
37.9
-38.4
0.3
74.6 330.8
-56.4
0.4
LP
19.1
-60.6
0.3
LP
51.9
-46.5
56.5
12.5
0.7
-5.1
22.3
7.2
1.2
-8.7
3.6
11.8
0.8
3.5
-2.0
Loss
Loss
Loss
10.9
8.8
-10.4
-6.9
6.6
5.8
-14.8
-10.6
0.5
2.7
-10.4
0.1
-0.1
Loss
Loss
Loss
1.7
-3.9
-5.6
-10.3
0.5
-19.0 -38.8
-24.7
0.4
56.0 -26.2
-12.7
0.1
4368.7 -43.7
-22.9
2.0
25.2 -11.0
-4.4
0.0
PL
PL
PL
2.8
1.3
2.2
-0.1
0.5
-27.8
1.1
-2.0
4.0
26.3
5.4
-3.4
1.8
34.6
2.5
-14.5
1.5
-0.3 -14.2
-5.3
0.7
6.2
-22.2
-7.0
0.9
-4.2 -11.4
0.3
0.4
-16.9 -17.2
3.4
0.7
10.3 13.2
9.2
-0.2
Loss
Loss
Loss
1.1
-2.7
-9.8
0.1
0.1
-65.9 -36.7
59.9
0.8
107.1 -24.8
-15.8
0.3
188.7 -32.7
-21.4
1.5
-8.1
3.3
-12.3
-0.2
PL
Loss
Loss
15.3
8.2
22.4
-7.1
9.3
1.7
30.2
-14.1
6.4
39.0
4.9
-7.7
4.2
46.2 23.8
6.5
1.2
31.4
8.2
17.0
0.7
37.3
7.1
21.2
0.4
5664.2 -61.0
29.8
-0.6
Loss
PL
Loss
0.8
-21.1 -1.7
-7.6
0.0
-98.3 -88.5
-95.8
4.2
11.6
7.3
-5.9
2.1
9.0
9.1
-23.3
2.0
16.2
3.8
-0.8
0.9
25.3
6.2
-12.5
1.4
0.2
5.4
-15.4
0.7
-8.6
7.1
-41.0
0.3
5.4
50.4
5.1
0.2
-9.9
28.4
-18.3
0.4
47.8
6.8
0.2
0.3
41.8
9.2
5.9
434.9
6.7
4.1
2.2
300.2
8.3
2.9
1.1
4.6
33.6 48.1
11.7
2.0
11.8 51.8
-10.5
3.0
-9.0
11.8
-6.6
1.9
-1.0
26.4
-4.2
63.9
7.5
10.3
7.4
42.4
10.5
-0.5
8.6
97.6
3.1
4.3
3.9
65.1
4.7
2.2
-1.2
4.7
-2.0
2.1
-6.2
3.2
1.3
1.9
-7.7
17.0
4.2
5.8
-1.9
12.5
7.7
10.3
1.2
6.5
8.8
4.8
5.5
4.2
8.0
4.7
-1.7
4.8
18.6
5.6
3.1
3.2
23.4
6.1
0.6
167.7
6.7
0.3
-1.1
119.6
5.1
-1.2
-4.2
17.5
24.4 11.9
6.9
12.5
27.8 46.8
31.1
45.6
7.8
2.7
4.5
32.1
21.3
6.8
11.1
2.0
-12.9
2.5
4.4
1.6
-10.4 -1.3
11.2
323.8
14.7
9.6
2.4
-16.6
Loss Loss
Loss
November 2024
77
 Motilal Oswal Financial Services
India Strategy | Review 2QFY25
Company
Bharti Airtel
Indus Towers
Tata Comm
Vodafone Idea
Utilities
Indian Energy Exch.
JSW Energy
NTPC
Power Grid Corp.
Tata Power
Others
APL Apollo Tubes
Cello World
Coromandel International
Dreamfolks Services
EPL
Godrej Agrovet
Gravita India
Indiamart Inter.
Indian Hotels
Info Edge
Interglobe Aviation
Kajaria Ceramics
Lemon Tree Hotel
MTAR Tech
One 97 Comm.
UPL
Zomato
Sales (INR b)
Gr (%)
Var. over
Sep-24 YoY QoQ Exp. (%)
414.7 12.0 7.7
1.0
74.7
4.7
1.1
-1.0
57.7
18.4 2.4
0.6
109.3
2.0
4.0
-0.6
696.6
0.2 -6.8
-6.9
1.4
28.3 12.7
-0.4
32.4
4.8 12.4
-7.9
403.3 -1.3 -9.2
-3.3
102.6
5.3
1.9
-1.7
157.0 -0.3 -9.2
-17.7
564.8 10.5 6.2
9.8
47.7
3.1 -4.0
-9.2
4.9
0.2 -2.1
-7.2
74.3
6.4 57.2
6.3
3.2
12.2 -1.2
-8.8
10.9
8.4
7.8
-0.6
24.5
-4.8 4.2
-1.5
9.3
10.9 2.2
-7.7
3.5
18.0 5.0
-0.7
18.3
27.4 17.8
0.5
6.6
10.6 2.7
-0.9
169.7 13.6 -13.3
39.0
11.8
5.1
5.9
-0.1
2.8
25.2 6.1
1.6
1.9
14.0 48.3
-3.4
16.6 -34.1 10.6
2.8
110.9
9.0 22.3
4.1
48.0
68.5 14.1
0.3
Sep-24
218.5
48.6
11.2
45.5
240.1
1.2
16.8
96.8
87.9
37.5
68.2
1.4
1.2
9.7
0.2
2.2
2.2
1.0
1.3
5.0
2.7
23.8
1.6
1.3
0.4
-4.0
15.8
2.3
EBITDA (INR b)
Gr (%)
Var. over
YoY QoQ Exp. (%) Sep-24
12.0 10.9
0.9
39.1
42.2
8.0
11.2
14.2
10.0
-0.6
-5.0
1.8
6.2
8.2
2.7
-71.8
0.2
-8.7
-9.0
97.4
30.5 20.3
-1.8
1.1
-1.5
18.8
-12.7
8.5
-8.2 -22.3
-19.0
42.0
3.0
0.5
-3.8
35.0
21.2
4.4
14.6
10.8
2.1
-23.3
11.7
5.6
-57.5 -54.2
-20.8
0.5
-1.4
-8.2
-12.5
0.8
-7.9
92.7
5.7
6.6
-5.0
0.9
-27.0
0.2
21.8 18.7
2.9
0.9
10.9
-1.2
-2.1
1.0
27.2 11.3
0.5
0.7
69.0 12.9
23.9
1.4
41.3 11.5
1.3
3.2
13.8 10.0
1.6
1.9
-0.4 -58.7
31.1
-9.9
-11.6 -4.9
-12.0
0.8
28.3 13.6
5.6
0.3
2.0 121.7
-4.4
0.2
Loss Loss
Loss
-4.2
0.0
37.4
-6.4
-0.6
LP
27.7
71.0
1.8
PAT (INR b)
Gr (%)
Var. over
YoY QoQ Exp. (%)
32.2 33.7
-12.3
9.5
4.4
-22.3
-16.7 -25.4
-40.1
Loss
Loss
Loss
17.3
7.2
-5.9
28.0 13.6
3.5
19.0 63.5
20.1
28.9
0.2
-8.9
4.8
1.2
-3.4
20.0 31.6
-17.0
-70.5 -83.9
-23.1
-73.5 -72.1
-39.5
2.1
-1.1
-8.2
-12.3 113.5
2.7
-9.3
-6.5
-32.7
72.3 35.5
1.4
-9.0 -29.1
-25.3
24.4
6.9
0.6
95.7 18.8
39.9
94.1 30.5
31.8
-9.3 -16.5
-19.0
PL
PL
Loss
-21.9 -6.2
-21.8
30.9 49.6
11.5
-8.2 324.0
-15.8
Loss
Loss
Loss
PL
Loss
PL
388.9 -30.4
23.4
Investment in securities market are subject to market risks. Read all the related documents carefully before investing
November 2024
78
 Motilal Oswal Financial Services
REPORT GALLERY
RECENT STRATEGY/THEMATIC REPORTS
India Strategy | Review 2QFY25
November 2024
79
 Motilal Oswal Financial Services
India Strategy | Review 2QFY25
RECENT INITIATING COVERAGE REPORTS
November 2024
80
 Motilal Oswal Financial Services
India Strategy | Review 2QFY25
Explanation of Investment Rating
Investment Rating
BUY
SELL
NEUTRAL
UNDER REVIEW
NOT RATED
Expected return (over 12-month)
>=15%
< - 10%
< - 10 % to 15%
Rating may undergo a change
We have forward looking estimates for the stock but we refrain from assigning recommendation
*In case the recommendation given by the Research Analyst is inconsistent with the investment rating legend for a continuous period of 30 days, the Research Analyst shall be within following 30 days take
appropriate measures to make the recommendation consistent with the investment rating legend.
Disclosures
The following Disclosures are being made in compliance with the SEBI Research Analyst Regulations 2014 (herein after referred to as the Regulations).
Motilal Oswal Financial Services Ltd. (MOFSL) is a SEBI Registered Research Analyst having registration no. INH000000412. MOFSL, the Research Entity (RE) as defined in the Regulations, is engaged in
the business of providing Stock broking services, Depository participant services & distribution of various financial products. MOFSL is a listed public company, the details in respect of which are available on
www.motilaloswal.com. MOFSL (erstwhile Motilal Oswal Securities Limited - MOSL) is registered with the Securities & Exchange Board of India (SEBI) and is a registered Trading Member with National
Stock Exchange of India Ltd. (NSE) and Bombay Stock Exchange Limited (BSE), Multi Commodity Exchange of India Limited (MCX) and National Commodity & Derivatives Exchange Limited (NCDEX) for
its stock broking activities & is Depository participant with Central Depository Services Limited (CDSL) National Securities Depository Limited (NSDL),NERL, COMRIS and CCRL and is member of
Association of Mutual Funds of India (AMFI) for distribution of financial products and Insurance Regulatory & Development Authority of India (IRDA) as Corporate Agent for insurance products.
Details of
associate entities of Motilal Oswal Financial Services Limited are available on the website at
http://onlinereports.motilaloswal.com/Dormant/documents/List%20of%20Associate%20companies.pdf
MOFSL and its associate company(ies), their directors and Research Analyst and their relatives may; (a) from time to time, have a long or short position in, act as principal in, and buy or sell the securities or
derivatives thereof of companies mentioned herein. (b) be engaged in any other transaction involving such securities and earn brokerage or other compensation or act as a market maker in the financial
instruments of the company(ies) discussed herein or act as an advisor or lender/borrower to such company(ies) or may have any other potential conflict of interests with respect to any recommendation and
other related information and opinions.; however the same shall have no bearing whatsoever on the specific recommendations made by the analyst(s), as the recommendations made by the analyst(s) are
completely independent of the views of the associates of MOFSL even though there might exist an inherent conflict of interest in some of the stocks mentioned in the research report.
MOFSL and / or its affiliates do and seek to do business including investment banking with companies covered in its research reports. As a result, the recipients of this report should be aware that MOFSL
may have a potential conflict of interest that may affect the objectivity of this report. Compensation of Research Analysts is not based on any specific merchant banking, investment banking or brokerage
service
transactions.
Details
of
pending
Enquiry
Proceedings
of
Motilal
Oswal
Financial
Services
Limited
are
available
on
the
website
at
https://galaxy.motilaloswal.com/ResearchAnalyst/PublishViewLitigation.aspx
A graph of daily closing prices of securities is available at
www.nseindia.com, www.bseindia.com.
Research Analyst views on Subject Company may vary based on Fundamental research and Technical
Research. Proprietary trading desk of MOFSL or its associates maintains arm’s length distance with Research Team as all the activities are segregated from MOFSL research activity and therefore it can
have an independent view with regards to Subject Company for which Research Team have expressed their views.
Regional Disclosures (outside India)
This report is not directed or intended for distribution to or use by any person or entity resident in a state, country or any jurisdiction, where such distribution, publication, availability or use would be contrary
to law, regulation or which would subject MOFSL & its group companies to registration or licensing requirements within such jurisdictions.
For Hong Kong:
This report is distributed in Hong Kong by Motilal Oswal capital Markets (Hong Kong) Private Limited, a licensed corporation (CE AYY-301) licensed and regulated by the Hong Kong Securities and Futures
Commission (SFC) pursuant to the Securities and Futures Ordinance (Chapter 571 of the Laws of Hong Kong) “SFO”. As per SEBI (Research Analyst Regulations) 2014 Motilal Oswal Securities (SEBI Reg.
No. INH000000412) has an agreement with Motilal Oswal capital Markets (Hong Kong) Private Limited for distribution of research report in Hong Kong. This report is intended for distribution only to
“Professional Investors” as defined in Part I of Schedule 1 to SFO. Any investment or investment activity to which this document relates is only available to professional investor and will be engaged only with
professional investors.” Nothing here is an offer or solicitation of these securities, products and services in any jurisdiction where their offer or sale is not qualified or exempt fr om registration. The Indian
Analyst(s) who compile this report is/are not located in Hong Kong & are not conducting Research Analysis in Hong Kong.
For U.S.
Motilal Oswal Financial Services Limited (MOFSL) is not a registered broker - dealer under the U.S. Securities Exchange Act of 1934, as amended (the"1934 act") and under applicable state laws in the
United States. In addition MOFSL is not a registered investment adviser under the U.S. Investment Advisers Act of 1940, as amended (the "Advisers Act" and together with the 1934 Act, the "Acts), and
under applicable state laws in the United States. Accordingly, in the absence of specific exemption under the Acts, any brokerage and investment services provided by MOFSL, including the products and
services described herein are not available to or intended for U.S. persons. This report is intended for distribution only to "Major Institutional Investors" as defined by Rule 15a-6(b)(4) of the Exchange Act
and interpretations thereof by SEC (henceforth referred to as "major institutional investors"). This document must not be acted on or relied on by persons who are not major institutional investors. Any
investment or investment activity to which this document relates is only available to major institutional investors and will be engaged in only with major institutional investors. In reliance on the exemption
from registration provided by Rule 15a-6 of the U.S. Securities Exchange Act of 1934, as amended (the "Exchange Act") and interpretations thereof by the U.S. Securities and Exchange Commission
("SEC") in order to conduct business with Institutional Investors based in the U.S., MOFSL has entered into a chaperoning agreement with a U.S. registered broker-dealer, Motilal Oswal Securities
International Private Limited. ("MOSIPL"). Any business interaction pursuant to this report will have to be executed within the provisions of this chaperoning agreement.
The Research Analysts contributing to the report may not be registered /qualified as research analyst with FINRA. Such research analyst may not be associated persons of the U.S. registered broker-dealer,
MOSIPL, and therefore, may not be subject to NASD rule 2711 and NYSE Rule 472 restrictions on communication with a subject company, public appearances and trading securities held by a research
analyst account.
For Singapore
In Singapore, this report is being distributed by Motilal Oswal Capital Markets (Singapore) Pte. Ltd. (“MOCMSPL”) (UEN 201129401Z), which is a holder of a capital markets services license and an exempt
financial adviser in Singapore.This report is distributed solely to persons who (a) qualify as “institutional investors” as defined in section 4A(1)(c) of the Securities and Futures Act of Singapore (“SFA”) or (b)
are considered "accredited investors" as defined in section 2(1) of the Financial Advisers Regulations of Singapore read with section 4A(1)(a) of the SFA. Accordingly, if a recipient is neither an “institutional
investor” nor an “accredited investor”, they must immediately discontinue any use of this Report and inform MOCMSPL .
In respect of any matter arising from or in connection with the research you could contact the following representatives of MOCMSPL. In case of grievances for any of the services rendered by MOCMSPL
write to grievances@motilaloswal.com.
Nainesh Rajani
Email: nainesh.rajani@motilaloswal.com
Contact: (+65) 8328 0276
.
Specific Disclosures
1 MOFSL, Research Analyst and/or his relatives does not have financial interest in the subject company, as they do not have equity holdings in the subject company.
2 MOFSL, Research Analyst and/or his relatives do not have actual/beneficial ownership of 1% or more securities in the subject company
3 MOFSL, Research Analyst and/or his relatives have not received compensation/other benefits from the subject company in the past 12 months
4 MOFSL, Research Analyst and/or his relatives do not have material conflict of interest in the subject company at the time of publication of research report
5 Research Analyst has not served as director/officer/employee in the subject company
6 MOFSL has not acted as a manager or co-manager of public offering of securities of the subject company in past 12 months
7 MOFSL has not received compensation for investment banking/ merchant banking/brokerage services from the subject company in the past 12 months
8 MOFSL has not received compensation for other than investment banking/merchant banking/brokerage services from the subject company in the past 12 months
9 MOFSL has not received any compensation or other benefits from third party in connection with the research report
10 MOFSL has not engaged in market making activity for the subject company
********************************************************************************************************************************
The associates of MOFSL may have:
-
financial interest in the subject company
-
actual/beneficial ownership of 1% or more securities in the subject company at the end of the month immediately preceding the date of publication of the Research Report or date of the public
appearance.
-
received compensation/other benefits from the subject company in the past 12 months
-
any other potential conflict of interests with respect to any recommendation and other related information and opinions.; however the same shall have no bearing whatsoever on the specific
recommendations made by the analyst(s), as the recommendations made by the analyst(s) are completely independent of the views of the associates of MOFSL even though there might exist an
inherent conflict of interest in some of the stocks mentioned in the research report.
-
acted as a manager or co-manager of public offering of securities of the subject company in past 12 months
November 2024
81
 Motilal Oswal Financial Services
India Strategy | Review 2QFY25
-
be engaged in any other transaction involving such securities and earn brokerage or other compensation or act as a market maker in the financial instruments of the company(ies) discussed herein or
act as an advisor or lender/borrower to such company(ies)
-
received compensation from the subject company in the past 12 months for investment banking / merchant banking / brokerage services or from other than said services.
-
Served subject company as its clients during twelve months preceding the date of distribution of the research report.
-
The associates of MOFSL has not received any compensation or other benefits from third party in connection with the research report
Above disclosures include beneficial holdings lying in demat account of MOFSL which are opened for proprietary investments only. While calculating beneficial holdings, It does not consider demat accounts
which are opened in name of MOFSL for other purposes (i.e holding client securities, collaterals, error trades etc.). MOFSL also earns DP income from clients which are not considered in above disclosures.
Analyst Certification
The views expressed in this research report accurately reflect the personal views of the analyst(s) about the subject securities or issues, and no part of the compensation of the research analyst(s) was, is,
or will be directly or indirectly related to the specific recommendations and views expressed by research analyst(s) in this report.
Terms & Conditions:
This report has been prepared by MOFSL and is meant for sole use by the recipient and not for circulation. The report and information contained herein is strictly confidential and may not be altered in any
way, transmitted to, copied or distributed, in part or in whole, to any other person or to the media or reproduced in any form, without prior written consent of MOFSL. The report is based on the facts, figures
and information that are considered true, correct, reliable and accurate. The intent of this report is not recommendatory in nature. The information is obtained from publicly available media or other sources
believed to be reliable. Such information has not been independently verified and no guaranty, representation of warranty, express or implied, is made as to its accuracy, completeness or correctness. All
such information and opinions are subject to change without notice. The report is prepared solely for informational purpose and does not constitute an offer document or solicitation of offer to buy or sell or
subscribe for securities or other financial instruments for the clients. Though disseminated to all the customers simultaneously, not all customers may receive this report at the same time. MOFSL will not
treat recipients as customers by virtue of their receiving this report.
Disclaimer:
The report and information contained herein is strictly confidential and meant solely for the selected recipient and may not be altered in any way, transmitted to, copied or distributed, in part or in whole, to
any other person or to the media or reproduced in any form, without prior written consent. This report and information herein is solely for informational purpose and may not be used or considered as an
offer document or solicitation of offer to buy or sell or subscribe for securities or other financial instruments. Nothing in this report constitutes investment, legal, accounting and tax advice or a representation
that any investment or strategy is suitable or appropriate to your specific circumstances. The securities discussed and opinions expressed in this report may not be suitable for all investors, who must make
their own investment decisions, based on their own investment objectives, financial positions and needs of specific recipient. This may not be taken in substitution for the exercise of independent judgment
by any recipient. Each recipient of this document should make such investigations as it deems necessary to arrive at an independent evaluation of an investment in the securities of companies referred to in
this document (including the merits and risks involved), and should consult its own advisors to determine the merits and risks of such an investment. The investment discussed or views expressed may not
be suitable for all investors. Certain transactions -including those involving futures, options, another derivative products as well as non-investment grade securities - involve substantial risk and are not
suitable for all investors. No representation or warranty, express or implied, is made as to the accuracy, completeness or fairness of the information and opinions contained in this document. The Disclosures
of Interest Statement incorporated in this document is provided solely to enhance the transparency and should not be treated as endorsement of the views ex pressed in the report. This information is subject
to change without any prior notice. The Company reserves the right to make modifications and alternations to this statement as may be required from time to time without any prior approval. MOFSL, its
associates, their directors and the employees may from time to time, effect or have effected an own account transaction in, or deal as principal or agent in or for the securities mentioned in this document.
They may perform or seek to perform investment banking or other services for, or solicit investment banking or other business from, any company referred to in this report. Each of these entities functions as
a separate, distinct and independent of each other. The recipient should take this into account before interpreting the document. This report has been prepared on the basis of information that is already
available in publicly accessible media or developed through analysis of MOFSL. The views expressed are those of the analyst, and the Company may or may not subscribe to all the views expressed
therein. This document is being supplied to you solely for your information and may not be reproduced, redistributed or passed on, directly or indirectly, to any other person or published, copied, in whole or
in part, for any purpose. This report is not directed or intended for distribution to, or use by, any person or entity who is a citizen or resident of or located in any locality, state, country or other jurisdiction,
where such distribution, publication, availability or use would be contrary to law, regulation or which would subject MOFSL to any registration or licensing requirement within such jurisdiction. The securities
described herein may or may not be eligible for sale in all jurisdictions or to certain category of investors. Persons in whose possession this document may come are required to inform themselves of and to
observe such restriction. Neither the Firm, not its directors, employees, agents or representatives shall be liable for any damages whether direct or indirect, incidental, special or consequential including lost
revenue or lost profits that may arise from or in connection with the use of the information.
The person accessing this information specifically agrees to exempt MOFSL or any of its affiliates or employees
from, any and all responsibility/liability arising from such misuse and agrees not to hold MOFSL or any of its affiliates or employees responsible for any such misuse and further agrees to hold MOFSL or any
of its affiliates or employees free and harmless from all losses, costs, damages,
expenses that may be suffered by the person accessing this information due to any errors and delays.
This report is meant for the clients of Motilal Oswal only.
Investment in securities market are subject to market risks. Read all the related documents carefully before investing.
Registration granted by SEBI and certification from NISM in no way guarantee performance of the intermediary or provide any assurance of returns to investors.
Registered Office Address: Motilal Oswal Tower, Rahimtullah Sayani Road, Opposite Parel ST Depot, Prabhadevi, Mumbai-400025; Tel No.: 022 - 71934200 / 71934263; www.motilaloswal.com.
Correspondence Address: Palm Spring Centre, 2nd Floor, Palm Court Complex, New Link Road, Malad (West), Mumbai- 400 064. Tel No: 022 71881000. Details of Compliance Officer: Neeraj Agarwal,
Email Id: na@motilaloswal.com, Contact No.:022-40548085.
Grievance Redressal Cell:
Contact Person
Contact No.
Email ID
Ms. Hemangi Date
022 40548000 / 022 67490600
query@motilaloswal.com
Ms. Kumud Upadhyay
022 40548082
servicehead@motilaloswal.com
Mr. Ajay Menon
022 40548083
am@motilaloswal.com
Registration details of group entities.: Motilal Oswal Financial Services Ltd. (MOFSL): INZ000158836 (BSE/NSE/MCX/NCDEX); CDSL and NSDL: IN-DP-16-2015; Research Analyst: INH000000412 . AMFI:
ARN .: 146822. IRDA Corporate Agent – CA0579. Motilal Oswal Financial Services Ltd. is a distributor of Mutual Funds, PMS, Fixed Deposit, Insurance, Bond, NCDs and IPO products.
Customer having any query/feedback/ clarification may write to query@motilaloswal.com. In case of grievances for any of the services rendered by Motilal Oswal Financial Services Limited (MOFSL) write to
grievances@motilaloswal.com, for DP to dpgrievances@motilaloswal.com.
November 2024
82