Sector Update | 19 January 2025
Sector Update | Technology
NBFC: Power Finance
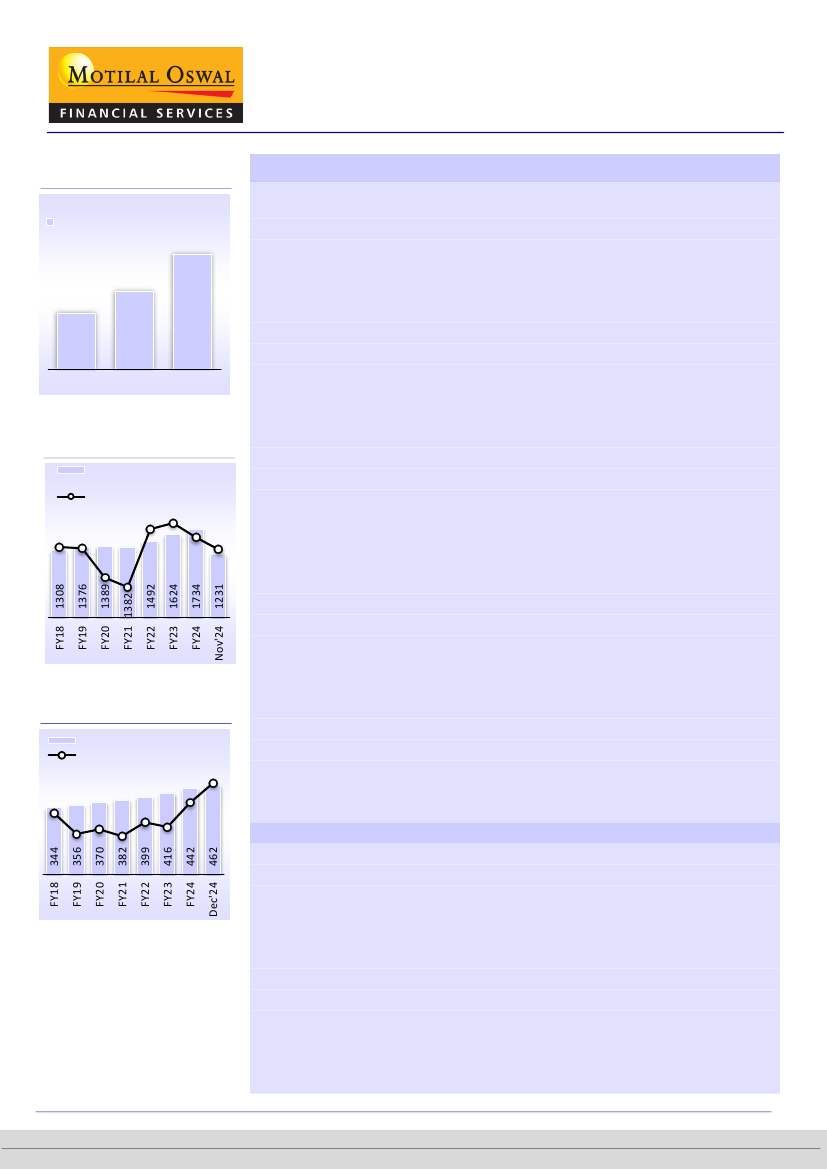
Total installed capacity to reach
900GW by FY32
India total installed capacity (GW)
900
610
442
Structural opportunity in power finance intact
Minor weakness in loan growth in the near term
Dec'24
Mar'27
Mar'32
Total energy demand grew ~5%
YoY as of Nov’24
Total generation including RE
(BU)
Growth YoY (%)
8 8.9
5.4 5.2
0.9
-0.5
6.8
5.0
Total installed capacity grew
~8% YoY as of Dec’24
Total Installed capacity (GW)
YoY Growth (%)
7.9
5.3
3.5 3.9
3.3
6.2
4.5 4.1
Power financiers, PFC and REC, have a structural opportunity to finance India’s
ambitious energy transition goals, which necessitate a projected capex of
~INR42t over the next decade to expand generation infrastructure.
Renewable energy (RE) will dominate the growth trajectory, with installed
capacity expected to reach 596GW by FY32, comprising ~66% of total capacity.
Transmission infrastructure, essential to support RE integration, will require
investments of INR9.2t by FY32.
PFC and REC collectively command ~44% market share in infrastructure
(including power) financing and have filled the gap left by traditional banks,
which have reduced their exposure to the power sector due to concerns over
asset quality. Having said that, RE financing still remains highly competitive, with
PFC/REC having to compete aggressively on pricing with banks.
Government policies, such as the revamped distribution sector scheme (RDSS)
and UDAY, are aimed at strengthening DISCOMs by improving operational
efficiency and financial sustainability. The power sector will benefit from
macroeconomic tailwinds, including rising energy demand (India’s power
demand to grow 8-9% over FY24-27E) and almost doubling of installed capacity
to ~900GW over the next decade. The inclusion of infrastructure and logistics
financing in PFC and REC's mandates has opened up avenues for diversification,
reducing dependence solely on the power sector.
Asset quality metrics of power financiers are improving, with GNPA ratios of
PFC/REC declining to 2.7%/2.5% as of Sep’24, which reflects a lower risk profile.
In the current power demand uptrend, many distressed power plants have been
acquired by larger players, resulting in the resolution of multiple stressed
projects. This trend is expected to continue, leading to further recoveries for
lenders like PFC and REC. We do not see risks of incremental additions to the
stress pool over the next 12-18 months, and this should keep credit costs benign
at <5bp in FY26E as well.
Our view on loan growth and asset quality in the near term
Loan growth
REC delivered loan growth of ~15% YoY as of Sep’24. With this, generation grew
~19% YoY, transmission remained flat YoY, and distribution rose ~5% YoY. Over
the last two years, distribution in the loan mix has remained largely flat at ~40%,
RE loans have clocked a ~37% CAGR, and RE in the loan mix now forms ~9%.
PFC delivered loan growth of ~10% YoY as of Sep’24. With this, generation grew
~2% YoY, transmission grew 14% YoY, and distribution rose ~12% YoY. Over the
last two years, distribution in the loan mix has improved from 35% to 41%, RE
loans have seen a CAGR of ~30%, and RE in the loan mix now forms ~13%.
In the near term, we expect some weakness in sanctions because of a slowdown
in the overall economic activity, resulting in slower investments in power and
infrastructure projects. Moreover, in distribution, a large part of loan growth
Abhijit Tibrewal - Research Analyst
(Abhijit.Tibrewal@MotilalOswal.com)
Research Analyst: Nitin Aggarwal
(Nitin.Aggarwal@MotilalOswal.com) |
Raghav Khemani
(Raghav.Khemani@MotilalOswal.com)
Investors are advised to refer through important disclosures made at the last page of the Research Report.
Motilal Oswal research is available on www.motilaloswal.com/Institutional-Equities, Bloomberg, Thomson Reuters, Factset and S&P Capital.