March 2025
India Strategy
BSE Sensex: 74,102
Nifty-50: 22,498
Sharp market correction offers opportunities
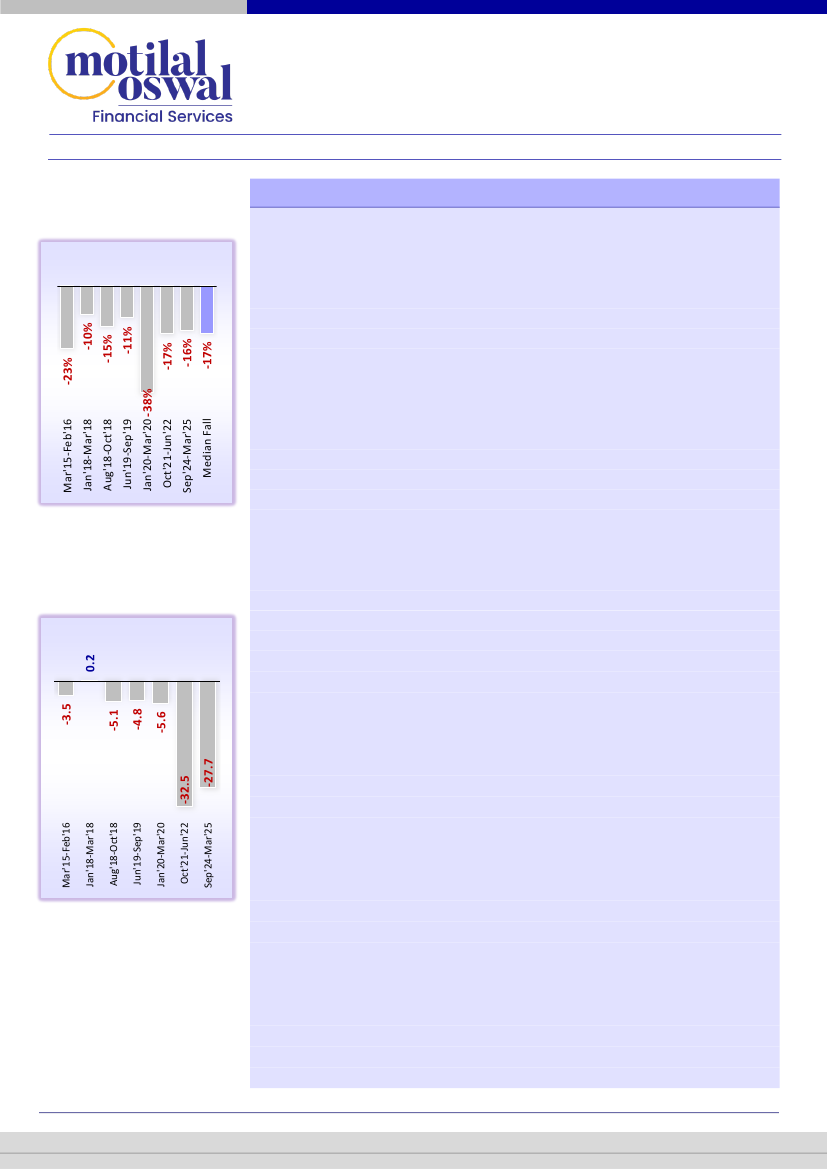
Nifty-50 correction phases
Nifty 50’s decline from
peak to trough
FII outflows during drawdowns
FII outflows during
drawdown phases (USD b)
Is the market close to a bottom?
Multiple factors suggest that the Indian
equities could be in the latter stages of correction unless any extreme
unforeseen risk materializes. We believe that the modest earnings growth so far
in FY25 should give way to double-digit growth in FY26. Market valuations have
eased, especially in large-cap stocks, with Nifty-50 trading at a ~10% discount to
LPA. India’s fiscal and monetary policies have turned stimulative, which should
support demand and sentiment. Nifty-50 has corrected ~16% since late Sep’24,
which is close to the median correction and maximum non-black-swan
correction of the past 10 years. FII selling of ~USD28b is 85%+ of the highest
selling in the past decade. Moreover, the recent global factors that are
instrumental in these corrections are also turning around, with the Dollar Index,
S&P500 and US bond yield retracing to levels closer to pre-US election results.
Buying opportunity emerging in select names:
In this report, we identify key
beaten-down names that have corrected meaningfully and currently appear out
of favor, but for which our analysts have a strong conviction over their earnings
growth, business momentum and quality of business model/management –
suggesting that the stock correction likely factors in excessive pessimism. Our
top picks identified based on the above criteria are as follows:
Large-caps: RIL,
Bharti, Hindustan Unilever, L&T, Maruti, Titan, Adani Ports, Bharat Electronics,
LTIM, Shriram Finance, JSW Energy and Polycab; SMIDs: HDFC AMC, Coforge,
Page, AU SFB, JK Cements, Ipca, Godrej Properties, Brigade, Angel One, and
Happy Forgings.
Stimulative fiscal and monetary policies should help revive demand:
The
Indian policy setting is also becoming more accommodative, which should begin
to lift demand impulse over the next few quarters. Both the monetary and fiscal
policies have pivoted to spur domestic consumption and liquidity. India’s
Finance Minister, in the FY26 Union Budget, flexed the government policy to
stimulate consumption through INR1t worth of budgeted savings for taxpayers.
Multiple monetary measures reflect RBI’s accommodative stance:
On the
monetary front, the RBI recently embarked on a rate-cut cycle after five years
(last rate cut was in Mar’20). In the lead-up to the rate cut, the RBI had also
been boosting domestic liquidity through various measures such as: 1) CRR cut
from 4.5% to 4.0% (INR1.16t), 2) OMO purchases (INR600b), 3) FX swaps
(INR450b), and 4) VRR auctions (INR42.2t). On 5th Mar’24, it announced further
measures that will potentially infuse liquidity through fresh OMOs (INR1t) and
FX swaps (~INR0.9t). Both fiscal and monetary policies have turned more
accommodative, which, in our view, will boost the demand impulse and growth
over the coming quarters.
A perfect storm:
Indian markets have corrected meaningfully over the last five
months, with the Nifty-50/Nifty MidCap/Nifty SmallCap down ~16%/21%/24%
(as of 4th Mar’25) from their peak. The broad-based correction is mainly
attributed to modest 9MFY25 earnings growth, continuous FII selling since
Oct’24 (~USD28b), a challenging geopolitical backdrop, and a strengthening
Research Analyst: Abhishek Saraf, CFA
(Abhishek.Saraf@MotilalOswal.com)
| Gautam Duggad
(Gautam.Duggad@MotilalOswal.com)
Research Analyst: Deven Mistry
(Deven@MotilalOswal.com) |
Aanshul Agarawal
(Aanshul.Agarawal@Motilaloswal.com)
Motilal Oswal research is available on www.motilaloswal.com/Institutional-Equities, Bloomberg, Thomson Reuters, Factset and S&P Capital.
Investors are advised to refer through important disclosures made at the last page of the Research Report.
 Motilal Oswal Financial Services
INDIA STRATEGY: Sharp market correction offers opportunities
dollar index that has drawn funds away from various markets. The stock-level
correction has been even more pronounced, especially for SMID, as weakening
earnings growth and elevated valuations coincided with shrinking risk appetite.
Nifty MidCap and Nifty SmallCap peak multiples have fallen to ~27x/20x (from
~35x/24x) but remain elevated.
Earnings moderated sharply in FY25, improvement likely in FY26:
A slowdown
in corporate earnings growth has been one of the key factors behind weak
market sentiment, as Nifty-50 has managed only 4% YoY PAT growth in 9MFY25
(vs. a healthy 20%+ CAGR during FY20-24). While 4QFY25 will likely be another
weak quarter (Nifty PAT growth likely at 4% YoY), we expect 16%/19% YoY
growth in Nifty/MOFSL PAT in FY26E. Although there could be some risk to
FY26E earnings in the current backdrop, we believe that growth would still be in
double digits. Once the extreme risk aversion and weak sentiment abate, the
equity market would be guided by a better earnings growth trajectory in FY26.
Current peak-to-trough correction at past-decade median:
Based on our
analysis of Nifty-50’s correction phases in the past 10 years, it appears that the
Indian equity market could be in the latter stages of correction unless some
extreme unanticipated risk materializes. Nifty-50 has already corrected 16% in
the current peak-to-trough journey, which has been in line with the median 17%
dip in the episodes of 10%+ corrections in the Nifty-50 and maximum peak-to-
trough dip in non-black-swan episodes over the past decade. Interestingly, the
peak Nifty-50 multiple at the start of previous correction phases was higher in
several occasions, giving some valuation cushion for large-caps, even as SMIDs
trade much above their past 10-year average valuation relative to Nifty. This
also corroborates our stance to overweight large caps over SMIDs – our model
portfolio has 76% weight on large-caps compared to 16% on mid-caps and 8%
on small-caps.
When will FII outflows abate/reverse?
Currently, this is the most topical
question we have come across in our recent investor interactions. While it is
difficult to point out the inflection point, it does appear to us that a large part of
FII outflows should be behind. The current bout of FII selling (of ~USD28b) in the
past five months has been an outlier. The selling is ~85% of the highest streak of
FII outflows (of USD32.5b) seen between Oct’21 and Jun’22. Lower corporate
earnings growth and a slowing domestic economy have been key domestic
factors, while strengthening US bond yields, rising USD Index and China’s AI
breakthrough have been key external drivers of the current bout of FII outflows.
FII outflows affecting markets but their marginal impact getting smaller:
While
Nifty has corrected ~16% in its peak-to-trough journey, the impact of FII flows
appears to be more calibrated versus previous episodes. During the 2015-16
phase, FIIs had sold ~USD4b in Indian equities, which led to a 23% market
correction. The current bout of FII selling has been ~7x bigger at ~US28b, while the
market has corrected ~16%. Even adjusting for Index levels, the intensity of the
current bout of FII selling has been ~2.7x of the 2015-16 phase, though market
correction has been lower. This reflects a milder impact of FII selling on the Indian
market and the increased counterweight of DII inflows, which remained strong at
~USD44b during the current phase of market weakness.
India could eventually be a net beneficiary of global realignment:
Any eventual
strength in the US economy on back of multi-faceted policy measures, should
2
March 2025
 Motilal Oswal Financial Services
INDIA STRATEGY: Sharp market correction offers opportunities
likely be beneficial for Indian exporters, while US’ reciprocal tariff policy may not
cast a severe dent, in our opinion. The finance minister had proactively lowered
customs duties on some import items in the Union Budget, and the Prime
Minister in his recent US trip has indicated a stronger partnership with the US
on the energy and defense fronts, which will help to narrow the deficit and
assuage US concerns. In addition, the US-China trade standoff should help
redirect some global demand requirements toward other countries, including
India. Hence, once the dust settles on the initial reaction to the new US
administration announcements, we believe FII outflows from Indian equities
should start to moderate.
Exhibit 1: Beaten-down stocks we like after the recent market correction
EPS
Company
Largecaps
Reliance Inds.
Bharti Airtel
Hind. Unilever
Larsen & Toubro
Maruti Suzuki
Titan Company
Adani Ports
Bharat Electronics
LTIMindtree
Shriram Finance
JSW Energy
Polycab India
Midcaps and Smallcaps
HDFC AMC
Coforge
Page Industries
AU Small Finance
J K Cements
Ipca Labs.
Godrej Properties
Brigade Enterpr.
Angel One
Happy Forgings
9.4
5.9
5.1
4.6
3.9
3.9
6.9
2.7
2.2
0.9
3,750
7,531
539
4,399
1,328
1,970
952
2,043
831
114.5 130.6 148.7
133.9 227.1 282.3
29.7
90.4
34.3
51.3
37.8
27.9
37.4
45.8
64.4
44.1
33.5
48.5
56.5
64.8
63.1
39.2
14.0
45.2
17.1
27.7
37.0
28.3
12.4
29.2
20.2
18.5
32.7
56.2
65.0
18.1
48.7
38.7
38.4
25.2
13.8
29.8
28.7
33.2
56.2
14.4
34.4
29.0
30.6
21.6
12.7
24.8
25.2
26.7
47.4
11.1
25.9
23.5
30.4
15.1
9.5
21.2
10.4
11.8
25.3
2.4
5.7
4.8
3.1
3.3
3.0
4.3
9.5
10.1
21.8
2.1
5.1
4.2
2.9
2.9
2.6
3.7
8.7
8.5
18.7
1.8
4.4
3.6
2.6
2.4
2.2
33.1
22.2
39.0
14.5
11.6
13.0
10.4
16.2
28.6
34.7
32.8
38.8
15.7
15.7
15.4
9.8
14.3
22.2
36.2
34.5
39.5
17.3
18.1
16.5
9.0
17.5
25.4
193.5
113.7
59.3
51.1
42.0
31.4
28.3
23.2
16.0
13.6
9.8
8.7
1,238
1,630
2,248
3,177
3,027
1,143
272
4,671
626
506
4,942
50.6
36.4
44.1
61.0
45.1
49.3
67.9
62.5
54.1
15.9
31.1
10.8
21.4
11.4
22.1
21.2
18.7
15.8
20.0
15.4
18.1
24.5
44.8
51.0
29.9
25.0
70.7
24.0
40.7
29.4
14.2
36.9
39.5
20.3
36.2
45.6
23.5
22.6
56.7
19.5
34.9
25.7
11.9
29.3
33.4
18.2
26.1
41.5
20.3
20.2
47.4
16.3
28.9
21.9
9.8
27.7
28.4
2.0
8.9
10.3
4.5
3.9
22.3
4.0
9.8
6.1
2.0
3.9
7.7
1.8
6.7
10.2
3.9
3.4
17.5
3.4
7.9
5.3
1.8
3.5
6.6
1.7
5.8
9.9
3.4
3.1
13.9
2.9
6.4
4.7
1.5
3.2
5.6
8.3
22.8
20.2
15.9
14.8
35.5
17.9
24.1
22.0
15.6
11.0
19.5
9.3
23.0
22.4
17.8
15.3
34.6
18.8
22.6
22.2
15.8
12.5
19.7
9.5
25.8
24.2
17.9
15.2
32.7
19.1
22.2
22.8
16.4
12.0
19.9
MCap
(USDb)
CMP
(INR)
EPS (INR)
CAGR (%)
PE (x)
PB (x)
ROE (%)
FY25E FY26E FY27E FY25-27E FY25E FY26E FY27E FY25E FY26E FY27E FY25E FY26E FY27E
106.2 135.4 156.5
42.8
47.7
6.7
44.2
13.7
53.4
58.5
7.8
52.6
17.2
63.8
70.0
9.4
63.6
18.2
11,567 462.3 512.4 573.4
158.7 182.1 212.8
125.0 148.0 174.3
39,880 613.6 709.4 841.0
128.1 169.6
148.5 160.7 214.6
3.3
15.3 16.1 16.4
Source: Bloomberg, MOFSL
March 2025
3
 Motilal Oswal Financial Services
INDIA STRATEGY: Sharp market correction offers opportunities
Exhibit 2: Nifty-50 drawdown phases and recovery thereafter
Nifty-50 drawdown
Period
1
2
3
4
5
6
7
8
9
All-time high All-time
date
high
08-Jan-08
6,288
05-Nov-10
6,312
03-Mar-15
8,996
29-Jan-18
11,130
28-Aug-18
11,739
03-Jun-19
12,089
14-Jan-20
12,362
18-Oct-21
18,477
26-Sep-24
26,216
Median Value
Trough date
27-Oct-08
20-Dec-11
25-Feb-16
23-Mar-18
26-Oct-18
19-Sep-19
23-Mar-20
17-Jun-22
04-Mar-25
Nifty 50
trough value
2,524
4,544
6,971
9,998
10,030
10,705
7,610
15,294
22,083
Total decline
during
drawdown
Recovery from trough to next peak
No of days taken for
recovery from the
trough date
739
684
383
123
172
69
231
160
-
202
Nifty 50 max Date of new all- % recovery from
decline
time high
trough
-60%
-28%
-23%
-10%
-15%
-11%
-38%
-17%
-16%
-17%
05-Nov-10
03-Nov-13
14-Mar-17
24-Jul-18
16-Apr-19
27-Nov-19
09-Nov-20
24-Nov-22
-
150%
39%
30%
11%
18%
13%
64%
21%
-
26%
Source: Bloomberg, MOFSL
Exhibit 3: Current market decline is close to the historical median
Nifty-50’s decline from peak to trough in different drawdown phases
-10%
-28%
-23%
-15%
-11%
-38%
-17%
-16%
-17%
-60%
Source: Bloomberg, MOFSL
Note: Decline instances from the past 10 years are considered for calculating the median drawdown
Exhibit 4: Understandably in peak-to-trough phase, SMIDs decline more than Nifty-50
Nifty MidCap 100
Nifty SMIDs’ decline from peak to trough in different drawdown phases
Nifty SmallCap 100
-14%
-38%
-69%
-25%
-45%
-16%
-19%
-16%
-25%
-21%
-32%
-46%
-23%
-21%
-38%
-23%
-24%
-21%
-25%
-77%
Source: Bloomberg, MOFSL
March 2025
4
 Motilal Oswal Financial Services
INDIA STRATEGY: Sharp market correction offers opportunities
Exhibit 5: FIIs sold cumulatively USD91b (net) over the drawdown phase (peak-to-trough)
Net FII Investment (US$bn) - From All time High Date to Trough Date during each drawdown phase
0.6
-3.5
-12.1
0.2
-5.1
-4.8
-5.6
Cumulative Net FII
outflows
of
USD91 bn
-32.5
-27.7
Source: Bloomberg, MOFSL
Exhibit 6: FIIs bought cumulatively USD131b (net) over the recovery phase (trough-to-new all-time high)
Net FII investment (USD b) - From trough date to new all-time high date during each drawdown phase
45.4
40.9
Cumulative Net FII
inflows
of
USD131b
8.2
-2.9
9.7
14.1
8.8
6.9
Source: Bloomberg, MOFSL
Exhibit 7: All sectors were in red during the drawdown phase; however, defensives provided relative outperformance
Median Performance of Sectors during the Drawdown Phase - From Peak to Trough
-13% -14% -14%
-15% -16% -17%
-18% -18% -18% -19% -20% -20%
-20% -21% -22%
-25%
-27%
-29%
Source: Bloomberg, MOFSL
March 2025
5
 Motilal Oswal Financial Services
INDIA STRATEGY: Sharp market correction offers opportunities
Exhibit 8: BFSI, Metals, and Realty led the outperformance during the recovery phase
Median Performance of Sectors during the Recovery Phase - From Trough to New Peak
32%
32%
28%
27%
26%
24%
22%
22%
21%
21%
21%
20%
20%
19%
18%
18%
17%
9%
Source: Bloomberg, MOFSL
Exhibit 9: Valuation changes during the drawdown and recovery phases
Nifty-50 Peak, Trough and Recovery Dates
Peak Date
03-Mar-15
29-Jan-18
28-Aug-18
03-Jun-19
14-Jan-20
18-Oct-21
26-Sep-24
Trough Date
25-Feb-16
23-Mar-18
26-Oct-18
19-Sep-19
23-Mar-20
17-Jun-22
04-Mar-25
New All
Time High
14-Mar-17
24-Jul-18
16-Apr-19
27-Nov-19
09-Nov-20
24-Nov-22
?
Median Value
De-Rating/
Re-Rating
Nifty-50 Forward P/E
Peak
21.4
22.9
24.2
23.9
22.5
22.8
22.9
22.9
Trough
16.4
20.8
21.6
22.5
15.8
18.4
18.6
18.6
-19%
21.7
17%
Post
Recovery
20.2
23.5
24.4
23.2
19.5
20
Nifty MidCap 100
Peak
17
23.1
22.3
18.2
19
30.8
34.9
22.3
Trough
15.7
21.3
18.6
16.6
12.4
18.3
26.6
18.3
-18%
20.5
12%
Post
Recovery
20
20.9
17.5
17.5
26.7
24.9
Nifty SmallCap 100
Peak
15.1
15.8
14.1
14
14.4
20.3
24
15.1
Trough
10.5
14
11.1
13.8
8.2
13.9
19.4
13.8
-9%
14.7
7%
Post
Recovery
14.9
14.1
14.5
14.2
17.8
16.4
Exhibit 10: Median forward P/E tends to fall by 9-19% during the drawdown and recovers 7-17% when the new high is
formed
Median Forward P/E from Peak to Trough to Recovery during drawdown phase of Nifty 50
22.8
18.6
21.7
22.3
20.5
18.3
15.1
13.8
14.7
Nifty-50
All Time High
Nifty Mid-Cap 100
Trough in a phase
Nifty Small-Cap 100
Post Recovery/Date of New High
March 2025
6
 Motilal Oswal Financial Services
INDIA STRATEGY: Sharp market correction offers opportunities
Exhibit 11: Global indices’ performance during the Nifty-50 drawdown phase (USD performance)
India
Nifty-50 All
Trough
Time High Date
Date
8-Jan-08
27-Oct-08
5-Nov-10
3-Mar-15
29-Jan-18
28-Aug-18
3-Jun-19
14-Jan-20
18-Oct-21
26-Sep-24
20-Dec-11
25-Feb-16
23-Mar-18
26-Oct-18
19-Sep-19
23-Mar-20
17-Jun-22
4-Mar-25
NIFTY
Index
-68%
-40%
-31%
-12%
-18%
-14%
-43%
-20%
-19%
Brazil
IBOV
Index
-63%
-29%
-40%
-5%
24%
1%
-56%
-6%
-15%
China
HSCEI
Index
-68%
-31%
-34%
-12%
-9%
0%
-23%
-19%
18%
Indonesia
JCI Index
-64%
1%
-18%
-10%
-8%
2%
-48%
-1%
-24%
South
Korea
KOSPI
Index
-67%
-12%
-15%
-8%
-15%
0%
-39%
-26%
-14%
MSCI
India
MXIN
Index
-70%
-41%
-29%
-12%
-20%
-14%
-42%
-20%
-22%
MSCI
EM
MXEF
Index
-63%
-22%
-25%
-8%
-12%
1%
-34%
-22%
-6%
MSCI
China
MXCN
Index
-67%
-29%
-27%
-10%
-16%
5%
-22%
-24%
12%
MSCI
World
MXWO
Index
-45%
-8%
-12%
-9%
-9%
8%
-33%
-20%
0%
MSCI
USA
MXUS
Index
-39%
1%
-8%
-9%
-8%
9%
-32%
-20%
1%
MSCI
Europe
MXEU
Index
-53%
-18%
-18%
-9%
-11%
4%
-36%
-21%
-1%
Source: Bloomberg, MOFSL
Note: Red/Green highlighted numbers indicate the worst/best performance for the index during the period.
Exhibit 12: Nifty-50 valuations down 17% from 2024 highs and trade at a discount to the LPA
Nifty 50 P/E (x)
22.8
21.6
19.3
19.2
21.4
22.3
21.6
18.7
Average 20.5x
19.0
19.4
22.5
18.7
FY15
FY16
FY17
FY18
FY19
FY20
FY21
FY22
FY23
FY24
Peak FY25 FY25YTD
Source: MOFSL
Exhibit 13: Midcaps’ valuations corrected 22% from the
highs
Nifty Mid-cap 100 P/E(x)
34.8
Exhibit 14: Smallcaps’ valuation contracted 15% from highs
Nifty Small-cap 100 PE (x)
23.9
20.5
20.4
17.7
16.2
13.4 13.5
15.5
Average 22.5x
22.9
17.0 16.9
18.6
19.7
17.1
24.8
26.2
22.3
25.3
27.2
15.1
13.0
Average 16.0x
16.0
13.0
Source: Bloomberg, MOFSL
March 2025
7
 Motilal Oswal Financial Services
INDIA STRATEGY: Sharp market correction offers opportunities
Exhibit 15: Valuation trend – Largecaps trade below their LPA, midcaps and smallcaps continue to trade at a high premium
40
Nifty-50(x)
Mar'15-Mar'25 P/E(x)
Nifty-50 avg : 20.5x
Nifty Mid-cap 100 avg : 22.5x
Nifty Small-cap 100 avg : 16.0x
Nifty Mid-cap 100 P/E(x)
Nifty Small-cap 100 PE (x)
32
Nifty-50 traded mostly at a premium
24
27.2
20.4
18.7
Nifty Mid-cap 100 and Nifty Small-cap 100 currently trade
at a meaningful premium to Nifty-50
16
8
Source: Bloomberg, MOFSL
Exhibit 16: MOFSL Universe PAT growth to rebound
MOFSL PAT Growth YoY (%)
38.3
29.0
30.5
19.1
9.8
3.2
FY21
FY22
FY23
FY24
FY25E
FY26E
FY27E
Exhibit 17: Nifty PAT growth to bounce back as well
37.5
NIFTY PAT Growth YoY (%)
26.3
19.6
15.0
12.0
3.7
FY21
FY22
FY23
FY24
FY25E
FY26E
FY27E
15.9
13.6
Source: MOFSL
Source: MOFSL
Exhibit 18: RBI cuts repo rate by 25bp to 6.25%
10
8
6
4
2
Exhibit 19: RBI cuts CRR by 50bp to 4%
4.9
4.3
CRR (%)
Repo rate (%)
6.25
3.7
3.1
2.5
4.0
Source: MOFSL
Source: MOFSL
March 2025
8
 Motilal Oswal Financial Services
INDIA STRATEGY: Sharp market correction offers opportunities
Exhibit 20: Liquidity deficit abates after multiple measures from RBI
RBI's Net Liquidity position (INR b)
Source: Bloomberg, MOFSL
Exhibit 21: USD Index has corrected ~6% from top and currently at levels closer to pre-US Presidential election results
110
108
105
103
100
Nov-24
103.7
Dec-24
Jan-25
Feb-25
Mar-25
Source: Bloomberg, MOFSL
Exhibit 22: S&P500 also gave up most of the gains seen post US Presidential election results
6180
6060
5940
5820
5700
Nov-24
5,770
Dec-24
Jan-25
Feb-25
Mar-25
Source: Bloomberg, MOFSL
Exhibit 23: US 10Y at 4.2% flattens to Nov’24 levels
4.8
4.6
4.4
4.2
4.0
Nov-24
4.2
US 10Yr Bond Yield
Dec-24
Jan-25
Feb-25
Mar-25
Investment in securities market are subject to market risks. Read all the related documents carefully before investing
March 2025
9
 Motilal Oswal Financial Services
INDIA STRATEGY: Sharp market correction offers opportunities
NOTES
March 2025
10
 Motilal Oswal Financial Services
INDIA STRATEGY: Sharp market correction offers opportunities
*In case the recommendation given by the Research Analyst is inconsistent with the investment rating legend for a continuous period of 30 days, the Research Analyst shall be within following
30 days take appropriate measures to make the recommendation consistent with the investment rating legend.
Disclosures
The following Disclosures are being made in compliance with the SEBI Research Analyst Regulations 2014 (herein after referred to as the Regulations).
Motilal Oswal Financial Services Ltd. (MOFSL) is a SEBI Registered Research Analyst having registration no. INH000000412. MOFSL, the Research Entity (RE) as defined in the Regulations,
is engaged in the business of providing Stock broking services, Depository participant services & distribution of various financial products. MOFSL is a listed public company, the details in
respect of which are available on
www.motilaloswal.com.
MOFSL (erstwhile Motilal Oswal Securities Limited - MOSL) is registered with the Securities & Exchange Board of India (SEBI) and is
a registered Trading Member with National Stock Exchange of India Ltd. (NSE) and Bombay Stock Exchange Limited (BSE), Multi Commodity Exchange of India Limited (MCX) and National
Commodity & Derivatives Exchange Limited (NCDEX) for its stock broking activities & is Depository participant with Central Depository Services Limited (CDSL) National Securities Depository
Limited (NSDL),NERL, COMRIS and CCRL and is member of Association of Mutual Funds of India (AMFI) for distribution of financial products and Insurance Regulatory & Development
Authority of India (IRDA) as Corporate Agent for insurance products.
Details of associate entities of Motilal Oswal Financial Services Limited are available on the website at
http://onlinereports.motilaloswal.com/Dormant/documents/List%20of%20Associate%20companies.pdf
MOFSL and its associate company(ies), their directors and Research Analyst and their relatives may; (a) from time to time, have a long or short position in, act as principal in, and buy or sell
the securities or derivatives thereof of companies mentioned herein. (b) be engaged in any other transaction involving such securities and earn brokerage or other compensation or act as a
market maker in the financial instruments of the company(ies) discussed herein or act as an advisor or lender/borrower to such company(ies) or may have any other potential conflict of
interests with respect to any recommendation and other related information and opinions.; however the same shall have no bearing whatsoever on the specific recommendations made by the
analyst(s), as the recommendations made by the analyst(s) are completely independent of the views of the associates of MOFSL even though there might exist an inherent conflict of interest in
some of the stocks mentioned in the research report.
MOFSL and / or its affiliates do and seek to do business including investment banking with companies covered in its research reports. As a result, the recipients of this report should be aware
that MOFSL may have a potential conflict of interest that may affect the objectivity of this report. Compensation of Research Analysts is not based on any specific merchant banking, investment
banking or brokerage service transactions. Details of pending Enquiry Proceedings of Motilal Oswal Financial Services Limited are available on the website at
https://galaxy.motilaloswal.com/ResearchAnalyst/PublishViewLitigation.aspx
A graph of daily closing prices of securities is available at
www.nseindia.com, www.bseindia.com.
Research Analyst views on Subject Company may vary based on Fundamental research and
Technical Research. Proprietary trading desk of MOFSL or its associates maintains arm’s length distance with Research Team as all the activities are segregated from MOFSL research activity
and therefore it can have an independent view with regards to Subject Company for which Research Team have expressed their views.
Regional Disclosures (outside India)
This report is not directed or intended for distribution to or use by any person or entity resident in a state, country or any jurisdiction, where such distribution, publication, availability or use
would be contrary to law, regulation or which would subject MOFSL & its group companies to registration or licensing requirements within such jurisdictions.
For Hong Kong:
This report is distributed in Hong Kong by Motilal Oswal capital Markets (Hong Kong) Private Limited, a licensed corporation (CE AYY-301) licensed and regulated by the Hong Kong Securities
and Futures Commission (SFC) pursuant to the Securities and Futures Ordinance (Chapter 571 of the Laws of Hong Kong) “SFO”. As per SEBI (Research Analyst Regulations) 2014 Motilal
Oswal Securities (SEBI Reg. No. INH000000412) has an agreement with Motilal Oswal capital Markets (Hong Kong) Private Limited for distribution of research report in Hong Kong. This report
is intended for distribution only to “Professional Investors” as defined in Part I of Schedule 1 to SFO. Any investment or investment activity to which this document relates is only available to
professional investor and will be engaged only with professional investors.” Nothing here is an offer or solicitation of these securities, products and services in any jurisdiction where their offer
or sale is not qualified or exempt from registration. The Indian Analyst(s) who compile this report is/are not located in Hong Kong & are not conducting Research Analysis in Hong Kong.
For U.S.
Motilal Oswal Financial Services Limited (MOFSL) is not a registered broker - dealer under the U.S. Securities Exchange Act of 1934, as amended (the"1934 act") and under applicable state
laws in the United States. In addition MOFSL is not a registered investment adviser under the U.S. Investment Advisers Act of 1940, as amended (the "Advisers Act" and together with the 1934
Act, the "Acts), and under applicable state laws in the United States. Accordingly, in the absence of specific exemption under the Acts, any brokerage and investment services provided by
MOFSL, including the products and services described herein are not available to or intended for U.S. persons. This report is intended for distribution only to "Major Institutional Investors" as
defined by Rule 15a-6(b)(4) of the Exchange Act and interpretations thereof by SEC (henceforth referred to as "major institutional investors"). This document must not be acted on or relied on
by persons who are not major institutional investors. Any investment or investment activity to which this document relates is only available to major institutional investors and will be engaged in
only with major institutional investors. In reliance on the exemption from registration provided by Rule 15a-6 of the U.S. Securities Exchange Act of 1934, as amended (the "Exchange Act") and
interpretations thereof by the U.S. Securities and Exchange Commission ("SEC") in order to conduct business with Institutional Investors based in the U.S., MOFSL has entered into a
chaperoning agreement with a U.S. registered broker-dealer, Motilal Oswal Securities International Private Limited. ("MOSIPL"). Any business interaction pursuant to this report will have to be
executed within the provisions of this chaperoning agreement.
The Research Analysts contributing to the report may not be registered /qualified as research analyst with FINRA. Such research analyst may not be associated persons of the U.S. registered
broker-dealer, MOSIPL, and therefore, may not be subject to NASD rule 2711 and NYSE Rule 472 restrictions on communication with a subject company, public appearances and trading
securities held by a research analyst account.
For Singapore
In Singapore, this report is being distributed by Motilal Oswal Capital Markets (Singapore) Pte. Ltd. (“MOCMSPL”) (UEN 201129401Z), which is a holder of a capital markets services license
and an exempt financial adviser in Singapore.This report is distributed solely to persons who (a) qualify as “institutional investors” as defined in section 4A(1)(c) of the Securities and Futures
Act of Singapore (“SFA”) or (b) are considered "accredited investors" as defined in section 2(1) of the Financial Advisers Regulations of Singapore read with section 4A(1)(a) of the SFA.
Accordingly, if a recipient is neither an “institutional investor” nor an “accredited investor”, they must immediately discontinue any use of this Report and inform MOCMSPL .
In respect of any matter arising from or in connection with the research you could contact the following representatives of MOCMSPL. In case of grievances for any of the services rendered by
MOCMSPL write to
grievances@motilaloswal.com.
Nainesh Rajani
Email:
nainesh.rajani@motilaloswal.com
Contact: (+65) 8328 0276
.
Specific Disclosures
1. Research Analyst and/or his/her relatives do not have a financial interest in the subject company(ies), as they do not have equity holdings in the subject company(ies).
MOFSL has financial interest in the subject company(ies) at the end of the week immediately preceding the date of publication of the Research Report: Yes.
Nature of Financial interest is holding equity shares or derivatives of the subject company
2. Research Analyst and/or his/her relatives do not have actual/beneficial ownership of 1% or more securities in the subject company(ies) at the end of the month immediately
preceding the date of publication of Research Report.
MOFSL has actual/beneficial ownership of 1% or more securities of the subject company(ies) at the end of the month immediately preceding the date of publication of Research
Report:No
3. Research Analyst and/or his/her relatives have not received compensation/other benefits from the subject company(ies) in the past 12 months.
MOFSL may have received compensation from the subject company(ies) in the past 12 months.
4. Research Analyst and/or his/her relatives do not have material conflict of interest in the subject company at the time of publication of research report.
MOFSL does not have material conflict of interest in the subject company at the time of publication of research report.
5. Research Analyst has not served as an officer, director or employee of subject company(ies).
6. MOFSL has not acted as a manager or co-manager of public offering of securities of the subject company in past 12 months.
7. MOFSL has not received compensation for investment banking /merchant banking/brokerage services from the subject company(ies) in the past 12 months.
Explanation of Investment Rating
Investment Rating
BUY
SELL
NEUTRAL
UNDER REVIEW
NOT RATED
Expected return (over 12-month)
>=15%
< - 10%
< - 10 % to 15%
Rating may undergo a change
We have forward looking estimates for the stock but we refrain from assigning recommendation
March 2025
11
 Motilal Oswal Financial Services
INDIA STRATEGY: Sharp market correction offers opportunities
MOFSL may have received any compensation for products or services other than investment banking or merchant banking or brokerage services from the subject company(ies)
in the past 12 months.
9. MOFSL may have received compensation or other benefits from the subject company(ies) or third party in connection with the research report.
10. MOFSL has not engaged in market making activity for the subject company.
********************************************************************************************************************************
The associates of MOFSL may have:
-
financial interest in the subject company
-
actual/beneficial ownership of 1% or more securities in the subject company at the end of the month immediately preceding the date of publication of the Research Report or date of the
public appearance.
-
received compensation/other benefits from the subject company in the past 12 months
-
any other potential conflict of interests with respect to any recommendation and other related information and opinions.; however the same shall have no bearing whatsoever on the
specific recommendations made by the analyst(s), as the recommendations made by the analyst(s) are completely independent of the views of the associates of MOFSL even though
there might exist an inherent conflict of interest in some of the stocks mentioned in the research report.
-
acted as a manager or co-manager of public offering of securities of the subject company in past 12 months
-
be engaged in any other transaction involving such securities and earn brokerage or other compensation or act as a market maker in the financial instruments of the company(ies)
discussed herein or act as an advisor or lender/borrower to such company(ies)
-
received compensation from the subject company in the past 12 months for investment banking / merchant banking / brokerage services or from other than said services.
-
Served subject company as its clients during twelve months preceding the date of distribution of the research report.
The associates of MOFSL has not received any compensation or other benefits from third party in connection with the research report
Above disclosures include beneficial holdings lying in demat account of MOFSL which are opened for proprietary investments only. While calculating beneficial holdings, It does not consider
demat accounts which are opened in name of MOFSL for other purposes (i.e holding client securities, collaterals, error trades etc.). MOFSL also earns DP income from clients which are not
considered in above disclosures.
Analyst Certification
The views expressed in this research report accurately reflect the personal views of the analyst(s) about the subject securities or issues, and no part of the compensation of the research
analyst(s) was, is, or will be directly or indirectly related to the specific recommendations and views expressed by research analyst(s) in this report.
Terms & Conditions:
This report has been prepared by MOFSL and is meant for sole use by the recipient and not for circulation. The report and information contained herein is strictly confidential and may not be
altered in any way, transmitted to, copied or distributed, in part or in whole, to any other person or to the media or reproduced in any form, without prior written consent of MOFSL. The report is
based on the facts, figures and information that are considered true, correct, reliable and accurate. The intent of this report is not recommendatory in nature. The information is obtained from
publicly available media or other sources believed to be reliable. Such information has not been independently verified and no guaranty, representation of warranty, express or implied, is made
as to its accuracy, completeness or correctness. All such information and opinions are subject to change without notice. The report is prepared solely for informational purpose and does not
constitute an offer document or solicitation of offer to buy or sell or subscribe for securities or other financial instruments for the clients. Though disseminated to all the customers
simultaneously, not all customers may receive this report at the same time. MOFSL will not treat recipients as customers by virtue of their receiving this report.
Disclaimer:
The report and information contained herein is strictly confidential and meant solely for the selected recipient and may not be altered in any way, transmitted to, copied or distributed, in part or
in whole, to any other person or to the media or reproduced in any form, without prior written consent. This report and information herein is solely for informational purpose and may not be
used or considered as an offer document or solicitation of offer to buy or sell or subscribe for securities or other financial instruments. Nothing in this report constitutes investment, legal,
accounting and tax advice or a representation that any investment or strategy is suitable or appropriate to your specific circumstances. The securities discussed and opinions expressed in this
report may not be suitable for all investors, who must make their own investment decisions, based on their own investment objectives, financial positions and needs of specific recipient. This
may not be taken in substitution for the exercise of independent judgment by any recipient. Each recipient of this document should make such investigations as it deems necessary to arrive at
an independent evaluation of an investment in the securities of companies referred to in this document (including the merits and risks involved), and should consult its own advisors to
determine the merits and risks of such an investment. The investment discussed or views expressed may not be suitable for all investors. Certain transactions -including those involving futures,
options, another derivative products as well as non-investment grade securities - involve substantial risk and are not suitable for all investors. No representation or warranty, express or implied,
is made as to the accuracy, completeness or fairness of the information and opinions contained in this document. The Disclosures of Interest Statement incorporated in this document is
provided solely to enhance the transparency and should not be treated as endorsement of the views expressed in the report. This information is subject to change without any prior notice. The
Company reserves the right to make modifications and alternations to this statement as may be required from time to time without any prior approval. MOFSL, its associates, their directors and
the employees may from time to time, effect or have effected an own account transaction in, or deal as principal or agent in or for the securities mentioned in this document. They may perform
or seek to perform investment banking or other services for, or solicit investment banking or other business from, any company referred to in this report. Each of these entities functions as a
separate, distinct and independent of each other. The recipient should take this into account before interpreting the document. This report has been prepared on the basis of information that is
already available in publicly accessible media or developed through analysis of MOFSL. The views expressed are those of the analyst, and the Company may or may not subscribe to all the
views expressed therein. This document is being supplied to you solely for your information and may not be reproduced, redistributed or passed on, directly or indirectly, to any other person or
published, copied, in whole or in part, for any purpose. This report is not directed or intended for distribution to, or use by, any person or entity who is a citizen or resident of or located in any
locality, state, country or other jurisdiction, where such distribution, publication, availability or use would be contrary to law, regulation or which would subject MOFSL to any registration or
licensing requirement within such jurisdiction. The securities described herein may or may not be eligible for sale in all jurisdictions or to certain category of investors. Persons in whose
possession this document may come are required to inform themselves of and to observe such restriction. Neither the Firm, not its directors, employees, agents or representatives shall be
liable for any damages whether direct or indirect, incidental, special or consequential including lost revenue or lost profits that may arise from or in connection with the use of the information.
The person accessing this information specifically agrees to exempt MOFSL or any of its affiliates or employees from, any and all responsibility/liability arising from such misuse and agrees not
to hold MOFSL or any of its affiliates or employees responsible for any such misuse and further agrees to hold MOFSL or any of its affiliates or employees free and harmless from all losses,
costs, damages,
expenses that may be suffered by the person accessing this information due to any errors and delays.
This report is meant for the clients of Motilal Oswal only.
Investment in securities market are subject to market risks. Read all the related documents carefully before investing.
Registration granted by SEBI and certification from NISM in no way guarantee performance of the intermediary or provide any assurance of returns to investors.
Registered Office Address: Motilal Oswal Tower, Rahimtullah Sayani Road, Opposite Parel ST Depot, Prabhadevi, Mumbai-400025; Tel No.: 022 - 71934200 / 71934263;
www.motilaloswal.com. Correspondence Address: Palm Spring Centre, 2nd Floor, Palm Court Complex, New Link Road, Malad (West), Mumbai- 400 064. Tel No: 022 71881000. Details of
Compliance Officer: Neeraj Agarwal, Email Id: na@motilaloswal.com, Contact No.:022-40548085.
Grievance Redressal Cell:
Contact Person
Contact No.
Email ID
Ms. Hemangi Date
022 40548000 / 022 67490600
query@motilaloswal.com
Ms. Kumud Upadhyay
022 40548082
servicehead@motilaloswal.com
Mr. Ajay Menon
022 40548083
am@motilaloswal.com
Registration details of group entities.: Motilal Oswal Financial Services Ltd. (MOFSL): INZ000158836 (BSE/NSE/MCX/NCDEX); CDSL and NSDL: IN-DP-16-2015; Research Analyst:
INH000000412 . AMFI: ARN .: 146822. IRDA Corporate Agent – CA0579. Motilal Oswal Financial Services Ltd. is a distributor of Mutual Funds, PMS, Fixed Deposit, Insurance, Bond, NCDs
and IPO products.
Customer having any query/feedback/ clarification may write to query@motilaloswal.com. In case of grievances for any of the services rendered by Motilal Oswal Financial Services Limited
(MOFSL) write to grievances@motilaloswal.com, for DP to dpgrievances@motilaloswal.com.
8.
March 2025
12