India Strategy
BSE Sensex: 77,984
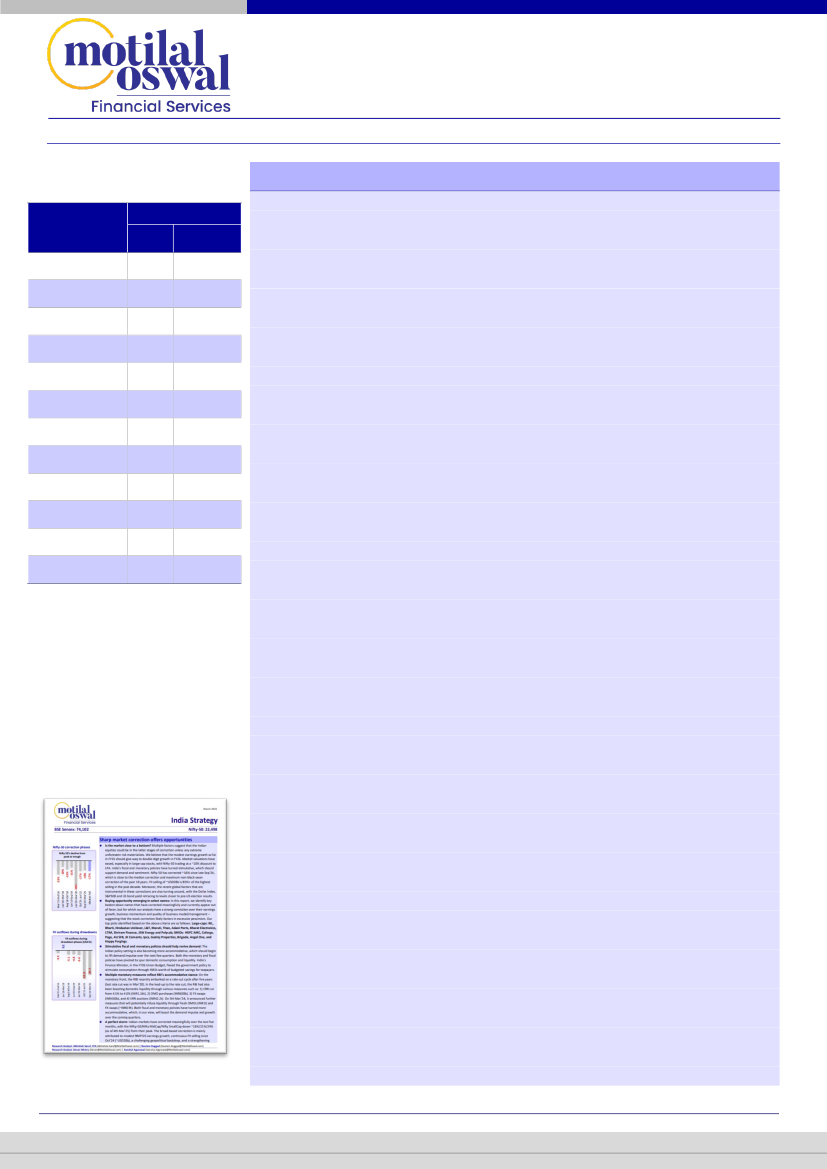
Performance during Nifty’s >10%
correction phases
Perf.*
Nifty-50
May'06 to
Jun'06
Feb'07 to
Mar'07
Jul'07 to
Aug'07
Jan'08 to
Oct'08
Nov'10 to
Dec'11
Mar'15 to
Feb'16
Jan'18 to
Mar'18
Aug'18 to
Oct'18
Jun'19 to
Sep'19
Jan'20 to
Mar'20
Oct'21 to
Jun'22
Sep'24 to
Mar'25
-30%
-15%
-12%
-60%
-28%
-23%
-10%
-15%
-11%
-38%
-17%
-16%
Relative Performance
Nifty
FMCG
-1%
4%
9%
25%
34%
10%
4%
1%
6%
13%
4%
-8%
Nifty
Consumption
0%
0%
1%
7%
14%
16%
3%
-3%
4%
11%
2%
-6%
March 2025
March 2025
Nifty-50: 23,658
Fishing for SMID Consumption picks
*Performance
Our recent Strategy report
“Sharp Market correction
offers opportunities”
Consumption likely to get better:
Demand and earnings for several listed
consumption stocks have been hit in 9MFY25, owing muted wage growth,
higher price levels, rising leverage, negative wealth effect etc. Importantly,
India’s policymakers have taken cognizance of weak consumption and are
adjusting both fiscal and monetary policies to boost aggregate demand,
liquidity, and sentiments. Selective stock picking opportunities have emerged, as
consumption indices have significantly underperformed over the past six
months. Valuations (MOFSL Consumer 12-month forward PE at 39x vs. Sep’24
peak of 54x) look less exacting now, while a beaten-down profit base and an
expected sequential demand lift should drive some earnings pickup in FY26
(Consumer: 13% YoY; Retail: 37% YoY). The sector can also benefit from light
positioning, as it is a common underweight across many top domestic funds.
A rare phase of underperformance for the consumption sector:
Nifty FMCG
and Consumption indices have fallen ~20%/17% from their peak in Sep’24,
underperforming Nifty100 by ~900-600bps. This is an aberration from historical
trends, as consumption indices typically outperform the benchmark during
phases of sharp market downturns. Nifty FMCG and Nifty Consumption indices
have delivered an average alpha of 10%/5%, respectively, during the past 11
phases of a 10%+ correction in the Nifty over last two decades. Current
underperformance can be explained by weak FY25 earnings (MOFSL-covered
consumption complex to post weak 2% YoY PAT growth). However, the factors
mentioned earlier can drive incremental positivity in select consumption names.
In this note our team suggests key SMID consumption plays across segments.
Sharp valuation correction offers entry points:
The MOFSL covered Consumer
& Retail stocks’ aggregate 12-month forward PE has corrected from the Sep’24
peak of 54x/109x to 39x/67x. The market cap of these segments has declined by
21% and 25% from their peaks to INR26.6t and INR9.9t. The divergence has
been significant in Retail names, with corrections between -9% and -61%, while
for Consumer, the range was between 0% to -36%.
Fiscal and monetary policies working in tandem; inflationary pressures easing:
The macro setting for consumption seems to be improving. In a not-so-common
coincidence, both fiscal and monetary policies in India are in a stimulative mode,
though at a measured pace. The INR1t of personal tax foregone in the FY26
Union Budget and multiple state-level income transfer schemes should drive
higher disposable incomes—a substantial portion of which is likely to be
channeled towards various consumption categories. To stimulate demand and
liquidity, the RBI, on its part, has utilized multiple monetary tools, such as 50bps
CRR cut, 25bps repo cut, liquidity injection through OMOs and FX swaps etc.
In addition, inflationary pressures appear to be easing, which should likely help
in reversing some of the price-induced demand contraction. With latest CPI
coming at 3.6% in Feb’25, our economist now expects a lower FY25 CPI print at
4.7% YoY (vs. 5.1% earlier) and further forecasts a benign 3.8% CPI for FY26.
Key picks:
In this note we highlight the following key SMID consumption picks
based on our analysts’ conviction on business and earnings growth:
Page
Industries, Devyani, Metro Brands, V-Mart, Lemontree Hotels, LT Foods, and
Cello World.
Research Analyst: Abhishek Saraf, CFA (Abhishek.Saraf@MotilalOswal.com | Gautam Duggad
(Gautam.Duggad@MotilalOswal.com)
Research Analyst: Deven Mistry
(Deven@MotilalOswal.com) |
Aanshul Agarawal
(Aanshul.Agarawal@Motilaloswal.com)
Motilal Oswal research is available on www.motilaloswal.com/Institutional-Equities, Bloomberg, Thomson Reuters, Factset and S&P Capital.
Investors are advised to refer through important disclosures made at the last page of the Research Report.
 Motilal Oswal Financial Services
INDIA STRATEGY: Fishing for SMID Consumption picks
Exhibit 1: Preferred consumption plays
Company
Page Ind.
Metro Brands
Devyani Intl.
LT Foods
Cello World
Lemon Tree Hotel
V-Mart Retail
MCap
CMP
(USDb)
FY25E
5.4
42,147 613.6
3.4
1,073 13.7
2.1
150
0.3
1.5
381
17.5
1.3
576
15.8
1.3
139
2.3
0.7
2,894
1.2
EPS (INR)
EPS
PE (x)
CAGR (%)
FY26E FY27E FY25-27E FY25E FY26E
709.4 841.0
17
68.7 59.4
17.1 21.8
26
78.6 62.6
1.7
2.2
191
572.9 90.9
22.9 27.5
25
21.7 16.6
17.5 23.7
22
36.4 32.9
3.9
4.6
43
61.6 35.7
26.8 60.9
600
2327.4 107.8
PB (x)
FY27E
50.1
49.2
67.5
13.9
24.3
30.2
47.5
FY25E
26.8
13.3
29.1
3.4
8.3
9.5
7.0
ROE (%)
FY26E FY27E FY25E FY26E FY27E
23.1 19.8 39.0 38.8 39.5
11.3
9.5
18.5 19.9 21.4
33.9 37.2
3.8
34.4 52.5
2.9
2.5
16.8 18.9 19.4
6.7
5.3
22.8 20.4 24.3
7.5
6.0
16.7 23.5 22.1
6.5
5.7
0.3
6.8
14.0
Source: Bloomberg, MOFSL
Exhibit 2: Three years performance of Nifty and Nifty FMCG
200
170
140
110
80
Nifty 50 Index - Rebased to 100
Nifty FMCG Index - Rebased to 100
181
148
Exhibit 3: FY25TD performance of Nifty and Nifty FMCG
130
Nifty 50 Index - Rebased to 100
Nifty FMCG Index - Rebased to 100
121
116
146
134
120
110
100
90
105
98
Source: MOFSL
Source: MOFSL
Exhibit 4: Three years performance of Nifty Consumption
and BSE Cons Discretionary Indices
220
185
150
115
80
188
BSE Consumer Discretionary Rebased to 100
Nifty Consumption Index Rebased to 100
199
Exhibit 5: FY25TD performance of Nifty Consumption and
BSE Cons Discretionary Indices
BSE Consumer Discretionary Rebased to 100
Nifty Consumption Index Rebased to 100
130
127
127
159
158
120
110
100
90
107
102
Source: MOFSL
Source: MOFSL
March 2025
2
 Motilal Oswal Financial Services
INDIA STRATEGY: Fishing for SMID Consumption picks
Exhibit 6: Central government schemes providing a much-needed push to consumption in both urban and rural sectors
Measure
Personal Income Tax
Stimulus
Description
New tax regime: Zero income tax for
annual incomes up to INR1.2mn revised
tax slabs put more money in hands of
households
Launch of the scheme
in 100 low-yield districts, benefiting 17
mn farmers; KCC loans up to INR5 lakh
extended to 77 mn farmers, fishers, and
dairy farmers
Announcement
Date
Expected Impact
These reforms aim to boost
disposable income, driving
consumption, savings, and
investment. The total revenue
foregone is estimated at INR1t.
By increasing agricultural productivity
and providing financial support to
farmers, these initiatives aim to boost
rural incomes, leading to higher
consumption in rural areas.
Source: MOFSL, Budget Documents, PIB
February 1, 2025
February 1, 2025
Pradhan Mantri
Dhan-Dhaanya Krishi
Yojana
Exhibit 7: Transfer schemes announced by some of the key states are likely to aid rural consumption
State
Maharashtra
Odisha
Delhi
Scheme Name
Mukhyamantri Majhi Ladki
Bahin Yojana
Subhadra Yojana
Mahila Samridhi Yojana
Beneficiaries
Women aged 21-65 from
economically weaker
sections
Women aged 21-60 from
economically weaker
sections
Eligible women residents
Monthly Payment
INR 1,500
INR 833.33 (INR
10,000 annually)
INR 2,500/month
Total Outlay
(INR bn)
INR 360 bn
~INR 100 bn
/annum
~INR 51 bn/
annum
Period
FY25-FY26
FY25-FY26
Source: MOFSL, PIB. Note: We have listed only three states in the list for illustrative purposes; several other states have also announced
similar schemes.
Exhibit 8: OMO actions announced by RBI to infuse liquidity into the banking system
Date
Quantum of Action
INR500 bn
INR 1 trillion
INR400 bn
INR200 bn
March 25, 2025
March 12 & 18, 2025
February 12, 2025
October 21, 2024
Details
RBI announced a government securities purchase worth INR500 bn to ease
liquidity pressures in the financial system.
In two separate auctions, RBI infused INR500 bn each, aimed at ensuring that
liquidity remained sufficient amid fiscal outflows.
In response to tightening financial conditions, RBI scaled up its bond purchases to
INR400 bn, injecting long-term liquidity.
The central bank stepped in with an OMO purchase worth INR200 bn to prevent
liquidity shortages from disrupting economic activity.
Source: Bloomberg, MOFSL
Exhibit 9: RBI has pivoted from a liquidity deficit stance to pushing surplus liquidity into the system to boost consumption
Action
Repo Rate Cut
Cash Reserve Ratio
(CRR) Cut
Explanation
Date
Quantum of
Action
Impact
Designed to boost consumption by
making loans cheaper, encouraging
spending and investment; RBI’s first
rate cut since May 2020
Released ~INR1.16 trillion into the
banking system
Aimed at addressing liquidity
shortages by providing short-term
rupee liquidity, thereby supporting
credit availability and economic
activity
Source: Bloomberg, MOFSL
Repo rate cut lowers borrowing costs for
February 7, 25bp (from 6.50%
banks, boosting lending to consumers
2025
to 6.25%)
and businesses
Reduction of the CRR to increase the
amount of funds available with banks
for lending purposes
Conducted a USD5b six-month
dollar/rupee buy-sell swap auction
Total USD20b (10+10) three-year
dollar/rupee swap auction
December 6, 50bp (from 4.5%
2024
to 4.0%)
January 31,
2025
~INR 435 bn.
(USD5b)
Foreign Exchange
(FX) Swap
February 28
and March
24, 2025
~INR1.7t
March 2025
3
 Motilal Oswal Financial Services
INDIA STRATEGY: Fishing for SMID Consumption picks
Exhibit 10: Consumption indices characteristically outperformed during previous phases of sharp market correction…
Median performance of sectors during the drawdown phase - from peak to trough
-13%
-14% -14%
-15%
-16%
-17%
-18% -18% -18% -19% -20% -20%
-20% -21% -22%
-25%
-27%
-29%
Source: Bloomberg, MOFSL. Note: We have considered 12 drawdown phases of Nifty 50 for this analysis starting from 2006 to 2025. when
Nifty 50 corrected at least 10% from its peak to trough. Phase 1: May’06 to Jun’06, 2: Feb’07 to Mar’07, 3: Jul’07 to Aug’07, 4: Jan’08 to Oct’08,
5: Nov’10 to Dec’11, 6: Mar’15 to Feb’16, 7: Jan’18 to Mar’18, 8: Aug’18 to Oct’18, 9: Jun’19 to Sep’19, 10: Jan’20 to Mar’20, 11: Oct’21 to
Jun’22, 12: Sep’24 to Mar’25.
Exhibit 11: … however, in the current drawdown phase, the Nifty Consumption and Nifty FMCG indices have underperformed
Sectoral fall during the current drawdown phase - from peak to trough (27 Sep'24 to 4 Mar'25)
-15%
-16%
-16%
-17%
-18% -19% -20% -20% -21% -21%
-22%
-23%
-24%
-26%
-26% -29%
-32%
-35%
Source: Bloomberg, MOFSL
Exhibit 12: Consumer P/E
P/E (x)
Min (x)
Avg (x)
+1SD
Max (x)
-1SD
Exhibit 13: Consumer P/BV
14.0
12.5
11.0
P/B (x)
Min (x)
Avg (x)
+1SD
Max (x)
-1SD
54.0
48.0
42.0
36.0
30.0
54.3
46.2
42.1
12.7
11.1
10.2
9.4
8.3
38.0
33.7
38.7
9.5
8.0
9.3
Source: MOFSL
Source: MOFSL
March 2025
4
 Motilal Oswal Financial Services
INDIA STRATEGY: Fishing for SMID Consumption picks
Exhibit 14: Retail P/E
P/E (x)
402.0
302.0
202.0
102.0
2.0
Min (x)
Avg (x)
+1SD
Max (x)
-1SD
Exhibit 15: Retail P/B
P/B (x)
20.0
15.0
10.0
Min (x)
Avg (x)
+1SD
Max (x)
-1SD
336.1
13.6
9.7
5.8
3.2
17.2
134.9
84.4
33.8
23.0
11.5
67.4
5.0
0.0
Source: MOFSL
Source: MOFSL
Exhibit 16: Consumer Durables P/E
P/E (x)
Min (x)
Avg (x)
+1SD
Max (x)
-1SD
Exhibit 17: Consumer Durables P/B
13.0
10.0
7.0
4.0
1.0
P/B (x)
Min (x)
Avg (x)
+1SD
Max (x)
-1SD
68.0
53.0
38.0
23.0
8.0
63.3
46.9
34.6
22.3
16.7
10.1
7.3
5.4
2.7
3.6
40.1
6.6
Source: MOFSL
Source: MOFSL
Exhibit 18: RBI cuts repo rate by 25bp to 6.25%
10
8
6
4
2
Exhibit 19: RBI cuts CRR by 50bp to 4%
4.9
4.3
Repo rate (%)
CRR (%)
6.25
3.7
3.1
2.5
4.0
Source: MOFSL
Source: MOFSL
March 2025
5
 Motilal Oswal Financial Services
INDIA STRATEGY: Fishing for SMID Consumption picks
Exhibit 20: Headline Inflation has eased to sub-4% YoY
Headline CPI Inflation (% yoy)
5.6
5.7
5.1
5.1
4.8
4.8
4.8
5.1
3.7
6.2
5.5
5.5
5.2
4.3
3.6
3.6
Source: MOFSL, Bloomberg
Exhibit 21: Liquidity deficit abates after multiple measures from RBI
RBI's net liquidity position (INR b)
Source: Bloomberg, MOFSL
March 2025
6
 Motilal Oswal Financial Services
INDIA STRATEGY: Fishing for SMID Consumption picks
Exhibit 22: Consumer continues to remain under-owned by top MFs
Sector
Auto
Banks-Private
Banks-PSU
Insurance
NBFC
Capital Goods
Cement
Chemicals
Consumer
Cons. Durables
Healthcare
Infra.
Media
Metals
Oil & Gas
Real Estate
Retail
IT
Telecom
Textiles
Utilities
Aditya
BSE200 Birla Sun Axis
Life
7.1
8.5
7.6
20.8
2.9
1.8
6.1
5.4
2.1
1.0
8.3
0.9
5.3
0.7
0.0
3.3
8.0
1.1
2.2
10.8
3.4
0.3
3.9
17.4
2.9
2.2
6.4
6.7
2.2
1.5
6.2
2.3
7.0
1.0
0.1
3.8
5.9
1.5
2.4
10.1
3.4
0.8
2.7
14.1
2.1
1.4
7.6
7.7
2.1
3.2
4.9
3.3
11.1
0.3
0.0
0.9
2.2
2.6
3.5
8.7
3.9
0.2
2.3
Bandhan
6.7
17.3
1.5
2.6
7.5
5.9
1.7
2.2
6.8
1.3
8.6
1.2
0.1
4.6
5.7
2.8
3.2
7.4
2.2
0.8
2.6
Canara
Robeco
8.8
13.5
2.4
1.8
6.9
10.3
2.3
2.0
6.2
3.2
7.9
0.2
0.2
0.8
2.8
1.4
3.7
7.5
2.6
0.4
3.8
DSP
9.2
16.0
2.3
2.6
7.6
5.4
1.5
5.5
5.6
2.0
11.6
1.0
0.0
4.2
5.0
1.2
1.6
7.5
2.9
0.8
2.0
Franklin
HDFC HSBC
Templeton
6.9
19.6
0.9
1.8
2.9
6.5
3.0
2.4
5.4
2.4
8.1
0.3
0.0
1.9
4.5
3.3
3.8
10.3
4.1
0.6
2.8
10.3
22.3
3.5
2.5
3.8
6.1
1.4
1.3
4.4
1.3
9.2
1.0
0.3
2.4
4.6
1.2
1.5
9.4
3.5
0.5
3.3
5.3
11.3
2.0
0.1
5.9
13.3
1.2
1.9
4.4
4.8
7.5
1.5
0.0
2.9
2.6
2.4
3.2
9.8
2.1
1.7
2.2
ICICI
Pru
9.8
19.3
2.7
3.6
3.4
6.7
3.3
1.7
6.2
0.4
6.7
0.7
0.3
3.0
7.5
1.5
2.1
8.0
3.7
0.1
4.8
Invesco
6.0
15.6
1.5
2.1
7.6
8.8
1.9
1.1
3.7
3.2
11.0
0.5
0.0
2.5
3.1
2.5
5.4
7.8
2.0
0.1
2.4
Kotak
Motilal Nippon
Mirae
PPFAS Quant SBI Sundaram TATA
Mahindra
Oswal India
9.1
13.4
3.6
1.3
4.7
8.2
3.5
3.5
4.7
2.6
7.5
1.0
0.3
2.9
6.1
1.5
2.1
10.2
3.7
1.5
2.3
6.6
18.6
3.2
2.7
4.6
5.7
1.7
1.1
4.8
1.7
9.4
0.8
0.0
4.3
5.3
1.5
2.4
8.6
3.6
1.2
2.2
4.9
4.6
0.7
0.3
5.0
16.5
0.4
2.0
1.5
6.8
5.6
0.5
0.0
2.5
2.0
2.6
10.9
16.4
5.0
0.4
0.4
6.1
16.0
3.2
2.0
6.1
8.8
1.6
1.5
5.5
2.5
7.5
0.8
0.2
1.9
5.9
0.6
2.8
7.0
1.9
0.5
9.7
18.2
12.3
30.4
0.3
0.0
12.5
0.3
0.0
0.0
6.8
0.0
6.3
0.1
0.0
0.2
1.7
0.4
0.1
8.3
0.1
4.6
1.9
0.4
5.2
8.8
4.8
2.3
2.8
10.6
0.2
11.3
3.8
1.5
3.8
15.0
1.3
2.9
0.1
2.3
1.8
6.6
7.6
22.4
3.1
1.2
5.5
5.7
2.4
1.3
7.8
0.8
5.6
1.2
0.0
2.7
7.8
1.0
2.4
10.3
3.9
0.6
3.2
8.0
16.7
3.2
1.7
5.8
7.9
2.6
2.0
5.1
1.6
8.2
0.7
0.2
1.1
5.2
1.7
4.9
7.4
4.4
0.0
1.9
5.3
14.7
2.1
1.6
6.6
6.0
2.8
3.7
5.3
1.2
7.4
1.3
0.2
1.8
5.1
2.3
2.3
15.4
2.9
0.5
3.1
UTI
8.0
23.6
2.3
1.3
4.9
4.3
1.8
0.9
7.5
1.4
6.2
0.7
0.1
2.6
6.3
0.6
3.5
12.3
3.9
0.2
2.7
Source: MOFSL, NAV India, AMFI
March 2025
7
 Motilal Oswal Financial Services
INDIA STRATEGY: Fishing for SMID Consumption picks
Page Industries
Y/E March
2025E 2026E 2027E
Sales
49.1 55.5 63.7
Sales Gr. (%)
7.2 13.0 14.9
EBITDA
10.1 11.5 13.4
EBITDA
Margin (%)
20.5 20.7 21.1
Adj. PAT
6.8
7.9
9.4
Adj. EPS (INR) 613.6 709.4 841.0
EPS Gr. (%)
20.2 15.6 18.5
BV/Sh.INR
1573.3 1828.0 2129.9
Ratios
RoE (%)
39.0 38.8 39.5
RoCE (%)
38.5 39.1 39.7
Payout (%)
90.0 75.0 75.0
Valuations
P/E (x)
68.7 59.4 50.1
P/BV (x)
26.8 23.1 19.8
EV/EBITDA (x)
45.9 40.2 34.1
Div. Yield (%)
1.1
1.1
1.3
Financials & Valuations (INR b)
PAGE has the right to win in India’s mega consumption theme:
India's per
capita innerwear consumption is low compared to global standards, offering
significant growth potential. The innerwear segment, currently 9% of the
apparel industry, is growing rapidly and is expected to reach INR835b by 2025.
PAGE dominates the mid-premium innerwear segment with a strong brand,
manufacturing control, and a diverse product portfolio. The growth prospects
for mass-premium brands like Jockey are substantial.
Men’s innerwear further strengthening leadership:
Men's innerwear is the
cornerstone of PAGE’s portfolio, contributing >50% to its revenue. The
company’s penetration rate is 18-20% of its target high-income households
(>INR0.5m income), demonstrating its leadership in the mid-to-premium
segment. The industry has registered a strong 10-year CAGR of 11-12%, with
PAGE outperforming at ~15% CAGR during the period. PAGE has a strong brand
franchise with a wide price range that can capitalize on upgrading existing
customers and expanding the customer base.
Women’s innerwear – more for more:
The women’s innerwear market
accounts for 65% of India’s total innerwear market, while its contribution in
revenue is <20%. PAGE has only 5-6% market penetration for its target high-
income households. This category presents a significant untapped potential,
especially among younger women who are increasingly seeking style,
functionality, and comfort in innerwear. PAGE has so far been under-indexed in
the segment, but it is now well-positioned to capitalize on growth by focusing
on product innovation and marketing efforts.
Athleisure a large canvas:
Athleisure has emerged as a fast-growing category
for PAGE, contributing ~25% to its revenue. Its product offering includes daily
wear, sleepwear, and performance wear, with daily wear contributing 60% of
the segment. PAGE is looking to expand its customer base by continuing to
launch affordable entry-level products alongside premium collections to
compete effectively with unorganized players.
Laying a strong foundation for success:
PAGE’s in-house manufacturing
produces over 280m pieces annually. Its expanded distribution network spans
2,710+ cities, supported by MBOs, EBOs, LFS, and e-commerce platforms. PAGE
leads in product innovation, with frequent new launches across segments.
Investments in digital tools and a revamped website have boosted supply chain
efficiency and online sales. The Jockey brand’s aspirational campaigns further
strengthen its market positioning and customer loyalty.
Valuation and view:
PAGE has demonstrated consistent revenue and earnings
growth over the past decade, with a 15% CAGR in sales, EBITDA, and PAT as of
FY24, alongside a robust RoE of over 40%. The company’s growth has been
driven by strong sales and efficient margin management. While there are gaps in
its women’s innerwear and athleisure portfolios, these segments offer
significant potential for expansion. PAGE maintains a healthy dividend payout
ratio and is expected to deliver strong earnings growth (~17% EPS CAGR from
FY25E to FY27E). Given its solid financial track record, high RoE, and growth
prospects, the stock is recommended as a BUY with a TP of INR 57,500, based on
a P/E multiple of 65x for Mar’27E EPS.
March 2025
8
 Motilal Oswal Financial Services
INDIA STRATEGY: Fishing for SMID Consumption picks
Metro Brands: Long runway for growth
Y/E March
2025E 2026E 2027E
Sales
25.1 29.1 34.1
Sales Gr. (%)
6.6 15.8 17.1
EBITDA
7.4
9.1 11.2
EBITDA
29.6 31.3 32.8
Margin (%)
Adj. PAT
3.7
4.7
5.9
Adj. EPS (INR)
13.7 17.1 21.8
EPS Gr. (%)
7.2 25.5 27.2
BV/Sh.INR
80.7 95.2 113.6
Ratios
RoE (%)
18.5 19.9 21.4
RoCE (%)
13.1 15.5 16.6
Payout (%)
17.6 17.6 17.6
Valuations
P/E (x)
78.6 62.6 49.2
P/BV (x)
13.3 11.3
9.5
EV/EBITDA (x)
39.0 31.6 25.5
EV/Sales (x)
11.5
9.9
8.3
Div. Yield (%)
0.2
0.3
0.4
Financials & Valuations (INR b)
FILA & Foot Locker remain key growth drivers:
Metro Brands’ (MBL) acquisition
of licenses for FILA and Foot Locker in India addresses the key whitespace in the
fastest-growing Sports & Athleisure (S&A) category. Though the ramp-up of FILA
and Foot Locker has been delayed due to challenges posed by BIS
implementation, we believe they remain the key growth drivers for MBL in the
long term. Given the long runway for growth in S&A, MBL can potentially open
300+ FILA stores (similar to top sportswear brands in India), which can generate
INR6-9b incremental sales over the medium term. Similarly, Foot Locker
provides MBL with premium play in sneakers and has the potential to generate
INR2.5-6b in incremental revenue from tier 1 cities over the medium term. We
believe that FILA and Foot Locker together have the potential to generate
~INR9-15b in sales (38-63% of MBL’s FY24 revenue) at margins similar to MBL’s
existing margin profile over the medium term.
Superior store economics remain a strong moat:
MBL’s superior store
economics (~INR20k SPF, ~2yrs store payback), combined with its disciplined
cost control, provide a strong moat. Even in a weak demand environment, MBL
has maintained healthy margins (57% gross, 28% EBITDA, 14% PAT). With FILA
liquidation largely behind and likely improvement in discretionary demand,
Same-Store Sales Growth (SSSG) and margins are expected to rebound in the
medium term, reinforcing MBL’s outperformance in the footwear segment.
Long runway for growth funded by internal accruals:
MBL has a presence of
895 stores across its format in <200 cities, which it can expand to 300 cities for
its Metro and Mochi formats while deepening its presence in existing cities.
Further, MBL can expand its presence in tier 3+ cities through its value format,
Walkway. The company’s expansion strategy is likely to be fully funded through
internal accruals, supported by a strong net cash position and ~INR13.5b in
Operating Cash Flow (OCF) over FY24-27. This financial strength allows MBL to
potentially double its store count over the next three years, while we
conservatively assume ~100-110 store additions annually over FY24-27.
Valuation and view:
Given the strong runway for growth in Metro, Mochi, and
Walkway formats, along with significant growth opportunities in FILA/Foot
Locker, we build in revenue/EBITDA/PAT CAGR of 13%/17%/20% over FY24-27E.
Post recent correction, MBL trades at ~50x FY27 P/E. We value MBL at 70x
Mar’27 P/E to arrive at our TP of INR1,525 per share. We have not factored in
any significant contributions from FILA and Foot Locker in our estimates till
FY27, and a faster ramp-up could provide a further upside potential. We
reiterate our BUY rating on MBL.
March 2025
9
 Motilal Oswal Financial Services
INDIA STRATEGY: Fishing for SMID Consumption picks
Devyani International
Financial & Valuation (INR b)
Y/E MARCH
2025E 2026E 2027E
Sales
49.4 55.5 62.9
Sales Gr. (%)
39.0 12.4 13.3
EBITDA
8.4 10.3 11.9
Margins (%)
17.1 18.6 18.9
Adj. PAT
0.3
2.0
2.7
Adj. EPS (INR)
0.3
1.7
2.2
EPS Gr. (%)
-66.0 530.0 34.6
BV/Sh.(INR)
5.2
4.4
4.0
Ratios
RoE (%)
3.8 34.4 52.5
RoCE (%)
4.2
8.9 10.0
Valuations
P/E (x)
572.9 90.9 67.5
P/BV (x)
29.1 33.9 37.2
EV/Sales (x)
4.3
3.9
3.4
Pre Ind-AS
36.9 28.2 23.5
EV/EBITDA (x)
Strong brand portfolio and market leadership:
As the largest franchisee for
Pizza Hut, KFC, and Costa Coffee in India, Devyani International benefits from
well-established, globally recognized brands with a loyal customer base,
providing it a competitive edge in the Indian QSR market.
KFC – focus on improving profitability:
KFC’s ADS declined to INR96k in 3QFY25
from INR116k in 3QFY23. As a result, ROM contracted to ~17% (down 250bp vs.
3QFY23). DIL continues to prioritize menu innovation and product launches
across its core brands to cater to evolving consumer preferences. KFC has
introduced value meal rolls (INR99), featuring flavors inspired by Korean, Thai,
and Indian cuisines. DIL sees potential for improving store efficiency, driven by
enhanced employee efficiency. The dine-in business requires higher man-hours,
creating scope for cost optimization at the store level. Hence, management is
hopeful for improvements in ROM in the coming quarters, even if ADS does not
show much improvement. DIL aims to achieve ROM of ~21%, even at an ADS of
~INR100k (peak ADS was INR120k-125k).
PH – looking to improve market share:
PH has been focusing on value offerings
to improve transaction growth. ADS fell to INR35k in 3QFY25 (20% down vs.
3QFY23), resulting in an ROM decline from 14% in 3QFY23 to 2% in 3QFY25. The
brand’s operating profitability has declined notably, with ADS/ROM trending
near the bottom (FY19 ADS/ROM was INR45k/15%). PH has implemented
various initiatives, such as product launches, which will drive recovery going
forward. It has also reintroduced its popular offerings, including Momo Mia
Pizza (INR299) and Melts Pizza (INR169).
Rapid store addition to continue:
Despite a slowdown in demand, DIL focuses
on store expansion. It is prioritizing small-format, capital-efficient stores for its
newly introduced brands, including Tealive, New York Fries (NYF), and Sanook
Kitchen. This strategy aims to balance growth with operational efficiency while
adapting to evolving market dynamics. DIL has been rapidly expanding its KFC
network, with a shift toward smaller store sizes—reducing from 3,000-3,500 sq.
ft. to 1,600 sq. ft. On average, ~25 KFC stores have been added per quarter over
the past eight quarters. For PH, the company adopted a more cautious approach
during 4QFY24 and 1QFY25, opening only five stores in total. However, it
resumed its expansion strategy in 2QFY25 and 3QFY25, adding 74 stores in total.
For FY25, we model store additions of 125 for KFC, 50 for PH, and 40 for Costa
Coffee, reflecting the company’s commitment to strategic growth across its
portfolio.
Valuation and view:
KFC’s store addition is expected to continue in FY26, while
PH’s store addition will be muted as management focuses on addressing ADS
and profitability challenges within the current network. We have recently
upgraded our view on the QSR universe from cautious to positive following the
tax relief announced in the Budget 2025 for middle-class income-tax payer.
Additionally, QSR companies have already factored in the dismal operating
performance. We reiterate our BUY rating on Devyani International with a TP of
INR215 (premised on 35x Mar’27E Pre-Ind-AS EV/EBITDA).
March 2025
10
 Motilal Oswal Financial Services
INDIA STRATEGY: Fishing for SMID Consumption picks
LT Foods: Emerging FMCG player
Y/E Mar
FY25E FY26E FY27E
Sales
88.8 102.2 115.7
EBITDA
9.9
12.0
14.0
PAT
6.1
8.0
9.5
EBITDA (%)
11.1
11.8
12.1
EPS (INR)
17.5
22.9
27.5
EPS Gr. (%)
2.7
30.7
19.9
BV/Sh. (INR)
112.1 130.1 152.5
Ratios
Net D/E
0.1
0.0
-0.1
RoE (%)
16.8
18.9
19.4
RoCE (%)
15.7
17.8
19.0
Valuations
P/E (x)
21.7
16.6
13.9
EV/EBITDA (x) 13.5
10.7
8.9
Financials & Valuations (INR b)
Market leadership & strong brand equity:
LT Foods is a leading player in the
global Basmati rice market, with a ~30% market share in India and over ~50% in
the U.S. under its flagship brands Daawat and Royal. The company has
transformed Indian rice from a loose commodity into a premium branded
product, leveraging its farm-to-fork model for quality control. With a presence in
80+ countries and a 15% revenue CAGR over FY19-24, LT Foods is well-
positioned to capture the growing global demand for branded Basmati rice.
Favorable industry trends & structural growth drivers:
The global rice market
was valued at USD376.5b in CY24 and is expected to post a 3% CAGR over FY24-
29. However, Basmati rice is set to grow at a faster 9% CAGR over FY24-32,
driven by rising disposable incomes, increased packaged food consumption, and
a growing preference for premium rice varieties. India, the world’s largest
Basmati producer with a 75% share, exported INR484 b worth of Basmati rice in
FY24, up 26% YoY, positioning LT Foods to benefit from increasing global
penetration.
Export-led growth with expanding global presence:
LT Foods is set to capitalize
on surging global demand for Basmati rice following the lifting of the Minimum
Export Price (MEP) and India’s record-high rice reserves, particularly in key
export markets like the Middle East, Europe, and the U.S. To strengthen its
global presence, the company is investing SAR185m in Saudi Arabia and
EUR50m in the UK, targeting EUR100m in revenue from Europe by FY26. While
Basmati paddy prices have currently declined 20% YoY, temporarily impacting
margins, the full benefits of lower procurement costs are expected to be
realized in FY26, driving profitability. Its Middle East sales rebounded 26% YoY in
FY24, supported by a strategic partnership with Saudi Agricultural and Livestock
Investment Company (SALIC), which holds a 9.22% stake in LT Foods, enhancing
distribution and market penetration.
Diversification into high-margin, value-added segments:
Beyond its core rice
business, LT Foods is expanding into higher-margin segments to enhance
profitability and drive long-term growth. The organic foods segment contributes
9% of revenue, with a target of achieving double-digit growth, while the
Convenience & Health (C&H) segment is expected to grow from 3% to 10% of
revenue over the next five years, led by Ready-to-Heat (RTH) and Ready-to-Cook
(RTC) products. To support this expansion, the company is doubling its U.S. RTH
production capacity, aiming for a 33-35% CAGR in C&H over the next five years,
driven by growing consumer demand for convenience foods. These strategic
investments in value-added segments and international markets position LT
Foods for sustained margin expansion and long-term shareholder value
creation.
Valuation and view:
With 69% of its revenue derived from exports, LT Foods is
well-positioned to benefit from rising global demand, particularly in key markets
like the Middle East, Europe, and the U.S. Additionally, margin improvements
are expected from 2QFY26, as the company starts benefiting from low-priced
inventory. We expect LT Foods to report a revenue/EBITDA/PAT CAGR of
14%/19%/25% over FY25-27. At 17x FY27E EPS, we arrive at a TP of INR 460,
offering strong upside potential. We reiterate our BUY rating.
March 2025
11
 Motilal Oswal Financial Services
INDIA STRATEGY: Fishing for SMID Consumption picks
Cello: Greeting the world with Cello!
Financials & Valuation (INR b)
Y/E March
Sales
EBITDA
Adj. PAT
EBITDA
Margin (%)
Adj. EPS (INR)*
EPS Gr. (%)
BV/Sh. (INR)
Ratios
Net D:E
RoE (%)
RoCE (%)
Valuations
P/E (x)
EV/EBITDA (x)
*Cons.
36.4
22.5
32.9
19.5
24.3
14.4
-0.1
22.8
23.9
-0.3
20.4
23.9
-0.4
24.3
26.0
FY25E FY26E FY27E
21.0
5.0
3.4
23.8
15.8
1.3
69.2
24.6
5.7
3.7
23.2
17.5
10.8
29.3
7.5
5.0
25.6
23.7
35.4
86.0 108.9
Market leadership with strong brand equity:
CELLO has established itself as a
leading consumer products brand with a diversified presence across consumer
houseware & glassware (66% of FY24 revenue), writing instruments & stationery
(17%), and moulded furniture & allied products (17%). The company benefits
from strong brand recall, extensive product innovation (17,000+ SKUs), and a
vast distribution network with 3,500+ distributors and 1,45,000+ retailers. Its in-
house manufacturing (~77% of revenue) ensures product quality and cost
control. The successful expansion of new categories, including writing
instruments (relaunched in CY19 under 'Unomax', which posted a 44% CAGR
over FY21-24 and generated INR3.3b in revenue) and glassware (launched in
CY17, growing at a 23% CAGR over FY21-24), demonstrates its ability to scale
businesses effectively.
Expanding TAM and category growth:
CELLO operates in high-growth consumer
categories, with the TAM expected to grow at a 13% CAGR over FY24-27,
reaching INR1,229 billion by FY27. The consumer houseware segment, its largest
business, is set to expand at 12% CAGR over FY24-27, while opalware and
glassware are poised for 18% and 71% CAGR growth, respectively. To capitalize
on this demand, CELLO is aggressively scaling its glassware production with a
new 20,000 MTPA plant in Rajasthan (commercialized in Feb’25
)
, reducing
dependence on imports. Additionally, the writing instruments and stationery
market (INR439b in FY24) is projected to grow at a 14% CAGR, presenting
another major opportunity for CELLO’s Unomax brand to further penetrate both
domestic and export markets.
Capacity expansion and operational efficiency:
To support its growth strategy,
CELLO expanded its opalware capacity at Daman by 10,000 MT, bringing the
total capacity to 25,000 MT in FY24. This expansion enhances self-sufficiency
and reduces reliance on imports. In the writing instruments business, export
headwinds in FY24 have now stabilized, with orders rebounding in 4QFY25,
indicating a return to growth in the segment. However, near-term challenges
include weaker domestic demand and discretionary spending pressures, which
led to pricing discounts in 3QFY25 to stimulate demand. Despite this, CELLO
maintains strong operational efficiencies, stable input prices, and a robust
distribution network, positioning it well for long-term growth.
Premiumization and market expansion strategy:
CELLO is strategically shifting
towards premium and value-added products, driving higher realizations and
brand differentiation. The consumerware segment is evolving with increased
demand for premium opalware and glassware, where CELLO’s strong brand
positioning and in-house manufacturing capabilities (77% of revenue) provide a
competitive edge. Furthermore, premiumization in writing instruments and an
increased focus on international markets are expected to drive sustained
demand across all key segments, reinforcing CELLO’s long-term growth
trajectory.
Valuation and view:
CELLO is a leading player with a strong brand reputation
and extensive distribution network. It benefits from a growing TAM driven by
favorable demographics, rising discretionary spending, and evolving gifting
trends. We estimate CELLO to deliver a revenue/EBITDA/Adj. PAT CAGR of
14%/14%/15% over FY24-27. CELLO is currently trading at 23x FY27E P/E with a
RoE/RoCE of 24%/26% in FY27E. We reiterate our BUY rating with a TP of
INR800 (premised on 34x FY27E P/E).
12
March 2025
 Motilal Oswal Financial Services
INDIA STRATEGY: Fishing for SMID Consumption picks
Lemon Tree: Steady growth ahead
Financial & Valuation (INR b)
Y/E MARCH 2025E 2026E
Sales
12.8
15.3
EBITDA
6.3
7.9
Adj. PAT
1.8
3.0
EPS (INR)*
48.7
51.9
EPS Gr. (%)
2.3
3.9
BV/Sh. (INR) 18.8
72.6
Ratios
Net D:E
1.3
0.7
RoE (%)
16.7
23.5
RoCE (%)
11.7
16.5
Valuations
P/E (x)
61.6
35.7
P/BV (x)
19.8
15.0
*
Adjusted
2027E
16.5
8.6
3.6
52.2
4.6
18.0
0.3
22.1
19.3
30.2
13.1
Aurika a catalyst:
LEMONTRE continues to expand into the luxury segment with
the ramp-up of Aurika Mumbai (current OR of ~80-85%); the anticipated signing
of Aurika Varanasi, which is expected to command an ARR five times higher than
other Aurika properties; and the redevelopment of Shillong’s Orchid Hotel into
an Aurika under a PPP model with the Government of Meghalaya. These
strategic developments are set to drive RevPAR growth, primarily led by an
increase in ARR.
Strong pipeline of management contracts:
As of 31
st
Dec’24, the company’s
operational portfolio consists of 112/10,317 hotels/rooms, of which ~63%/44%
are under managed contracts. Going forward, ~98%/97% of the hotels/rooms in
the company’s pipeline will be under managed contracts, reflecting the
company’s strong commitment towards the asset light structure. We expect
revenue from management contracts to witness a CAGR of ~31% over FY24-
FY27, reporting a revenue of INR1.1b.
Favorable macroeconomic environment:
The FY26 Union Budget’s focus on
developing 50 tourist destinations and streamlining e-visa processes, coupled
with INR depreciation, is set to boost foreign tourist arrivals and overall
hospitality demand. These factors create a favorable environment for
LEMONTRE, particularly its expansion into the luxury segment with Aurika
properties. With increasing occupancy and higher ARR driven by rising
international and domestic travel, the company is well-positioned for sustained
RevPAR growth and enhanced market presence.
Demand driven by MICE activities and religious travel:
The strong demand
momentum in the hospitality sector, driven by MICE activities in metro cities like
Mumbai, Delhi, Bengaluru, and Hyderabad, is likely to continue due to the
uptick in large conventions and corporate events. Meanwhile, key religious
destinations like Ayodhya, Hampi, Vrindavan, Ujjain, Prayagraj, and Makkah are
expected to witness significant traction, led by the growth in religious tourism.
The company is set to capitalize on this growth with its well-established
presence in key metro cities and a strong pipeline of hotels for key religious
cities.
Valuation and view:
LEMONTRE is likely to maintain a healthy growth
momentum, led by 1) the ramp-up of Aurika Mumbai and the expansion of
Aurika brand, 2) accelerated growth in the management contract (pipeline of
~5,879 rooms), and 3) the timely completion of the portfolio’s renovation
leading to improved OR, ARR, and EBITDA margins. We expect LEMONTRE to
post a CAGR of 16%/19%/34% in revenue/EBITDA/ Adj. PAT over FY24-27 and
RoCE to improve to 19.3% by FY27 from ~10.2% in FY24. We reiterate our BUY
rating on the stock with our SoTP-based TP of INR190.
March 2025
13
 Motilal Oswal Financial Services
INDIA STRATEGY: Fishing for SMID Consumption picks
V-Mart:
Outperforming amid weak demand environment
Y/E March
2025E 2026E 2027E
Sales
32.7 38.2 44.9
Sales Gr. (%)
17.3 16.8 17.5
EBITDA
3.9
4.9
6.2
EBITDA
11.9 12.7 13.7
Margin (%)
Adj. PAT
0.02
0.5
1.2
Adj. EPS (INR)
1.2 26.8 60.9
EPS Gr. (%)
LP 2,058 126.9
BV/Sh.INR
414.1 443.4 510.0
Ratios
RoE (%)
0.3
6.8 14.0
RoCE (%)
5.2
7.1
9.3
Valuations
P/E (x)
2327 107.8 47.5
P/BV (x)
7.0
6.5
5.7
EV/Sales (x)
2.2
1.9
1.7
EV/EBITDA (x)
18.9 15.2 12.2
Div. Yield (%)
0.0
0.0
0.0
Financials & Valuations (INR b)
Strong performance amid weak discretionary demand:
Among the broader
retail universe, value retailers have outperformed, driven by healthy SSSG,
despite weak discretionary environment. The value retail sector is experiencing
strong growth, driven by rising customer preference for one-stop-shop
organized retailers, and V-Mart has been a key beneficiary of this trend.
Compared to ~5-8% cut in EBITDA for our retail coverage since 2QFY25, V-Mart
has been an outlier with 3-8% EBITDA upgrade, driven by a reduction in Lime
Road (LR) losses. Management’s strategic focus on volume-led growth, cost
optimization, and strategic store expansion has enabled V-MART to outperform
in a challenging retail environment. The company has successfully navigated
macro challenges by optimizing its store portfolio, closing unprofitable locations,
and leveraging seasonal demand drivers like weddings and winter-wear sales.
With the likely revival of consumer sentiment in semi-urban and rural markets,
improving disposable incomes, and continued store expansions, V-MART
remains well-positioned to sustain outperformance.
LR loss reduction to boost V-Mart’s profitability:
The reduction in LR losses has
played a crucial role in V-Mart’s improving profitability, as the online fashion
marketplace was a major drag on earnings. V-Mart has implemented significant
cost rationalization measures, including reducing marketing expenses,
streamlining logistics, and optimizing operational costs, which has narrowed
LR’s losses. By containing LR’s losses, V-Mart can focus on strengthening its core
offline business and allocate capital towards more profitable initiatives, such as
accelerating store openings to improve overall profitability in a highly
competitive value retail market.
Unlimited's revival improved V-Mart’s growth prospects:
Unlimited, which was
initially a drag on profitability due to high operational costs and
underperforming legacy stores, has seen a notable improvement in 3QFY25,
with 11% SSSG and a rise in throughput to INR1,900 psf. V-Mart’s strategic
approach of optimizing its store portfolio by closing unprofitable stores while
focusing on improving product mix, pricing, and inventory optimization in
profitable locations has yielded positive results. Cost synergies between V-Mart
and Unlimited, such as supply chain optimization and better inventory
management, have further ensured sustainable long-term profitability.
Valuation:
We expect a CAGR of 17%/42% in revenue/EBITDA over FY24-27,
driven by high-single-digit SSSG and lower losses in LR. We value V-MART at 15x
Mar’27E EV/EBITDA (~25x FY27E pre-IND AS 116 EBITDA) to arrive at our TP of
INR 3,850.
Rising competition in value retail a key risk:
Given the rising presence of
numerous value retailers in smaller towns, we believe there would be: 1) an
impact on footfalls for the incumbent, 2) pricing pressure leading to lower
margins, and 3) higher rental inflation, which could weigh on both growth as
well as margins. Over the longer term, we will watch out for rising competitive
intensity in the value retail space.
March 2025
14
 Motilal Oswal Financial Services
INDIA STRATEGY: Fishing for SMID Consumption picks
Exhibit 23: MOFSL Consumer Universe performance across time horizons
Index
Nifty
Nifty FMCG
Nifty Consumption
Mkt Cap (INR b)
Ticker
Nifty Index
NSEFMCG INDEX
NSECON INDEX
FY25YTD (%)
5
-2
7
FY25YTD
-19
-2
-11
-3
34
-11
-1
-21
0
-22
103
27
-14
22
-6
-18
-11
11
23
-4
-2
-17
-1
-40
30
23
-14
-42
-9
13
0
40
10
-7
NA
NA
-47
-37
0
-25
-33
-17
30
-16
34
-10
-26
-52
39
-23
7
25
Company Name
Asian Paints
Britannia
Colgate
Dabur
Emami
Godrej Consumer
Hind. Unilever
Indigo Paints
ITC
Jyothy Labs
L T Foods
Marico
Nestle
Page Industries
Pidilite Inds.
P&G Hygiene
Tata Consumer
United Breweries
United Spirits
Varun Beverages
Havells India
KEI Industries
Polycab India
R R Kabel
Voltas
Aditya Birla Fashion
Avenue Supermarts
Barbeque Nation
Bata India
Campus Activewear
Devyani Intl.
Jubilant Foodworks
Kalyan Jewellers
Metro Brands
P N Gadgil Jewellers
Raymond Lifestyle
Relaxo Footwear
Restaurant Brands
Sapphire Foods
Senco Gold
Shoppers Stop
Titan Company
Trent
Vedant Fashions
V-Mart Retail
Westlife Foodworld
Cello World
Dreamfolks Services
Indian Hotels
Kajaria Ceramics
Lemon Tree Hotel
Zomato
2,181
1,149
661
884
242
1,109
5,172
48
5,119
125
124
805
2,123
453
1,388
438
937
502
995
1,801
952
312
782
101
486
297
2,495
11
159
77
185
414
448
286
70
70
101
31
100
41
54
2,736
1,870
184
58
110
120
12
1,119
141
107
2,106
Sector
Consumer
Consumer
Consumer
Consumer
Consumer
Consumer
Consumer
Consumer
Consumer
Consumer
Consumer
Consumer
Consumer
Consumer
Consumer
Consumer
Consumer
Consumer
Consumer
Consumer
Consumer Durables
Consumer Durables
Consumer Durables
Consumer Durables
Consumer Durables
Retail
Retail
Retail
Retail
Retail
Retail
Retail
Retail
Retail
Retail
Retail
Retail
Retail
Retail
Retail
Retail
Retail
Retail
Retail
Retail
Retail
Others
Others
Others
Others
Others
Others
Peak of Sep 2024 (%)
-11
-20
-17
% Chg
Peak of Sep 2024
-31
-23
-36
-20
-23
-20
-24
-32
-18
-37
-4
-9
-17
0
-16
-16
-20
-11
-13
-12
-27
-31
-29
-46
-23
-28
-24
-55
-14
-31
-23
-9
-33
-16
-30
-54
-46
-43
-16
-61
-39
-17
-34
-42
-28
-22
-35
-49
16
-40
14
-18
3 Year (%)
10
13
17
3 Year
-9
15
16
-2
9
14
3
-15
20
33
70
8
9
-1
5
-1
8
9
16
62
9
32
28
NA
5
-6
-1
-39
-14
NA
-5
6
100
21
NA
NA
-26
-14
2
NA
3
8
59
-7
-10
15
NA
NA
51
-5
30
40
Source: Bloomberg, MOFSL
March 2025
15
 Motilal Oswal Financial Services
INDIA STRATEGY: Fishing for SMID Consumption picks
Exhibit 24: MOFSL Consumer Universe Marketcap and PAT
Company Name
Page Industries
United Breweries
United Spirits
Indigo Paints
Asian Paints
Pidilite Inds.
Britannia
Colgate
Dabur
Emami
Godrej Consumer
Hind. Unilever
ITC
Jyothy Labs
Marico
Nestle
P&G Hygiene
Tata Consumer
Varun Beverages
L T Foods
R R Kabel
KEI Industries
Polycab India
Havells India
Voltas
Vedant Fashions
Raymond Lifestyle
Relaxo Footwear
Bata India
Metro Brands
Campus Activewear
Senco Gold
Titan Company
Kalyan Jewellers
P N Gadgil Jewellers
Barbeque Nation
Restaurant Brands
Westlife Foodworld
Sapphire Foods
Devyani Intl.
Jubilant Foodworks
Shoppers Stop
Avenue Supermarts
Aditya Birla Fashion
Trent
Mar-22
482
394
646
76
2,954
1,247
772
419
948
197
764
4,813
3,089
54
651
1,676
468
716
408
25
0
114
353
722
412
235
0
265
252
166
0
0
2,252
61
0
49
50
75
94
211
348
52
2,593
283
453
Mcap (INR b)
27th Sep 21st Mar
Mar-24
2024 Peak 2025
384
469
470
459
825
60
2,731
1,533
1,183
737
927
187
1,280
5,320
5,348
162
643
2,528
550
1,044
1,817
65
174
312
761
949
365
225
0
203
175
314
65
60
3,375
441
0
19
50
125
100
181
296
83
2,945
195
1,403
577
1,161
70
3,176
1,711
1,510
1,024
1,122
328
1,420
6,969
6,538
199
897
2,647
533
1,189
1,977
137
193
379
1,061
1,273
618
328
145
200
186
347
107
114
3,388
729
104
25
56
145
119
236
454
91
3,320
377
2,785
512
1,012
47
2,206
1,438
1,160
654
899
252
1,137
5,281
5,078
127
818
2,184
449
950
1,821
132
105
276
751
929
473
190
66
109
160
292
74
47
2,809
485
72
11
32
113
101
181
415
56
2,536
309
1,830
PAT (INR b)
FY24
5.7
4.1
11.4
1.5
55.6
18.0
21.4
13.4
18.8
7.9
19.8
102.7
204.6
3.6
14.8
39.6
7.2
13.7
20.6
5.9
3.0
5.8
17.8
12.7
2.4
4.1
4.9
2.0
2.9
3.5
0.9
1.8
35.0
6.0
1.5
-0.1
-2.1
0.7
0.5
0.9
2.6
0.6
25.4
-7.5
10.4
FY25E
6.8
4.7
13.9
1.3
42.8
20.9
21.8
14.4
18.6
8.8
19.8
103.5
200.8
3.8
16.3
31.6
8.2
14.4
25.9
6.1
2.5
6.5
18.8
13.8
8.3
4.1
2.4
1.7
2.8
3.7
1.3
1.7
38.1
8.2
2.4
-0.1
-2.3
0.1
0.4
0.3
3.0
0.1
27.4
-5.8
16.0
FY26E
7.9
7.5
15.7
1.6
48.2
24.2
25.0
15.9
21.0
9.6
24.5
115.8
217.0
4.3
18.3
35.4
9.1
17.5
34.2
8.0
3.7
7.8
22.2
16.9
10.0
4.9
3.7
2.0
3.2
4.7
1.6
2.3
47.5
10.7
3.1
0.0
-1.4
0.8
1.0
2.0
4.3
0.1
32.6
-0.7
21.8
FY27E
9.4
9.9
17.5
1.8
55.1
27.7
28.2
17.3
23.9
10.4
28.4
127.2
234.3
4.8
20.1
39.6
10.1
19.9
42.0
9.5
5.0
9.6
26.2
20.7
12.6
5.7
4.6
2.3
3.9
5.9
2.0
2.8
56.8
13.3
3.9
0.1
-0.2
1.4
1.5
2.7
5.9
0.5
38.9
-0.7
27.8
30%
-9%
-5%
-24%
14%
7%
30%
65%
nm
nm
-38%
-52%
-66%
-33%
-50%
7%
nm
163%
FY24
0%
25%
23%
27%
31%
41%
10%
27%
9%
16%
13%
1%
10%
55%
14%
62%
15%
26%
37%
47%
57%
22%
40%
19%
-37%
-3%
PAT Growth YoY (%)
FY25E
20%
14%
22%
-9%
-23%
16%
2%
8%
-1%
12%
0%
1%
-2%
6%
10%
-20%
14%
5%
26%
3%
-16%
12%
5%
9%
247%
-2%
-52%
-15%
-3%
7%
41%
-3%
9%
38%
53%
nm
nm
-84%
-23%
-66%
17%
-86%
8%
nm
54%
FY26E
16%
60%
13%
19%
13%
16%
15%
10%
13%
9%
24%
12%
8%
13%
12%
12%
11%
22%
32%
31%
49%
21%
18%
22%
21%
20%
58%
16%
13%
25%
27%
29%
25%
30%
30%
nm
nm
641%
153%
530%
43%
-21%
19%
nm
36%
FY27E
19%
32%
11%
15%
14%
15%
13%
9%
14%
8%
16%
10%
8%
10%
10%
12%
11%
13%
23%
20%
33%
22%
18%
23%
25%
18%
25%
18%
22%
27%
26%
23%
20%
23%
28%
nm
nm
74%
53%
35%
36%
661%
20%
nm
27%
March 2025
16
 Motilal Oswal Financial Services
INDIA STRATEGY: Fishing for SMID Consumption picks
Company Name
V-Mart Retail
Dreamfolks Services
Cello World
Kajaria Ceramics
Lemon Tree Hotel
Zomato
Indian Hotels
Swiggy
Consumer
Consumer Durables
Retail
Others
TOTAL
Mar-22
78
0
0
162
50
648
339
0
20,801
1,601
7,517
1,199
31,118
Mcap (INR b)
27th Sep 21st Mar
Mar-24
2024 Peak 2025
43
79
57
26
164
184
103
1,606
841
0
27,785
2,561
10,301
2,925
43,572
24
195
235
97
2,457
1,011
0
33,654
3,524
13,337
4,019
54,533
12
127
141
110
2,196
1,173
800
26,627
2,533
9,944
5,495
44,599
PAT (INR b)
FY24
-1.0
0.7
3.3
4.2
1.5
3.5
12.6
-23.4
590
42
93
2
727
FY25E
0.0
0.7
3.4
3.5
1.8
7.1
16.8
-29.4
585
50
106
4
744
FY26E
0.5
1.0
3.7
4.0
3.0
22.7
21.7
-24.3
661
61
145
32
898
FY27E
1.2
1.2
5.0
4.6
3.6
47.4
25.7
-15.2
737
74
181
72
1,064
FY24
nm
-5%
24%
25%
26%
nm
26%
nm
16%
23%
5%
nm
21%
PAT Growth YoY (%)
FY25E
nm
0%
1%
-17%
19%
101%
34%
nm
-1%
20%
13%
61%
2%
FY26E
2058%
44%
11%
14%
73%
222%
29%
nm
13%
22%
37%
735%
21%
FY27E
127%
20%
35%
15%
18%
109%
19%
nm
12%
22%
25%
127%
18%
Source: Bloomberg, MOFSL
Investment in securities market are subject to market risks. Read all the related documents carefully before investing.
March 2025
17
 Motilal Oswal Financial Services
INDIA STRATEGY: Fishing for SMID Consumption picks
NOTES
March 2025
18
 Motilal Oswal Financial Services
INDIA STRATEGY: Fishing for SMID Consumption picks
*In case the recommendation given by the Research Analyst is inconsistent with the investment rating legend for a continuous period of 30 days, the Research Analyst shall be within following
30 days take appropriate measures to make the recommendation consistent with the investment rating legend.
Disclosures
The following Disclosures are being made in compliance with the SEBI Research Analyst Regulations 2014 (herein after referred to as the Regulations).
Motilal Oswal Financial Services Ltd. (MOFSL) is a SEBI Registered Research Analyst having registration no. INH000000412. MOFSL, the Research Entity (RE) as defined in the Regulations,
is engaged in the business of providing Stock broking services, Depository participant services & distribution of various financial products. MOFSL is a listed public company, the details in
respect of which are available on
www.motilaloswal.com.
MOFSL (erstwhile Motilal Oswal Securities Limited - MOSL) is registered with the Securities & Exchange Board of India (SEBI) and is
a registered Trading Member with National Stock Exchange of India Ltd. (NSE) and Bombay Stock Exchange Limited (BSE), Multi Commodity Exchange of India Limited (MCX) and National
Commodity & Derivatives Exchange Limited (NCDEX) for its stock broking activities & is Depository participant with Central Depository Services Limited (CDSL) National Securities Depository
Limited (NSDL),NERL, COMRIS and CCRL and is member of Association of Mutual Funds of India (AMFI) for distribution of financial products and Insurance Regulatory & Development
Authority of India (IRDA) as Corporate Agent for insurance products.
Details of associate entities of Motilal Oswal Financial Services Limited are available on the website at
http://onlinereports.motilaloswal.com/Dormant/documents/List%20of%20Associate%20companies.pdf
MOFSL and its associate company(ies), their directors and Research Analyst and their relatives may; (a) from time to time, have a long or short position in, act as principal in, and buy or sell
the securities or derivatives thereof of companies mentioned herein. (b) be engaged in any other transaction involving such securities and earn brokerage or other compensation or act as a
market maker in the financial instruments of the company(ies) discussed herein or act as an advisor or lender/borrower to such company(ies) or may have any other potential conflict of
interests with respect to any recommendation and other related information and opinions.; however the same shall have no bearing whatsoever on the specific recommendations made by the
analyst(s), as the recommendations made by the analyst(s) are completely independent of the views of the associates of MOFSL even though there might exist an inherent conflict of interest in
some of the stocks mentioned in the research report.
MOFSL and / or its affiliates do and seek to do business including investment banking with companies covered in its research reports. As a result, the recipients of this report should be aware
that MOFSL may have a potential conflict of interest that may affect the objectivity of this report. Compensation of Research Analysts is not based on any specific merchant banking, investment
banking or brokerage service transactions. Details of pending Enquiry Proceedings of Motilal Oswal Financial Services Limited are available on the website at
https://galaxy.motilaloswal.com/ResearchAnalyst/PublishViewLitigation.aspx
A graph of daily closing prices of securities is available at
www.nseindia.com, www.bseindia.com.
Research Analyst views on Subject Company may vary based on Fundamental research and
Technical Research. Proprietary trading desk of MOFSL or its associates maintains arm’s length distance with Research Team as all the activities are segregated from MOFSL research activity
and therefore it can have an independent view with regards to Subject Company for which Research Team have expressed their views.
Regional Disclosures (outside India)
This report is not directed or intended for distribution to or use by any person or entity resident in a state, country or any jurisdiction, where such distribution, publication, availability or use
would be contrary to law, regulation or which would subject MOFSL & its group companies to registration or licensing requirements within such jurisdictions.
For Hong Kong:
This report is distributed in Hong Kong by Motilal Oswal capital Markets (Hong Kong) Private Limited, a licensed corporation (CE AYY-301) licensed and regulated by the Hong Kong Securities
and Futures Commission (SFC) pursuant to the Securities and Futures Ordinance (Chapter 571 of the Laws of Hong Kong) “SFO”. As per SEBI (Research Analyst Regulations) 2014 Motilal
Oswal Securities (SEBI Reg. No. INH000000412) has an agreement with Motilal Oswal capital Markets (Hong Kong) Private Limited for distribution of research report in Hong Kong. This report
is intended for distribution only to “Professional Investors” as defined in Part I of Schedule 1 to SFO. Any investment or investment activity to which this document relates is only available to
professional investor and will be engaged only with professional investors.” Nothing here is an offer or solicitation of these securities, products and services in any jurisdiction where their offer
or sale is not qualified or exempt from registration. The Indian Analyst(s) who compile this report is/are not located in Hong Kong & are not conducting Research Analysis in Hong Kong.
For U.S.
Motilal Oswal Financial Services Limited (MOFSL) is not a registered broker - dealer under the U.S. Securities Exchange Act of 1934, as amended (the"1934 act") and under applicable state
laws in the United States. In addition MOFSL is not a registered investment adviser under the U.S. Investment Advisers Act of 1940, as amended (the "Advisers Act" and together with the 1934
Act, the "Acts), and under applicable state laws in the United States. Accordingly, in the absence of specific exemption under the Acts, any brokerage and investment services provided by
MOFSL, including the products and services described herein are not available to or intended for U.S. persons. This report is intended for distribution only to "Major Institutional Investors" as
defined by Rule 15a-6(b)(4) of the Exchange Act and interpretations thereof by SEC (henceforth referred to as "major institutional investors"). This document must not be acted on or relied on
by persons who are not major institutional investors. Any investment or investment activity to which this document relates is only available to major institutional investors and will be engaged in
only with major institutional investors. In reliance on the exemption from registration provided by Rule 15a-6 of the U.S. Securities Exchange Act of 1934, as amended (the "Exchange Act") and
interpretations thereof by the U.S. Securities and Exchange Commission ("SEC") in order to conduct business with Institutional Investors based in the U.S., MOFSL has entered into a
chaperoning agreement with a U.S. registered broker-dealer, Motilal Oswal Securities International Private Limited. ("MOSIPL"). Any business interaction pursuant to this report will have to be
executed within the provisions of this chaperoning agreement.
The Research Analysts contributing to the report may not be registered /qualified as research analyst with FINRA. Such research analyst may not be associated persons of the U.S. registered
broker-dealer, MOSIPL, and therefore, may not be subject to NASD rule 2711 and NYSE Rule 472 restrictions on communication with a subject company, public appearances and trading
securities held by a research analyst account.
For Singapore
In Singapore, this report is being distributed by Motilal Oswal Capital Markets (Singapore) Pte. Ltd. (“MOCMSPL”) (UEN 201129401Z), which is a holder of a capital markets services license
and an exempt financial adviser in Singapore.This report is distributed solely to persons who (a) qualify as “institutional investors” as defined in section 4A(1)(c) of the Securities and Futures
Act of Singapore (“SFA”) or (b) are considered "accredited investors" as defined in section 2(1) of the Financial Advisers Regulations of Singapore read with section 4A(1)(a) of the SFA.
Accordingly, if a recipient is neither an “institutional investor” nor an “accredited investor”, they must immediately discontinue any use of this Report and inform MOCMSPL .
In respect of any matter arising from or in connection with the research you could contact the following representatives of MOCMSPL. In case of grievances for any of the services rendered by
MOCMSPL write to
grievances@motilaloswal.com.
Nainesh Rajani
Email:
nainesh.rajani@motilaloswal.com
Contact: (+65) 8328 0276
.
Specific Disclosures
1. Research Analyst and/or his/her relatives do not have a financial interest in the subject company(ies), as they do not have equity holdings in the subject company(ies).
MOFSL has financial interest in the subject company(ies) at the end of the week immediately preceding the date of publication of the Research Report: Yes.
Nature of Financial interest is holding equity shares or derivatives of the subject company
2. Research Analyst and/or his/her relatives do not have actual/beneficial ownership of 1% or more securities in the subject company(ies) at the end of the month immediately
preceding the date of publication of Research Report.
MOFSL has actual/beneficial ownership of 1% or more securities of the subject company(ies) at the end of the month immediately preceding the date of publication of Research
Report:No
3. Research Analyst and/or his/her relatives have not received compensation/other benefits from the subject company(ies) in the past 12 months.
MOFSL may have received compensation from the subject company(ies) in the past 12 months.
4. Research Analyst and/or his/her relatives do not have material conflict of interest in the subject company at the time of publication of research report.
MOFSL does not have material conflict of interest in the subject company at the time of publication of research report.
5. Research Analyst has not served as an officer, director or employee of subject company(ies).
6. MOFSL has not acted as a manager or co-manager of public offering of securities of the subject company in past 12 months.
7. MOFSL has not received compensation for investment banking /merchant banking/brokerage services from the subject company(ies) in the past 12 months.
Explanation of Investment Rating
Investment Rating
BUY
SELL
NEUTRAL
UNDER REVIEW
NOT RATED
Expected return (over 12-month)
>=15%
< - 10%
< - 10 % to 15%
Rating may undergo a change
We have forward looking estimates for the stock but we refrain from assigning recommendation
March 2025
19
 Motilal Oswal Financial Services
INDIA STRATEGY: Fishing for SMID Consumption picks
MOFSL may have received any compensation for products or services other than investment banking or merchant banking or brokerage services from the subject company(ies)
in the past 12 months.
9. MOFSL may have received compensation or other benefits from the subject company(ies) or third party in connection with the research report.
10. MOFSL has not engaged in market making activity for the subject company.
********************************************************************************************************************************
The associates of MOFSL may have:
-
financial interest in the subject company
-
actual/beneficial ownership of 1% or more securities in the subject company at the end of the month immediately preceding the date of publication of the Research Report or date of the
public appearance.
-
received compensation/other benefits from the subject company in the past 12 months
-
any other potential conflict of interests with respect to any recommendation and other related information and opinions.; however the same shall have no bearing whatsoever on the
specific recommendations made by the analyst(s), as the recommendations made by the analyst(s) are completely independent of the views of the associates of MOFSL even though
there might exist an inherent conflict of interest in some of the stocks mentioned in the research report.
-
acted as a manager or co-manager of public offering of securities of the subject company in past 12 months
-
be engaged in any other transaction involving such securities and earn brokerage or other compensation or act as a market maker in the financial instruments of the company(ies)
discussed herein or act as an advisor or lender/borrower to such company(ies)
-
received compensation from the subject company in the past 12 months for investment banking / merchant banking / brokerage services or from other than said services.
-
Served subject company as its clients during twelve months preceding the date of distribution of the research report.
The associates of MOFSL has not received any compensation or other benefits from third party in connection with the research report
Above disclosures include beneficial holdings lying in demat account of MOFSL which are opened for proprietary investments only. While calculating beneficial holdings, It does not consider
demat accounts which are opened in name of MOFSL for other purposes (i.e holding client securities, collaterals, error trades etc.). MOFSL also earns DP income from clients which are not
considered in above disclosures.
Analyst Certification
The views expressed in this research report accurately reflect the personal views of the analyst(s) about the subject securities or issues, and no part of the compensation of the research
analyst(s) was, is, or will be directly or indirectly related to the specific recommendations and views expressed by research analyst(s) in this report.
Terms & Conditions:
This report has been prepared by MOFSL and is meant for sole use by the recipient and not for circulation. The report and information contained herein is strictly confidential and may not be
altered in any way, transmitted to, copied or distributed, in part or in whole, to any other person or to the media or reproduced in any form, without prior written consent of MOFSL. The report is
based on the facts, figures and information that are considered true, correct, reliable and accurate. The intent of this report is not recommendatory in nature. The information is obtained from
publicly available media or other sources believed to be reliable. Such information has not been independently verified and no guaranty, representation of warranty, express or implied, is made
as to its accuracy, completeness or correctness. All such information and opinions are subject to change without notice. The report is prepared solely for informational purpose and does not
constitute an offer document or solicitation of offer to buy or sell or subscribe for securities or other financial instruments for the clients. Though disseminated to all the customers
simultaneously, not all customers may receive this report at the same time. MOFSL will not treat recipients as customers by virtue of their receiving this report.
Disclaimer:
The report and information contained herein is strictly confidential and meant solely for the selected recipient and may not be altered in any way, transmitted to, copied or distributed, in part or
in whole, to any other person or to the media or reproduced in any form, without prior written consent. This report and information herein is solely for informational purpose and may not be
used or considered as an offer document or solicitation of offer to buy or sell or subscribe for securities or other financial instruments. Nothing in this report constitutes investment, legal,
accounting and tax advice or a representation that any investment or strategy is suitable or appropriate to your specific circumstances. The securities discussed and opinions expressed in this
report may not be suitable for all investors, who must make their own investment decisions, based on their own investment objectives, financial positions and needs of specific recipient. This
may not be taken in substitution for the exercise of independent judgment by any recipient. Each recipient of this document should make such investigations as it deems necessary to arrive at
an independent evaluation of an investment in the securities of companies referred to in this document (including the merits and risks involved), and should consult its own advisors to
determine the merits and risks of such an investment. The investment discussed or views expressed may not be suitable for all investors. Certain transactions -including those involving futures,
options, another derivative products as well as non-investment grade securities - involve substantial risk and are not suitable for all investors. No representation or warranty, express or implied,
is made as to the accuracy, completeness or fairness of the information and opinions contained in this document. The Disclosures of Interest Statement incorporated in this document is
provided solely to enhance the transparency and should not be treated as endorsement of the views expressed in the report. This information is subject to change without any prior notice. The
Company reserves the right to make modifications and alternations to this statement as may be required from time to time without any prior approval. MOFSL, its associates, their directors and
the employees may from time to time, effect or have effected an own account transaction in, or deal as principal or agent in or for the securities mentioned in this document. They may perform
or seek to perform investment banking or other services for, or solicit investment banking or other business from, any company referred to in this report. Each of these entities functions as a
separate, distinct and independent of each other. The recipient should take this into account before interpreting the document. This report has been prepared on the basis of information that is
already available in publicly accessible media or developed through analysis of MOFSL. The views expressed are those of the analyst, and the Company may or may not subscribe to all the
views expressed therein. This document is being supplied to you solely for your information and may not be reproduced, redistributed or passed on, directly or indirectly, to any other person or
published, copied, in whole or in part, for any purpose. This report is not directed or intended for distribution to, or use by, any person or entity who is a citizen or resident of or located in any
locality, state, country or other jurisdiction, where such distribution, publication, availability or use would be contrary to law, regulation or which would subject MOFSL to any registration or
licensing requirement within such jurisdiction. The securities described herein may or may not be eligible for sale in all jurisdictions or to certain category of investors. Persons in whose
possession this document may come are required to inform themselves of and to observe such restriction. Neither the Firm, not its directors, employees, agents or representatives shall be
liable for any damages whether direct or indirect, incidental, special or consequential including lost revenue or lost profits that may arise from or in connection with the use of the information.
The person accessing this information specifically agrees to exempt MOFSL or any of its affiliates or employees from, any and all responsibility/liability arising from such misuse and agrees not
to hold MOFSL or any of its affiliates or employees responsible for any such misuse and further agrees to hold MOFSL or any of its affiliates or employees free and harmless from all losses,
costs, damages,
expenses that may be suffered by the person accessing this information due to any errors and delays.
This report is meant for the clients of Motilal Oswal only.
Investment in securities market are subject to market risks. Read all the related documents carefully before investing.
Registration granted by SEBI and certification from NISM in no way guarantee performance of the intermediary or provide any assurance of returns to investors.
Registered Office Address: Motilal Oswal Tower, Rahimtullah Sayani Road, Opposite Parel ST Depot, Prabhadevi, Mumbai-400025; Tel No.: 022 - 71934200 / 71934263;
www.motilaloswal.com. Correspondence Address: Palm Spring Centre, 2nd Floor, Palm Court Complex, New Link Road, Malad (West), Mumbai- 400 064. Tel No: 022 71881000. Details of
Compliance Officer: Neeraj Agarwal, Email Id: na@motilaloswal.com, Contact No.:022-40548085.
Grievance Redressal Cell:
Contact Person
Contact No.
Email ID
Ms. Hemangi Date
022 40548000 / 022 67490600
query@motilaloswal.com
Ms. Kumud Upadhyay
022 40548082
servicehead@motilaloswal.com
Mr. Ajay Menon
022 40548083
am@motilaloswal.com
Registration details of group entities.: Motilal Oswal Financial Services Ltd. (MOFSL): INZ000158836 (BSE/NSE/MCX/NCDEX); CDSL and NSDL: IN-DP-16-2015; Research Analyst:
INH000000412 . AMFI: ARN .: 146822. IRDA Corporate Agent – CA0579. Motilal Oswal Financial Services Ltd. is a distributor of Mutual Funds, PMS, Fixed Deposit, Insurance, Bond, NCDs
and IPO products.
Customer having any query/feedback/ clarification may write to query@motilaloswal.com. In case of grievances for any of the services rendered by Motilal Oswal Financial Services Limited
(MOFSL) write to grievances@motilaloswal.com, for DP to dpgrievances@motilaloswal.com.
8.
March 2025
20