June 2025
India Strategy
BSE Sensex: 82,515
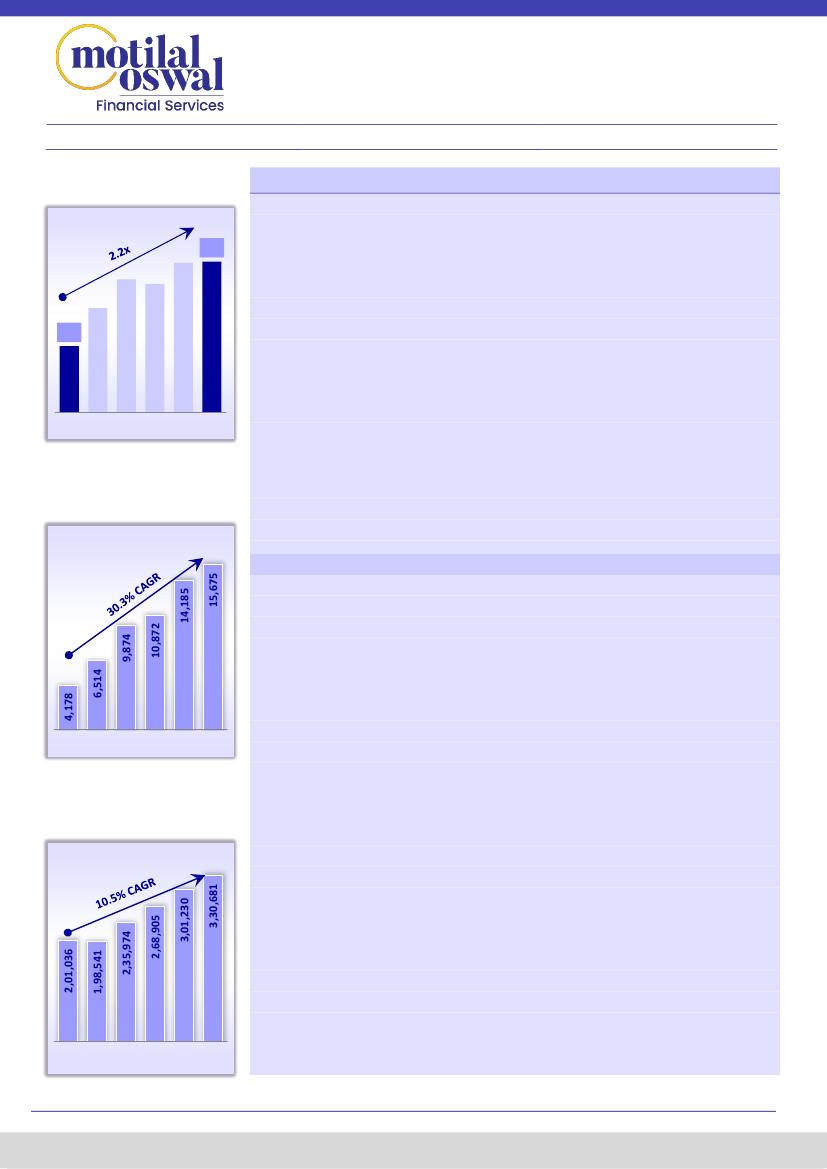
Corporate profit-to-GDP ratio
remains flat YoY, up 2.2x in five years
Nifty-50: 25,141
Corporate profit-to-GDP: Standing tall at a 17-year high!
Defying all odds:
As the world grapples with geopolitical challenges, sluggish growth,
high inflation, and elevated interest rates, India’s macroeconomic indicators present a
contrasting narrative. The country is experiencing strong GDP growth, a stable currency,
and moderating inflation and interest rates, alongside robust corporate earnings. For
the first time in many years, corporate earnings are tracking GDP growth, resulting in
the corporate profit-to-GDP ratio remaining flat YoY at a 17-year high of 4.7% in FY25.
This stable ratio was primarily driven by a healthy 10.5% YoY profit growth in FY25,
building on a strong earnings base of 30% YoY in FY24, which was broadly aligned with
the year’s revenue growth. This performance was bolstered by a robust GDP growth of
9.8% YoY in FY25, following a high base of 12% YoY growth in FY24.
Analyzing India's corporate profit-to-GDP ratio:
We take a closer look at the
corporate profit-to-GDP ratio achieved by India’s listed corporate sector. Our
analysis examines corporate earnings as a percentage of GDP in greater detail, using
the Nifty-500 as a proxy for corporate earnings, as this index represents ~90% of
India’s market capitalization.
4.7
4.2
4.0
4.7
3.3
2.1
2020 2021 2022 2023 2024 2025
Profits have grown at a faster pace
in the last five years
Nifty 500 PAT (INRb)
India’s corporate profit-to-GDP ratio in FY25: Under the lens
2020 2021 2022 2023 2024 2025
GDP has recorded a double-digit
growth in the past five years
GDP (INRb)
2020 2021 2022 2023 2024 2025
In 2025, the corporate profit-to-GDP ratio for the Nifty-500 Universe remained at
4.7%, marking a 17-year high. Notably, for listed India Inc., the ratio stood at
5.1%, at a 14-year high.
The sustained profit-to-GDP ratio for the Nifty-500 was
positively influenced by sectors such as Telecom (which shifted from being a
negative contributor for the past seven years to a positive contributor in FY25),
PSU Banks (with a 0.07% increase in the ratio), Healthcare (a 0.04% rise), Consumer
(a 0.04% increase), Metals (a 0.03% rise), and Infrastructure (a 0.2% increase). In
contrast, sectors that experienced a decline in the ratio included Oil & Gas (a 0.28%
decline), Automobiles (a dip of 0.03%), Cement (a decline of 0.02%), Utilities (a dip
of 0.02%), Private Banks (a decline of 0.01%), and Retail (a dip of 0.01%).
The top-5 sectors contributed 71% to the aforesaid ratio,
with BFSI (1.84% of
the GDP), Oil & Gas (0.51%), Technology (0.40%), Metals (0.34%), and
Automobiles (0.32%) being the key contributors. In contrast, e-commerce was
the only sector that contributed adversely to the corporate profit-to-GDP ratio.
The
corporate profits for the Nifty-500
universe experienced double-digit growth,
rising 10.5% YoY in FY25. This growth was notable given the high base of +30.5%
in FY24 and clocking a 30.3% CAGR over the past five years. This achievement
occurred in a challenging year characterized by weak consumption, a slowdown in
government spending during 1HFY25 amid elections, and volatile exports resulting
from heightened global uncertainties.
Meanwhile,
nominal GDP
growth remained strong in 2HFY25 and exceeded
market expectations. Nominal GDP expanded 9.8% YoY in FY25, although this
was slower than corporate profit growth during the year. It recorded a 10.5%
CAGR over the past five years.
Research Analyst: Gautam Duggad
(Gautam.Duggad@MotilalOswal.com)
| Deven Mistry
(Deven@MotilalOswal.com)
Research Analyst: Abhishek Saraf
(Abhishek.Saraf@motilaloswal.com) |
Aanshul Agarawal
(Aanshul.Agarawal@Motilaloswal.com)
(Aanshul.Agarawal@Motilaloswal.com)
Investors are advised to refer through important disclosures made at the last page of the Research Report.
Motilal Oswal research is available on www.motilaloswal.com/Institutional-Equities, Bloomberg, Thomson Reuters, Factset and S&P Capital.