Thematic | 26 September 2025
Cables and Wires
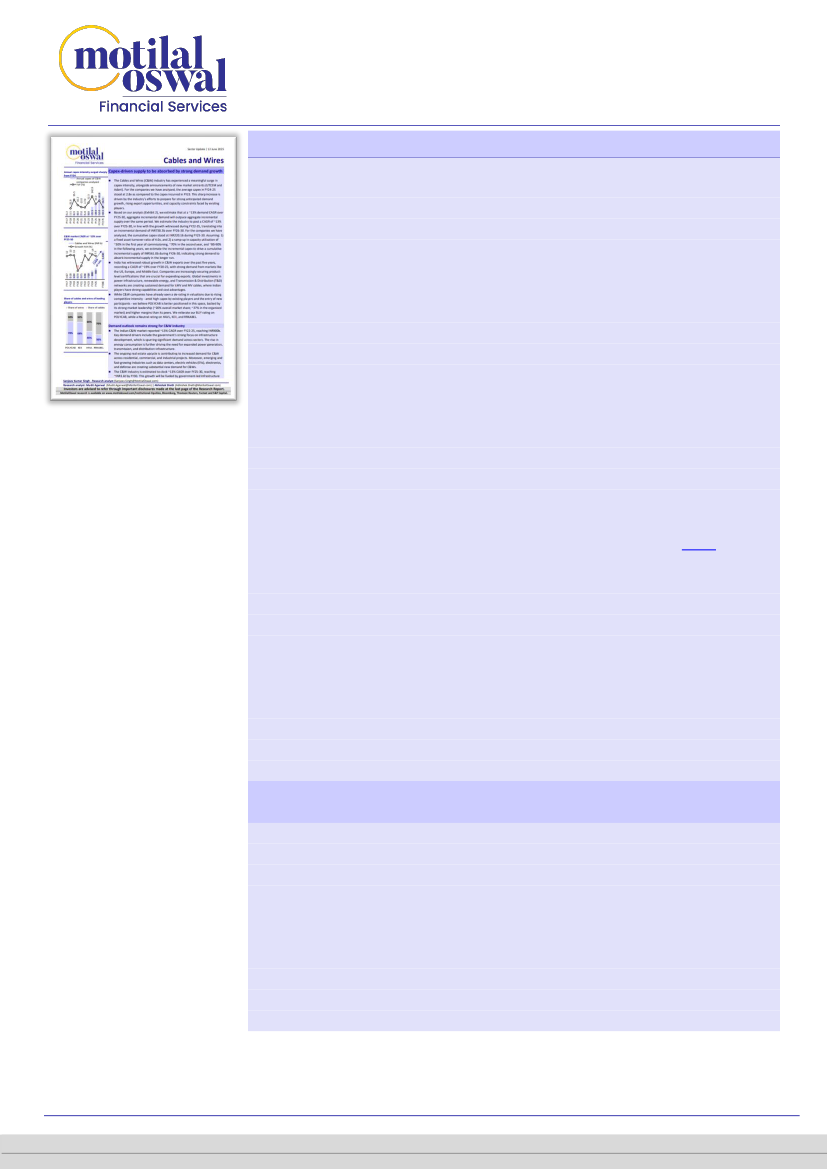
Steady demand outlook; pricing gains boost revenue growth
Our recent conference and subsequent discussions with participants in the
cables & wires (C&W) industry indicate a continued robust demand momentum.
This growth is driven by the power sector, infrastructure investments, emerging
segments such as EVs and data centers, and an improving real estate demand.
While investors have expressed concerns about the sustainability of this
momentum in recent quarters, we believe the inherent demand drivers remain
intact. Key factors supporting this momentum include: 1) infrastructure
development through investments in roads and railways; 2) expansion in the
power sector, particularly renewable energy and T&D capex; and 3) growth in
new avenues, such as data centers and electric vehicles, alongside ongoing
traction in real estate and individual housing.
Competitive intensity in the sector is unlikely to be as high as initially
anticipated, despite entry announcements by new players such as UTCEM and
the Adani Group. UTCEM has since clarified that it does not intend to accelerate
its planned INR18b investment beyond what was announced in Feb’25 for its
foray into the C&W sector. Similarly, no concrete plans have emerged from the
Adani Group following the establishment of Praneetha Ecocables, a JV by its
subsidiary Kutch Copper in Mar’25. As we highlighted in our note
(Link)
published on 12th Jun’25, the incremental supply is expected to be absorbed by
strong demand growth in the sector.
We believe that sustained raw material (RM) price increases, which are largely
passed through to consumers, have supported revenue growth for C&W
companies—a trend reflected in the sectoral performance over the past few
years. Last month, copper/aluminum prices increased ~3%, with average prices
in 2QFY26 (QTD) rising ~6%/9% QoQ and ~10%/14% YoY for copper/aluminum,
respectively. We expect this to translate into price increases of ~3% for wires
and ~4-5% for cables in the near term. The combination of rising RM prices and
healthy volume growth is expected to sustain robust revenue growth in 2QFY26.
Rating upgrade to BUY for KEII, maintain on POLYCAB (BUY) and RRKABEL
(Neutral)
Considering a robust 2QFY26, we upgrade our EPS estimates POLYCAB, KEII, and
RRKABEL by ~3-5% for FY26E and ~2-4% for FY27E/28E. Valuation seems
reasonable at 37x FY27E EPS and 31-32x FY28E for POLYCAB/ KEII. RRKABEL
trades at 30x/25x FY27/28E EPS.
Considering continued growth momentum, lower-than-initially anticipated
competitive intensity, reasonable valuations, and the stock’s underperformance
over the past year (triggered by concerns of increasing competition), we upgrade
KEII to BUY from Neutral. We reiterate our BUY rating on POLYCAB and Neutral
rating on RRKABEL. We continue to believe that the sector’s demand tailwinds
will persist for several more years.
Sanjeev Kumar Singh - Research analyst
(Sanjeev.Singh@MotilalOswal.com)
Research analyst: Mudit Agarwal
(Mudit.Agarwal@MotilalOswal.com)
| Abhishek Sheth
(Abhishek.Sheth@MotilalOswal.com)
Investors are advised to refer through important disclosures made at the last page of the Research Report.
MotilalOswal research is available on www.motilaloswal.com/Institutional-Equities, Bloomberg, Thomson Reuters, Factset and S&P Capital.
 Motilal Oswal Financial Services
Cables and Wires | Thematic
Story in charts
Indian C&W industry estimated to experience sustained demand growth
Indian C&W Market (INR b)
13.9
10.8
8.7
10.3
11.2
14.0
YoY Growth (%)
13.8
14.1
14.2
14.2
Source: MOFSL, Industry, Orient Cables DRHP
Annual capex of C&W
Annual capex of C&W companies analyzed
98.3
113.3
79.8
64.3
YoY (%)
FY25
Market share of key players in value terms (FY25)
21%
POLYCAB
KEII
HAVL
RRKABEL
11%
8%
2%
3%
Source: MOFSL, Industry
5% 6%
7%
Finolex
Apar
Universal cables
Paramount comm.
Others
Source: MOFSL, Industry
39.9
-32.7
-49.2
38.6
30.0
-12.9 -18.7
37%
Leading players’ share in C&W
Share of cables
Share of wires
Organized and unorganized market share
Organized
29%
Unorganized
26%
26%
24%
30%
32%
60%
70%
31%
30%
30%
70%
68%
40%
30%
RRKABEL
69%
70%
71%
70%
74%
74%
76%
POLYCAB
KEII
HAVL
FY19
FY20
FY21
FY22
FY23
FY24
FY25
Source: MOFSL, Industry
26 September 2025
2
 Motilal Oswal Financial Services
Cables and Wires | Thematic
Industry growth drivers
The C&W industry in India is driven by several key growth drivers: 1) rising
infrastructure investments, including roads and railways; 2) a strong focus on the
power sector, especially renewable energy and transmission & distribution
network; 3) new growth engines like data centers, defense, and EVs; and 4) the
real estate growth cycle.
According to industry estimates, the sector is expected to grow at 1.5-2x of real
GDP in the near to mid-term. The Indian C&W market posted a ~9% CAGR over
FY14-25, reaching INR900b (from INR350b in FY14). This growth was primarily
driven by government-led infrastructure development and increased
investments in the power and real estate sectors. Key demand drivers included
the power sector, particularly the expansion of renewable energy, and a
booming real estate market supported by record home sales. Additionally,
steady private capital expenditure in sectors like cement, automobiles, and
electronics, along with emerging areas like data centers and electric vehicles
(EVs), has further contributed to the positive momentum
Organized players have steadily gained market share in recent years, and their
dominance is likely to expand further. The shift towards organized players is
driven by a focus on safety, GST implementation, increasing complexity of C&W
applications, and demand for higher voltage products.
Exports from India have also risen in recent years, supported by global
investments in renewables, data centers, infrastructure modernization, and the
China+1 strategy. Demand for high-quality, compliant, and sustainable cables is
growing across North America, Europe, the Middle East, and Asia Pacific.
Developed economies are upgrading legacy grids, while emerging markets are
building new infrastructure. The global clean energy transition is further
boosting demand in the solar, wind, oil & gas, and green hydrogen sectors.
Organized and unorganized market share
Organized
Unorganized
26%
26%
24%
India’s C&W market to grow 1.5x-2.0x of GDP
Indian C&W market (INR b)
31%
30%
29%
30%
69%
350.0
FY14
964.0
FY25
1,859.0
FY30E
Source: MOFSL, Industry
FY19
70%
71%
70%
74%
74%
76%
FY20
FY21
FY22
FY23
FY24
FY25
Source: MOFSL, Industry
Power sector investments
Increasing power demand: India’s per capita power consumption is set to rise
from 1,395 units in FY23-24 to 2,984 units by FY39-40E, moving closer to the
current global average of over 3,700 units.
26 September 2025
3
 Motilal Oswal Financial Services
Cables and Wires | Thematic
Accelerated renewable energy expansion: India’s renewable energy capacity is
estimated to grow from 216 GW to ~500 GW by FY29-30, in line with its ambition of
sourcing 50% of cumulative power capacity from non-fossil fuel sources by 2030.
Strengthening power infrastructure: With rising demand for efficient power
transmission, India is expected to focus on inter-regional grid projects to facilitate
power transfer from surplus to deficit states, especially from RE power plants
concentrated in the West and South of India. The transition from overhead power
lines to underground cabling will continue, ensuring easier network expansion and
improved weather resilience. Additionally, the renovation and modernization of grid
and sub-transmission networks will support the shift towards higher capacity and
improved efficiency.
Expected addition in transmission line
Transmission line ('000 km)
Installed power capacity in India
Wind
Fossil Fuel + Nuclear
Solar
Other Renewable Energy
80
277
64
256
103
49
FY25
280
140
FY30E
Source: MOFSL, Industry
8.8
FY25
41.0
FY30E
Source: MOFSL, Industry
Public capex and high-growth sectors:
Investments in roads, railways, and metros: The national highway network is set
to grow from 146k km to 200k km by 2037. Since FY18, over 10,000 km of
highways have been added annually, enhancing connectivity and logistics
efficiency. Capital investment for railways is estimated at INR2.65t in FY26 (~95%
funded by the Central government).
According to industry estimates, India is expected to invest over INR7t over the
next decade to add 50,000km of new tracks and upgrade existing railway
infrastructure. ~1,000km of metro rail lines are currently under construction,
with an additional 1,000km planned, aimed at enhancing urban mobility across
key cities.
Investment in airports: Under the Gati Shakti initiative, 200 new airports,
heliports, and water aerodromes are planned. The AAI is expected to develop 50
new airports in tier II and tier III cities over the next five years to improve
regional connectivity.
Investments in data centers: India’s data center capacity is set to grow from ~1.3
MW to over 4.7-5.7GW by FY30, with Mumbai, Chennai, Noida, Hyderabad, and
Bengaluru emerging as key hubs for expansion.
Rising EV adoption: The Government of India aims for 30% electrification of
private cars and 70-80% of EV adoption in commercial vehicles, two-wheelers,
and three-wheelers by 2030. Over 2m EV charging stations are expected to be in
place by then, supporting this rapid transition.
26 September 2025
4
 Motilal Oswal Financial Services
Cables and Wires | Thematic
Expected EV sales in India
EV Sales (in m)
Indian data center market by power capacity
Data Center Capacity (GW)
0.1
FY25
11.4
FY29E
Source: MOFSL, Industry, Orient Cables DRHP
0.3
FY19
1.3
FY25
5.7
FY30E
Source: MOFSL, Industry, Orient Cables DRHP
Other key growth drivers
China+1 strategy:
As global companies diversify their manufacturing bases
beyond China, India has emerged as a favored alternative destination. This
diversification is unlocking significant export potential for Indian cable
manufacturers in key markets, including North America, Europe, and Southeast
Asia, where demand for compliant, high specification cables continues to rise.
Electrification push: With global electricity consumption projected to double by
2050, governments are intensifying investments in the energy transmission
infrastructure. The European Union plans to allocate USD633b toward electricity
grid modernization by 2030, while the US’s Grid Resilience Investment Program
(GRIP) has earmarked USD10.5b for grid upgrades. Together, these initiatives are
driving substantial demand for high-voltage and specialty cables.
Clean energy investments: The accelerating shift towards renewable energy
sources is fueling extensive cabling requirements across the solar, wind, and
hydrogen sectors. The EU’s commitment of USD1.6t to clean energy and grid
projects underscores the scale of opportunity, with offshore wind capacity
anticipated to surge from 12 GW in 2024 to 300 GW by 2050.
Digital infrastructure and data centers: The rapid adoption of artificial
intelligence and cloud computing is catalyzing exponential growth in data
centers globally. Investments in this space are projected to reach USD49b by
2030, driving continuous demand for fiber optic cables, structured cabling
systems, and high-speed data transmission solutions.
EV and charging infrastructure expansion: The electric and hybrid vehicle market
is expected to comprise 55% of global vehicle sales by 2030. Correspondingly,
public EV charging stations are estimated to expand from 4m in 2023 to
approximately 15m by 2030, intensifying the need for robust, safe, and efficient
EV cabling infrastructure.
Smart cities and urbanization: Urban populations are set to reach 68% of the
global total by 2050, accelerating demand for smart city infrastructure.
Initiatives such as Saudi Arabia’s USD1t Vision 2030 and the projected USD1.1t
global smart cities market by 2028 are driving substantial demand for low-
voltage, fire-retardant, and control cables, which are essential for modern
buildings and infrastructure.
26 September 2025
5
 Motilal Oswal Financial Services
Cables and Wires | Thematic
Export market
C&W exports jumped ~44% YoY to INR21.1b in Jun’25, followed by ~43% YoY
growth in Jul’25. Overall exports grew ~35% YoY during Apr-Jul’25, compared to
~5% YoY during Apr-Jul’24. Leading companies are expected to realize the most
benefit from this strong rebound.
Within key markets, the US witnessed the highest growth (~97%), followed by
the UAE (~45%). The UK and Australian markets grew ~35% and ~3%,
respectively, while exports to Saudi Arabia declined ~49%. India’s C&W exports
to the US recorded ~42% CAGR over FY17-25, reaching INR44.1b, with the US
accounting for ~27% of total exports in Apr-Jul’25 vs ~19% in Apr-Jul’24.
India has been a net exporter of C&W since FY20. Domestic companies are
enhancing production capacities and expanding into new markets, supported by
government strategies such as PLI schemes, component manufacturing
ecosystems, import substitution, and the China+1 plan.
The C&W export market posted ~19% CAGR over FY17-25. India’s C&W exports
are expanding steadily, offering a diverse range of products to global markets.
Strong production capabilities, compliance with international standards, cost
advantages, and competitive pricing have positioned India as a preferred
supplier worldwide.
Key global demand drivers include the expansion of renewable energy, growth
of data centers, the shift to electric vehicles, modernization of power grids,
rising energy consumption in emerging economies, and increased
telecommunication, digitization, urbanization, and infrastructure development.
Export and import of C&W (in INR b)
Export (INR b)
Import (INR b)
47.5
16.8
-6.2
-14.4
-18.3
26.9
6.4
55.4
Export surplus (%)
57.0
49.5
51.3
Source: MOFSL, Industry
C&W exports and growth
Export (INR b)
YoY (%)
43.9 42.7
36.5
28.6
21.0
13.5 13.6
31.0
C&W imports and growth
Import (INR b)
YoY (%)
37.1 36.8
17.0
12.7
24.7 22.9
49.0
31.3
36.1 33.4
24.5 9.9
0.5
10.9 11.1
42.9
15.3
23.7
25.6 9.8
0.5
22.8
3.4
3.8
16.1 17.5 14.2 18.6 17.5 17.6 21.8 16.5 18.7 21.1 21.8
10.7 11.0 10.7 11.5
12.3 12.7 12.6 13.2 13.1
Source: MOFSL, Industry
Source: MOFSL, Industry,
26 September 2025
6
 Motilal Oswal Financial Services
Cables and Wires | Thematic
RM tailwinds support revenue growth
We believe that sustained RM price increases, which are largely passed through
to consumers, have supported revenue growth for C&W companies—a trend
reflected in sectoral performance over the past few years.
Over the last month, copper/aluminum prices rose ~3%, with average prices in
2QFY26 (QTD) rising ~6%/9% QoQ and ~10%/14% YoY for copper/aluminum,
respectively. We expect this to translate into price increases of ~3% for wires
and ~4-5% for cables in the near term. The combination of higher RM prices and
healthy volume growth is expected to continue driving robust revenue growth in
2QFY26.
Aluminum price trend MoM
Movement in Aluminum prices (MoM)
Copper price trend MoM
Movement in Copper prices (MoM)
Source: Bloomberg, MOFSL, Note: Sep’25 data to date
Source: Bloomberg, MOFSL; Note: Sep’25 data to date
Valuation and view
Considering a robust 2QFY26, we upgrade our EPS estimates POLYCAB, KEII, and
RRKABEL by ~3-5% for FY26E and ~2-4% for FY27E/28E. Valuation seems
reasonable at 37x FY27E EPS and 31-32x FY28E for POLYCAB/ KEII. RRKABEL
trades at 30x/25x FY27/28E EPS.
Considering continued growth momentum, lower-than-initially anticipated
competitive intensity, reasonable valuations, and the stock’s underperformance
over the past year (triggered by concerns of increasing competition),
we
upgrade KEII to BUY from Neutral. We reiterate our BUY rating on POLYCAB
and Neutral on RRKABEL.
We continue to believe that the sector’s demand
tailwinds will persist for several more years.
26 September 2025
7
 Motilal Oswal Financial Services
Cables and Wires | Thematic
Stock and index performance over the past year (%)
Stock and Index perfromance in last one-year (%)
3.8
-3.6
-28.6
POLYCAB
KEII
RRKABEL
Nifty 50
BSE Sensex
Source: MOFSL, Industry
-6.0
-6.3
Valuation summary
Company
HAVL
POLYCAB
VOLT
KEII
RRKABEL
M-cap
(INR b)
985
1102
469
388
138
CMP
(INR)
1,507
7,313
1,340
4,050
1,216
TP
(INR)
1,680
8,750
1,350
4,700
1,340
EPS (INR)
EPS CAGR
P/E (x)
RoE (%)
FY26E FY27E FY28E (FY25-28E) FY26E FY27E FY28E FY26E FY27E FY28E
Neutral 26
32
39
28%
59
47
39
17.1 18.8 19.7
BUY
171 199 238
33%
43
37
31
21.7 21.2 21.1
Neutral 23
32
38
23%
57
42
35
10.9 13.3 14.2
BUY
92
108 128
33%
44
37
32
14.2 14.6 15.0
Neutral 37
41
48
32%
33
30
25
18.0 17.2 17.6
Rating
RoIC (%)
FY26E FY27E FY28E
22.6 26.0 28.7
28.3 27.9 28.8
17.8 20.0 21.2
18.5 18.9 19.1
14.6 15.0 15.7
Source: MOFSL, Company
26 September 2025
8
 Motilal Oswal Financial Services
Cables and Wires | Thematic
26 September 2025
Update | Sector: Cables and Wires
Polycab India
BSE SENSEX
80,426
S&P CNX
24,655
CMP: INR7,313
TP: INR8,750 (+20%)
Buy
Leading the charge in C&W; FMEG turnaround positive
Market leadership in the C&W segment
Stock Info
Bloomberg
Equity Shares (m)
M.Cap.(INRb)/(USDb)
52-Week Range (INR)
1, 6, 12 Rel. Per (%)
12M Avg Val (INR M)
Free float (%)
POLYCAB IN
151
1102.3 / 12.4
7714 / 4555
4/37/14
2911
37.0
Financials Snapshot (INR b)
Y/E March
FY26E FY27E FY28E
Sales
267.6 314.8 370.3
EBITDA
38.0 44.5 53.2
Adj. PAT
25.8 30.0 35.8
EBITDA Margin (%)
14.2 14.1 14.4
Adj. EPS (INR)
171
199
238
EPS Gr. (%)
27.5 16.5 19.4
BV/Sh. (INR)
789
939 1,127
Ratios
Net D:E
(0.1) (0.1) (0.2)
RoE (%)
21.7 21.2 21.1
RoCE (%)
22.7 22.2 22.1
Payout (%)
20.4 25.1 21.0
Valuations
P/E (x)
42.8 36.7 30.8
P/BV (x)
9.3
7.8
6.5
EV/EBITDA(x)
28.7 24.4 20.2
Div. Yield (%)
0.5
0.7
0.7
FCF Yield (%)
0.9
1.2
1.7
Shareholding pattern (%)
As On
Jun-25 Mar-25
Promoter
63.0
63.0
DII
11.6
11.0
FII
11.4
11.1
Others
13.9
14.9
FII Includes depository receipts
Stock Performance (1-year)
Polycab India’s (POLYCAB) market share in the domestic organized C&W segment
stood at ~26-27%, up from ~18-19% in FY20. The company gained significant
market share, backed by a diverse range of offerings (+9,600 SKUs), strong
product quality, supply chain agility, deep market penetration (over 4,300
authorized dealers and distributors and presence in over 200k retail outlets
across the country). Moreover, the company has consistently maintained a
healthy segment margin of ~13-15%, aligning with its guidance of ~11-13%.
Under its Project Spring, the company aims to grow its C&W business at 1.5x the
industry growth rate, continue gaining market share, and maintain healthy
margins of 11-13%.
FMEG delivers turnaround; aims for sustained outperformance
After a muted performance in recent years, the FMEG segment delivered a sharp
turnaround with ~29% revenue growth in FY25 and achieved break-even in
4QFY25. This turnaround was driven by its strategic initiatives towards
distribution expansion, portfolio enhancement, and brand building over the past
four years. The company’s strong performance highlights the growing
momentum of its consumer franchise and its ability to adapt swiftly to evolving
market dynamics. Under Project Spring, it targets to grow its FMEG revenue at
1.5x-2.0x the industry growth rate, while targeting an EBITDA margin of ~8-10%.
Future-ready with 2x capex commitment
POLYCAB has committed a capex of INR60-80b over the next five years (vs.
INR30b over FY21-25) to support its long-term growth objectives and build a
stronger, future-ready business. These investments are estimated to generate an
asset turnover of 4x-5x and will be funded through internal accruals. The focus
areas include capacity expansion across all major product lines within the C&W
segment, selective expansion in FMEG, and strategic backward integration to
enhance operational efficiencies.
Jun-24
65.0
6.9
13.6
14.4
Valuation and view: Structurally positive, built for the long term
We estimate a CAGR of 18%/22%/21% in Revenue/EBITDA/EPS over FY25-28.
POLYCAB has benefited from continuous capacity expansions and sustained a
healthy margin (~13-15%) in the C&W segment. We project a stable margin of
~14% over FY26-28, given the company’s operational strength, an increase in
contribution from the EHV capacity (expected from FY27), and export growth.
Cumulative FCF is expected to stand at INR42.4b over FY26-28, despite increased
capex intensity. Net cash is likely to increase to INR47.3b by FY28 vs. INR31.0b as
of Jun’25. We remain structurally positive on POLYCAB, given its leadership
position in the C&W segment, positive sector outlook, robust balance sheet, and
strong return ratios. We reiterate our BUY rating on POLYCAB with a TP of
INR8,750 (based on 40x Sep’27E EPS).
9
26 September 2025
 Motilal Oswal Financial Services
Cables and Wires | Thematic
Story in charts
Estimate revenue CAGR of ~18% over FY25-28
Total revenue (INR b)
39.6
25.9
16.8
10.4
(1.5)
165
182
179
250
294
370
461
550
647
760
17.4
24.6
19.5 17.6 17.6
11.5
YoY (%)
C&W to clock ~19% CAGR over FY25-28
Cables and wires (INR b)
42.2
18.4
27.4
18.2
YoY (%)
22.0 18.0 18.0
7.4
0.0
71
76
76
108
128
163
192
235
277
327
Source: MOFSL, Company
Revenue CAGR across segments
FY22-25
FY25-28E
73.1
Estimate EBITDA CAGR of ~22% over FY25-28
EBITDA (INR b)
12.9
11.9
13.3
10.6
13.1
13.8
EBITDA (%)
14.2 14.1 14.4
13.2
21.2 19.3
10.4
Cables
15.7
22.6
7.9
EPC
18.2
9.5
11.4 11.8 13.0 18.5 24.9 29.6 38.0 44.5 53.2
FMEG
Total revenue
Source: MOFSL, Company
FMEG revenue CAGR at ~16% over FY25-28
FMEG (INR b)
32.2 30.2
23.7 21.0
0.8
3.0
YoY (%)
29.5
17.0 15.0 15.0
1.2
FMEG to turn positive by FY27E
EBIT margin (%)
5.5
2.0
1.6
(0.4)
(0.5)
2.0
3.5
(2.3)
(7.3)
6.4
8.4
10.3 12.5 12.6 13.0 16.8 19.7 22.6 26.0
Source: MOFSL, Company
26 September 2025
10
 Motilal Oswal Financial Services
Cables and Wires | Thematic
OCF and FCF expected to improve
OCF (INR b)
FCF (INR b)
31.8
14.3 13.0
5.1
(0.2)
9.5
4.4
18.1
22.2
26.4
Capex raised for FY26-28 vs. historical
Capex (INR b)
12.0
8.6
5.3
4.8
9.7
13.0 13.0
12.3
9.6 2.4
12.5
10.5
8.4
10.2 13.4 18.8
2.8
2.9
1.9
(0.2)
Source: MOFSL, Company
Estimate stable working capital days
Working capital
117
98
83
61
106
92
79
73
94
63
Working capital without acceptances
103
84
65
63
62
62
62
18
101
101 101
18
Sustaining higher return ratios
RoE (%)
23
20
20
17
17
20
22
RoCE (%)
22
23
22
22
16
16
21
22
21
21
19
Source: MOFSL, Company
One-year forward P/E chart
56.0
44.0
32.0
20.0
10.8
8.0
P/E (x)
Min (x)
Avg (x)
+1SD
48.1
38.7
Max (x)
-1SD
40.8
11.0
8.5
6.0
17.6
3.5
1.0
One-year forward P/B chart
P/B (x)
Min (x)
Avg (x)
+1SD
10.0
8.0
5.6
Max (x)
-1SD
8.6
28.2
3.1
2.0
Source: MOFSL, Company
26 September 2025
11
 Motilal Oswal Financial Services
Cables and Wires | Thematic
Financials and valuations (Consolidated)
Income Statement
Y/E March
Net Sales
Change (%)
Raw Materials
Staff Cost
Other Expenses
EBITDA
% of Net Sales
Depreciation
Interest
Other Income
Profit of share of
associates
/JVs
PBT
Tax
Rate (%)
MI
Extra-ordinary Inc.(net)
Reported PAT
Change (%)
Adjusted PAT
Change (%)
Balance Sheet (Consolidated)
Y/E March
Share Capital
Reserves
Net Worth
Loans
Deffered Tax Liability
Minority Interest
Capital Employed
Gross Fixed Assets
Less: Depreciation
Net Fixed Assets
Capital WIP
Investments
Curr. Assets
Inventory
Debtors
Cash & Bank Balance
Loans & Advances
Other Current Assets
Current Liab. & Prov.
Creditors
Other Liabilities
Provisions
Net Current Assets
Application of Funds
2021
88,585
0.3
65,171
3,537
8,102
11,774
13.3
1,762
427
1,193
6
10,784
2,703
25.1
38
(1,000)
7,042
(7.2)
8,042
5.9
2022
1,22,398
38.2
94,657
4,066
10,663
13,012
10.6
2,015
352
899
(26)
11,519
2,706
23.5
87
-
8,725
23.9
8,725
8.5
2023
1,41,078
15.3
1,05,109
4,568
12,880
18,521
13.1
2,092
598
1,333
(93)
17,073
4,242
24.8
123
-
12,708
45.6
12,708
45.6
2024
1,80,394
27.9
1,32,803
6,095
16,578
24,918
13.8
2,450
1,083
2,209
-
23,593
5,564
23.6
189
-
17,841
40.4
17,841
40.4
2025
2,24,083
24.2
1,68,300
7,367
18,813
29,602
13.2
2,981
1,689
2,076
-
27,008
6,553
24.3
255
-
20,200
13.2
20,200
13.2
2026E
2,67,623
19.4
1,96,970
8,841
23,818
37,993
14.2
3,694
2,170
2,492
-
34,621
8,586
24.8
276
-
25,759
27.5
25,759
27.5
2027E
3,14,807
17.6
2,31,698
10,609
28,018
44,482
14.1
4,563
2,364
2,741
-
40,296
9,994
24.8
298
-
30,005
16.5
30,005
16.5
(INR M)
2028E
3,70,335
17.6
2,71,456
12,731
32,960
53,189
14.4
5,466
2,761
3,097
-
48,059
11,919
24.8
322
-
35,819
19.4
35,819
19.4
(INR M)
2028E
1,504
1,68,021
1,69,526
790
785
1,713
1,72,814
85,153
31,554
53,598
7,872
17,490
1,54,694
60,509
47,856
30,583
183
15,562
60,841
45,658
13,460
1,722
93,853
1,72,814
2021
1,491
46,048
47,539
2,487
418
188
50,633
26,989
8,293
18,696
991
6,349
44,111
19,879
15,641
5,313
123
3,155
19,514
13,480
5,547
487
24,597
50,633
2022
1,494
53,943
55,437
831
272
251
56,791
27,059
10,308
16,751
3,755
7,733
45,880
21,996
13,763
4,071
127
5,922
17,328
12,175
4,634
518
28,552
56,791
2023
1,498
64,874
66,372
730
409
374
67,885
33,069
12,400
20,669
2,508
13,505
57,559
29,514
12,992
6,952
103
7,997
26,356
20,326
5,312
717
31,203
67,885
2024
1,502
80,369
81,871
898
415
562
83,746
37,462
14,850
22,612
6,547
18,224
73,276
36,751
21,662
4,024
106
10,733
36,914
28,633
7,365
916
36,362
83,746
2025
1,504
96,746
98,250
1,090
785
818
1,00,943
47,153
17,831
29,321
7,872
17,490
82,804
36,613
28,957
7,706
111
9,416
36,544
27,358
8,145
1,042
46,259
1,00,943
2026E
1,504
1,17,240
1,18,745
990
785
1,094
1,21,613
59,153
21,525
37,627
7,872
17,490
1,02,590
43,727
34,583
12,901
133
11,246
43,966
32,995
9,727
1,245
58,624
1,21,613
2027E
1,504
1,39,724
1,41,228
890
785
1,392
1,44,294
72,153
26,088
46,064
7,872
17,490
1,24,586
51,436
40,681
19,084
156
13,228
51,718
38,812
11,442
1,464
72,868
1,44,294
26 September 2025
12
 Motilal Oswal Financial Services
Cables and Wires | Thematic
Financials and valuations (Consolidated)
Ratios
Y/E March
Basic (INR)
Adjusted EPS
Growth (%)
Cash EPS
Book Value
DPS
Payout (incl. Div. Tax.)
Valuation (x)
P/Sales
P/E
Cash P/E
EV/EBITDA
EV/Sales
Price/Book Value
Dividend Yield (%)
Profitability Ratios (%)
RoE
RoCE
RoIC
Turnover Ratios
Debtors (Days)
Inventory (Days)
Creditors. (Days)
Asset Turnover (x)
Leverage Ratio
Debt/Equity (x)
Cash Flow Statement
Y/E March
PBT before EO Items
Add : Depreciation
Interest
Less : Direct Taxes Paid
(Inc)/Dec in WC
Others
CF from Operations
(Inc)/Dec in FA
Free Cash Flow
(Pur)/Sale of Investments
Others
CF from Investments
(Inc)/Dec in Net Worth
(Inc)/Dec in Debt
Less : Interest Paid
Dividend Paid
Others
CF from Fin. Activity
Inc/Dec of Cash
Add: Beginning Balance
Closing Balance
2021
53.9
5.8
65.7
318.8
10.0
18.5
12.3
135.8
111.4
92.5
12.3
23.0
0.1
16.9
16.6
19.3
64
82
56
1.7
(0.1)
2022
58.4
8.3
71.9
371.0
14.0
24.0
8.9
125.4
101.9
83.9
8.9
19.7
0.2
15.7
16.0
18.7
41
66
36
2.2
(0.1)
2023
84.9
45.3
98.8
443.2
20.0
23.6
7.8
86.3
74.1
58.9
7.7
16.5
0.3
19.1
19.7
26.0
34
76
53
2.1
(0.1)
2024
118.8
40.0
135.1
545.0
30.0
16.8
6.1
61.7
54.2
44.0
6.1
13.4
0.4
21.8
22.5
27.9
44
74
58
2.2
(0.0)
2025
134.3
13.1
154.1
653.1
35.0
22.3
4.9
54.5
47.5
37.0
4.9
11.2
0.5
20.6
21.5
26.6
47
60
45
2.2
(0.1)
2026E
171.2
27.5
195.8
789.4
40.0
20.4
4.1
42.8
37.4
28.7
4.1
9.3
0.5
21.7
22.7
28.3
47
60
45
2.2
(0.1)
2027E
199.5
16.5
229.8
938.9
50.0
25.1
3.5
36.7
31.9
24.4
3.4
7.8
0.7
21.2
22.2
27.9
47
60
45
2.2
(0.1)
2028E
238.1
19.4
274.5
1,127.0
50.0
21.0
3.0
30.8
26.7
20.2
2.9
6.5
0.7
21.1
22.1
28.8
47
60
45
2.1
(0.2)
(INR M)
2028E
48,059
5,466
2,761
11,919
9,487
(3,097)
31,784
(13,000)
18,784
3,097
(9,903)
-
(100)
2,761
7,521
-
(10,382)
11,499
19,084
30,583
2021
10,122
1,866
531
2,409
(2,600)
(325)
12,385
(1,935)
10,450
(5,664)
(7,599)
-
(1,217)
463
-
(68)
(1,748)
3,038
4,658
7,696
2022
11,519
2,088
352
3,340
4,974
(529)
5,116
(5,267)
(151)
997
(4,270)
-
(168)
309
1,492
(38)
(2,007)
(1,160)
5,231
4,071
2023
17,073
2,092
598
3,704
1,058
(725)
14,275
(4,795)
9,481
(7,232)
(12,026)
-
332
476
2,094
(32)
(2,271)
(22)
6,974
6,952
2024
23,593
2,450
1,083
5,743
8,090
(331)
12,962
(8,585)
4,377
1,066
(7,519)
-
194
1,017
2,997
(54)
(3,874)
1,570
2,454
4,024
2025
27,008
2,981
1,689
6,331
6,099
(1,162)
18,085
(9,706)
8,379
(2,687)
(12,393)
-
498
1,685
4,511
(585)
(6,283)
(591)
8,297
7,706
2026E
34,621
3,694
2,170
8,586
7,169
(2,492)
22,238
(12,000)
10,238
2,492
(9,508)
-
(100)
2,170
5,265
-
(7,534)
5,195
7,706
12,901
2027E
40,296
4,563
2,364
9,994
8,061
(2,741)
26,428
(13,000)
13,428
2,741
(10,259)
-
(100)
2,364
7,521
-
(9,985)
6,183
12,901
19,084
26 September 2025
13
 Motilal Oswal Financial Services
Cables and Wires | Thematic
26 September 2025
Company Update | Sector: Cables and Wires
KEI Industries
BSE SENSEX
80,426
S&P CNX
24,655
CMP: INR4,060 TP: INR4,700 (+16%) Upgrade to Buy
Strong growth positioning; capex well-funded
Capacity boost sets stage for sustained growth
KEI Industries (KEII) has embarked on a robust expansion trajectory to
consolidate its position in both domestic and export markets. The company is
setting up a greenfield facility at Sanand, Gujarat, with a total investment of
~INR17b. Phase-I is likely to be commissioned in Sep’25, with full expansion
scheduled for completion by 1QFY27. Once operational, the Sanand plant is
expected to add a capacity of INR55-60b, driving incremental revenue of
~INR6.0b in FY26 and INR20-25b in FY27, with growth of ~20% thereafter.
Following the completion of the Sanand Project, the company is committed to
an annual capex of INR7.0-8.0b for the next phase of expansion in low and
medium-voltage cables, which will be funded through internal accruals. The
company has acquired 18 acres of land at Salarpur, Rajasthan, for these
expansions and is in the process of acquiring a sizeable land at Kheda, Nadiad,
Gujarat. With these investments, the company targets ~19-20% revenue CAGR
over the next five years.
Bloomberg
Equity Shares (m)
M.Cap.(INRb)/(USDb)
52-Week Range (INR)
1, 6, 12 Rel. Per (%)
12M Avg Val (INR M)
Free Float (%)
KEII IN
96
387.9 / 4.4
4725 / 2424
5/39/3
1729
65.0
Financials & Valuations (INR b)
Y/E MARCH
FY26E FY27E FY28E
Sales
116.3 136.2 159.7
EBITDA
12.1 14.8 17.7
Adj. PAT
8.8 10.4 12.3
EBITDA Margin (%)
10.4 10.9 11.1
Cons. Adj. EPS (INR) 91.9 108.5 128.4
EPS Gr. (%)
26.2 18.0 18.4
BV/Sh. (INR)
691
794
916
Ratios
Net D:E
(0.3) (0.3) (0.2)
RoE (%)
14.2 14.6 15.0
RoCE (%)
14.5 15.1 15.6
Payout (%)
6.5
5.5
4.7
Valuations
P/E (x)
44.2 37.4 31.6
P/BV (x)
5.9
5.1
4.4
EV/EBITDA (x)
30.5 24.9 20.7
Div Yield (%)
0.1
0.1
0.1
FCF Yield (%)
0.2
0.2
0.5
Retail mix increases; expansion helps to scale exports
KEII has strengthened its retail division through promotional campaigns,
outdoor marketing, and sponsorships, boosting brand visibility. The share of
B2C sales in overall revenue grew from ~29% in FY20 to ~52% in FY25,
improving cash flow and reducing receivable periods. With a PAN-India retail
presence, its network includes 26 depots, 38 marketing offices across the
country and four overseas offices in the UAE, South Africa, Nepal, and Gambia,
and over 2,090 active dealers/distributors as of Jun’25. Its advertising and
promotion spending increased 18% YoY to INR478m in FY25, and the company
spent 0.5% of its revenues on ads in FY25. We estimate ad spending to be at
0.5% of revenues over FY25-28 (19% CAGR over FY25-28E). Additionally,
exports are a key focus area for driving diversification and growth. The
company is strengthening its capabilities to cater to high-value international
markets through direct sales, enhanced capacities, and globally recognized
product certifications. Its Sanand facility will play a critical role in meeting
long-length export demand, particularly for EHV cables. In FY25, exports grew
15% YoY to INR12.7b, driven by a sharp 40% rise in cable exports. The
company’s export order book stood at INR7.0b as of Jun’25. Exports accounted
for 13% of sales in FY25, and the company targets to increase this share to
~15-18% over the next three years.
Shareholding Pattern (%)
As On
Jun-25 Mar-25
Promoter
35.0
35.0
DII
25.6
23.5
FII
26.6
25.8
Others
12.8
15.6
FII includes depository receipts.
Stock Performance (1-year)
Jun-24
37.1
16.6
30.8
15.6
Strong growth ahead; capex well-funded through healthy cash flows
We estimate revenue CAGR at ~18% over FY25-28, led by ~19% growth in the
C&W segment and ~5% growth in the SSW segment. However, EPC revenue is
likely to decline ~12% p.a. during the same period, as the company is selective
and has recalibrated its EPC business. EBITDA is estimated to clock ~21%
CAGR, with margins expanding ~90-100bp to ~11% by FY28. PAT is estimated
26 September 2025
14
 Motilal Oswal Financial Services
Cables and Wires | Thematic
to post a 21% CAGR over FY25-28. We estimate a cumulative OCF of INR22.1b over
FY26-28 vs. INR10.9b over FY23-25, backed by robust revenue growth and efficient
working capital management, which also support its annual capex requirement of
INR6-7b. Cumulative FCF is estimated at INR3.4b over FY26-28E vs a net cash
outflow of INR1.0b over FY23-25. We estimate the company’s net cash to improve to
INR20.9b by FY28 vs. INR15.0b as of Jun’25.
Valuation and view
KEII delivered strong performance in 1HCY25, with over 25% growth and stable
margins supported by a robust demand environment, a diversified customer base,
and a significant presence across domestic and international markets. Its growing
focus on the retail segment and capacity expansion would continue to drive growth
for the company. We value KEII at 40x Sep’27E EPS to arrive at a revised TP of
INR4,700 and upgrade the rating to BUY.
Story in charts
Estimate revenue CAGR of ~18% over FY25-28
Revenue (INR b)
37
16
(14)
21
17
20
YoY (%)
19
11.0
Estimate EBITDA CAGR of ~21% over FY25-28
EBITDA (INR b)
Margin (%)
10.4
10.9
11.1
17
17
10.2
10.3
10.2
10.3
10.2
49
42
57
69
81
97
116
136
160
5.0
4.6
5.9
7.0
8.4
9.9
12.1
14.8
17.7
Source: MOFSL, Company
C&W revenue CAGR of ~19% over FY25-28E
Cables and wires (INR b)
43
19
(10)
39.9
51.2
62.5
73.2
91.8 111.4 131.5 155.2
4.4
22
17
25
21
18
18
YoY (%)
Estimate C&W EBIT CAGR of ~21% over FY25-28
Cables and Wires EBIT
11.6
11.1
10.3
9.5
9.1
10.6
10.9
11.1
11.1
35.7
4.2
4.9
5.7
7.6
9.7
12.1
14.6
17.2
Source: MOFSL, Company
26 September 2025
15
 Motilal Oswal Financial Services
Cables and Wires | Thematic
Revenue from the retail segment and growth
Retail sales (INR b)
YoY (%)
Retail segment’s share in sales increasing YoY
Retail sales as % of total sales
52
47
46
41
31
33
34
29
29
7.7
10.9
13.9
14.2
14.1
23.2
31.7
37.7
50.9
Source: MOFSL, Company
Adv. expenses as a percentage of sales
Ad-spends as % of retail sales
1.8
1.4
1.4
0.9
0.7
0.4
0.3
0.5
0.5
0.3
0.5
0.3
0.5
0.5
Ad-spends as % of sales
Ad spends increased 18% YoY
Ad-spends (INR m)
97
YoY (%)
113
(50)
88
7
1.2
1.1
0.9
31
34
(22)
18
1.0
75
149
194
260
130
277
215
405
478
Source: MOFSL, Company
Growth in the dealer/distributor network
Dealers and distributors
27.4
11.8
23.9
11.9 12.9 13.8
0.3
9.1
5.8
4.2
4.6
YoY change (%)
Geographical split of dealer/distributor
15%
North
40%
18%
East
West
27%
South
Source: MOFSL, Company
One-year forward P/E chart
P/E (x)
Min (x)
60.0
45.0
30.0
15.0
0.0
57.5
35.7
22.0
8.2
42.3
Avg (x)
+1SD
Max (x)
-1SD
8.0
6.0
4.0
2.0
0.0
One-year forward P/B chart
P/B (x)
Min (x)
Avg (x)
+1SD
7.2
5.1
3.6
2.0
1.4
Max (x)
-1SD
5.6
7.4
Source: MOFSL, Company
26 September 2025
16
 Motilal Oswal Financial Services
Cables and Wires | Thematic
Financials and valuations (Consolidated)
Income Statement
Y/E March
Net Sales
Change (%)
EBITDA
% of Net Sales
Depreciation
Interest
Other Income
PBT
Tax
Rate (%)
Extra-ordinary Inc.(net)
Reported PAT
Change (%)
Adjusted PAT
Change (%)
Balance Sheet
Y/E March
Share Capital
Reserves
Net Worth
Loans
Deffered Tax Liability
Capital Employed
Gross Fixed Assets
Less: Depreciation
Net Fixed Assets
Capital WIP
Investments
Curr. Assets
Inventory
Debtors
Cash & Bank Balance
Loans & Advances
Other Current Assets
Current Liab. & Prov.
Creditors
Other Liabilities
Provisions
Net Current Assets
Application of Funds
FY21
41,815
(14.4)
4,605
11.0
578
573
201
3,655
921
25.2
-
2,734
5.7
2,734
5.7
FY22
57,270
37.0
5,887
10.3
555
404
146
5,075
1,315
25.9
-
3,760
37.5
3,760
37.5
FY23
69,082
20.6
7,020
10.2
571
347
318
6,420
1,647
25.7
-
4,773
26.9
4,773
26.9
FY24
81,041
17.3
8,375
10.3
614
439
490
7,813
2,002
25.6
2.1
5,813
21.8
5,811
21.7
FY25
97,359
20.1
9,910
10.2
701
556
718
9,370
2,406
25.7
-
6,964
19.8
6,964
19.9
FY26E
1,16,264
19.4
12,141
10.4
1,047
603
1,330
11,821
3,035
25.7
-
8,786
26.2
8,786
26.2
FY27E
1,36,153
17.1
14,802
10.9
1,425
814
1,384
13,947
3,581
25.7
-
10,367
18.0
10,367
18.0
(INR M)
FY28E
1,59,708
17.3
17,727
11.1
1,789
871
1,440
16,507
4,238
25.7
-
12,269
18.4
12,269
18.4
(INR M)
FY28E
191
87,368
87,559
883
304
88,746
32,816
8,570
24,246
4,000
17
85,401
27,128
29,754
21,770
43
6,706
24,918
17,502
6,782
634
60,483
88,746
FY21
180
17,597
17,776
2,850
296
20,922
6,631
1,869
4,761
71
9
25,295
7,682
13,496
2,212
220
1,685
9,214
7,414
1,658
142
16,081
20,922
FY22
180
21,175
21,355
3,314
294
24,963
7,733
2,424
5,309
165
20
29,776
10,794
13,955
3,600
16
1,410
10,307
7,626
2,538
143
19,469
24,963
FY23
180
25,711
25,892
1,353
266
27,511
8,668
2,995
5,673
146
13
31,870
11,023
13,878
5,372
24
1,573
10,191
7,482
2,469
240
21,679
27,511
FY24
180
31,302
31,483
1,342
273
33,098
11,312
3,608
7,703
1,224
16
37,636
13,427
15,179
7,004
27
2,000
13,482
10,079
3,106
296
24,155
33,098
FY25
191
57,666
57,858
1,783
304
59,945
14,240
4,310
9,931
3,855
17
58,543
17,303
17,972
19,153
27
4,088
12,401
7,792
4,223
387
46,142
59,945
FY26E
191
65,879
66,070
1,483
304
67,857
20,671
5,357
15,314
4,000
17
66,029
19,749
21,660
19,706
32
4,882
17,503
12,104
4,937
462
48,526
67,857
FY27E
191
75,672
75,863
1,183
304
77,350
26,816
6,782
20,035
4,000
17
74,542
23,127
25,366
20,295
37
5,717
21,243
14,921
5,782
541
53,299
77,350
26 September 2025
17
 Motilal Oswal Financial Services
Cables and Wires | Thematic
Financials and valuations (Consolidated)
Ratios
Y/E March
Basic (INR)
Adjusted EPS
Growth (%)
Cash EPS
Book Value
DPS
Payout (incl. Div. Tax.)
Valuation (x)
P/Sales
P/E
Cash P/E
EV/EBITDA
EV/Sales
Price/Book Value
Dividend Yield (%)
Profitability Ratios (%)
RoE
RoCE
RoIC
Turnover Ratios
Debtors (Days)
Inventory (Days)
Creditors. (Days)
Asset Turnover (x)
Leverage Ratio
Net Debt/Equity (x)
Cash Flow Statement
Y/E March
PBT before EO Items
Add : Depreciation
Interest
Less : Direct Taxes Paid
(Inc)/Dec in WC
Others
CF from Operations
(Inc)/Dec in FA
Free Cash Flow
(Pur)/Sale of Investments
Others
CF from Investments
(Inc)/Dec in Net Worth
(Inc)/Dec in Debt
Less : Interest Paid
Dividend Paid
Others
CF from Fin. Activity
Inc/Dec of Cash
Add: Beginning Balance+FD
Closing Balance
FY21
30.4
5.3
36.9
197.8
2.0
6.6
8.7
133.5
110.2
79.4
8.7
20.5
0.0
16.6
16.0
17.2
118
67
65
2.0
0.0
FY22
41.7
37.2
47.9
237.0
2.5
6.0
6.4
97.3
84.8
62.1
6.4
17.1
0.1
19.2
17.7
19.7
89
69
49
2.3
(0.0)
FY23
52.9
26.8
59.3
287.1
3.0
5.7
5.3
76.7
68.5
51.6
5.2
14.1
0.1
20.2
19.2
22.1
73
58
40
2.5
(0.2)
FY24
64.4
21.7
71.2
348.9
3.5
4.8
4.5
63.1
57.0
43.1
4.5
11.6
0.1
20.3
20.3
24.0
68
60
45
2.4
(0.2)
FY25
72.9
13.2
80.2
605.5
3.6
6.0
4.0
55.7
50.6
37.4
3.8
6.7
0.1
15.6
15.9
20.5
67
65
29
1.6
(0.3)
FY26E
91.9
26.2
102.9
691.4
5.0
6.5
3.3
44.2
39.5
30.5
3.2
5.9
0.1
14.2
14.5
18.5
68
62
38
1.7
(0.3)
FY27E
108.5
18.0
123.4
793.9
5.0
5.5
2.8
37.4
32.9
24.9
2.7
5.1
0.1
14.6
15.1
18.9
68
62
40
1.8
(0.3)
FY28E
128.4
18.4
147.1
916.3
5.0
4.7
2.4
31.6
27.6
20.7
2.3
4.4
0.1
15.0
15.6
19.1
68
62
40
1.8
(0.2)
(INR M)
FY28E
16,507
1,789
871
4,238
5,710
(1,440)
7,779
(6,000)
1,779
-
1,440
(4,560)
-
(300)
871
573
-
(1,744)
1,475
20,295
21,770
FY21
3,654
578
554
903
2,420
76
1,539
(240)
1,299
952
51
763
79
(714)
471
180
-
(1,286)
1,016
1,196
2,212
FY22
5,075
555
404
1,247
2,505
4
2,286
(597)
1,688
(8)
23
(583)
56
666
404
224
(408)
(314)
1,389
2,211
3,600
FY23
6,420
571
347
1,776
349
(74)
5,139
(979)
4,160
(547)
158
(1,368)
20
(1,961)
347
271
-
(2,559)
1,211
4,160
5,372
FY24
7,811
614
439
2,045
689
(24)
6,105
(4,005)
2,100
265
214
(3,526)
11
(9)
439
281
(225)
(942)
1,637
5,368
7,004
FY25
9,370
701
556
2,261
8,227
(461)
(322)
(6,977)
(7,299)
(8,329)
298
(15,007)
20,011
441
556
418
(292)
19,185
3,856
15,297
19,153
FY26E
11,821
1,047
603
3,035
1,831
(1,330)
7,275
(6,576)
700
-
1,330
(5,245)
-
(300)
603
573
-
(1,477)
553
19,153
19,707
FY27E
13,947
1,425
814
3,581
4,184
(1,384)
7,037
(6,145)
892
-
1,384
(4,762)
-
(300)
814
573
-
(1,687)
588
19,707
20,295
26 September 2025
18
 Motilal Oswal Financial Services
Cables and Wires | Thematic
26 September 2025
Update | Sector: Cables and Wires
R R Kabel
BSE SENSEX
80,426
S&P CNX
24,655
CMP: INR1,216
TP: INR1,340 (+10%)
Neutral
Capex-led growth; channel expansion fuels market reach
Strong growth planned over FY25-28E
R R Kabel (RRKABEL) has embarked on a focused three-year growth journey under
its strategic initiative, Project RRISE. During this period, it aims to increase capacity
by 1.7x, supporting domestic business growth of 1.6x and export business growth
of 1.8x. Overall, the company targets an 18% CAGR in its C&W business and a 25%
CAGR in FMEG revenue. Moreover, management aims to grow EBITDA by 2.5x,
and has earmarked a capex of INR12b for FY26-28E, focusing on expansions at its
existing facilities in Silvassa and Waghodia. 80% of this capex will be allocated to
increasing cable production capacity. INR10.5b will be invested in capacity
expansion at the Waghodia plant in Gujarat, which is expected to be completed in
phases by Mar’28. This will lead to an installed capacity increase of ~55% at this
plant. Capex is pegged at INR1.5b for capacity expansion at the Silvassa, Dadra,
and Nagar Haveli plant, which is expected to be commissioned by Dec’26. An
earlier planned capex of INR2.5b at this plant is expected to become operational
by Mar’26.
Bloomberg
Equity Shares (m)
M.Cap.(INRb)/(USDb)
52-Week Range (INR)
1, 6, 12 Rel. Per (%)
12M Avg Val (INR M)
Free float (%)
RRKABEL IN
113
137.8 / 1.6
1815 / 751
2/30/-23
355
38.2
Financials & Valuations (INR b)
Y/E MARCH
FY26E FY27E FY28E
Sales
88.5 102.0 117.5
EBITDA
6.5
7.6
9.1
Adj. PAT
4.2
4.6
5.4
EBITDA Margin (%)
7.3
7.5
7.7
Cons. Adj. EPS (INR)
37.0
40.9
48.2
EPS Gr. (%)
34.1
10.7
17.7
BV/Sh. (INR)
220.3 254.2 294.4
Ratios
Net D:E
0.2
0.2
0.1
RoE (%)
18.0
17.2
17.6
RoCE (%)
16.7
15.9
16.3
Payout (%)
18.9
17.1
16.6
Valuations
P/E (x)
33.0
29.8
25.3
P/BV (x)
5.5
4.8
4.1
EV/EBITDA (x)
21.8
18.6
15.7
Div Yield (%)
0.6
0.6
0.7
FCF Yield (%)
(2.6)
0.5
1.2
Product innovation and new product offerings to support growth
RRKABEL is focused on product innovation and high-margin product offerings,
such as FireX LS0H-EBXL (halogen-free, low-smoke wire for public and commercial
buildings) that comply with the latest safety regulations. The company is also
introducing new product categories, such as medium voltage cables up to 66 kV,
and enhancing its premium and mid-premium range of FMEG products (premium
decorative fans, downlight panels, and switchgears). In the FMEG segment, the
company is prioritizing premiumization, improving channel efficiency
(optimization of logistics and promotional costs), expanding presence across
multiple price points with a balanced product portfolio, and targeting profitability
by FY26. It has significantly increased its distribution network over the past few
years, currently backed by a pan-India distribution network including ~4,400
distributors and 4,500 dealers. Over FY20-25, its distributor and dealer counts
recorded a CAGR of 32% and 12%, respectively. The company’s products are
available at ~191k retail touchpoints, with a network connecting ~583k
electricians. Its advertising and promotion spending increased 25% YoY to INR1.3b
in FY25, and the company spent 1.6% of its revenue on ads during the year. We
estimate ad spending to stand at 1.6% of revenue over FY25-28 (13% CAGR over
FY25-28). Sponsorships of cricket teams such as the Kolkata Knight Riders and the
UP Warriorz have contributed to enhancing the company’s brand presence.
Supported by a strong R&D team, the company develops first-of-its-kind products
and secures export certifications from various countries. The company exports
C&W to 74 countries and has over 57 international certifications.
Shareholding pattern (%)
As On
Jun-25 Mar-25
Promoter
61.8
61.8
DII
13.6
14.7
FII
8.6
7.2
Others
16.0
16.3
FII Includes depository receipts
Stock Performance (1-year)
Jun-24
61.9
13.5
6.5
18.1
Capex fueled for future growth
We estimate RRKABEL’s revenue/EBITDA/PAT CAGR at ~16%/23%/20% over FY25-
28. Further, we estimate OPM to expand to ~8% over FY27-28E vs ~6% in FY25,
aided by an increase in cable contribution to overall revenue. The C&W segment’s
26 September 2025
19
 Motilal Oswal Financial Services
Cables and Wires | Thematic
revenue posted a CAGR of ~24% over FY19-25. Going forward, we expect ~15%
revenue CAGR for the C&W segment over FY25-28. In the FMEG segment, the
company’s revenue posted a CAGR of ~44% over FY19-25. We estimate ~14%
revenue CAGR in this segment over FY25-28. Its cumulative OCF is projected at
INR12.7b over FY26-28 vs. INR12.9b over FY23-25. Cumulative net cash outflow is
estimated to be INR1.2b over FY26-28 vs FCF of INR6.2b over FY23-25, driven by
higher capex.
Valuation and view
RRKABEL’s volume growth in 1Q was below the industry average due to the spillover
of domestic orders and cable capacity operating at optimum levels. The ongoing
expansion at the Waghodia plant is estimated to boost cable volumes over the next
three years. Management remains confident of achieving its fullyear volume growth
guidance of ~18%, supported by a robust 25% growth in cables during 9MFY25.
Additionally, the company projects to achieve break-even in the FMEG business in
FY26. We value RRKABEL at 30x Sep’27E EPS to arrive at a TP of INR1,340. Reiterate
Neutral.
Story in charts
Estimate revenue CAGR of ~16% over FY25-28
Revenue (INR b)
61.0
27.7
3.8
24
25
9.9
YoY (%)
8.3
Estimate EBITDA CAGR of ~23% over FY25-28
EBITDA (INR b)
7.4
8.4
6.9
7.0
5.8
6.4
EBITDA Margin (%)
7.3
7.5
7.7
20.6
17.8
15.5 16.2 15.2
15.2
27
44
56
66
76
89
102
118
1.8
2.0
2.3
3.0
3.2
4.6
4.9
6.5
7.6
9.1
Source: MOFSL, Company
C&W revenue CAGR of ~15% over FY25-28E
Cables and wires (INR b)
63.1
YoY (%)
FMEG EBITDA CAGR of ~14% over FY25-28E
FMEG (INR b)
135.5
YoY (%)
12.1
(0.4)
22
25
41
20.6
17.6
14.7
15.5
15.2
15.2
31.0
5.1
1.9
2.0
34.9
2.7
6.5
19.9
7.8
19.7
9.3
11.9
10.4
15.5
12.0
15.5
13.9
50
58
67
77
89
102
Source: MOFSL, Company
26 September 2025
20
 Motilal Oswal Financial Services
Cables and Wires | Thematic
Revenue mix
Cables and wires
5
8
7
6
12
12
FMEG
12
12
12
12
3.6
95
92
93
PAT margin to remain stable over FY26-28
PAT (INR b)
4.9
5.0
4.9
3.4
4.5
PAT Margin (%)
4.7
4.1
4.5
4.6
94
88
88
88
88
88
88
0.9
1.2
1.4
2.1 1.9
3.0
3.1
4.2
4.6
5.4
Source: MOFSL, Company
Higher OCF to fund capex plans
9.0
6.0
3.0
0.0
-3.0
OFC (INR b)
Capex (INR b)
RoE/RoCE to remain stable
4.0
2.0
0.0
-2.0
-4.0
10.8
11.9
10.8
13.3
14.1 13.9
13.7
11.9
14.2
16.6
15.7
15.8
ROE (%)
18.6
18.4
ROCE (%)
18.0
17.2 17.6
16.7
15.9 16.3
FY19 FY20 FY21 FY22 FY23 FY24 FY25 FY26E FY27E FY28E
Source: MOFSL, Company
Project RRise
Source: MOFSL, Company
26 September 2025
21
 Motilal Oswal Financial Services
Cables and Wires | Thematic
One-year forward P/E chart
P/E (x)
Min (x)
68
60.1
56
46.6
44
32
20
25.9
57.8
34.2
4
2
8
6
Avg (x)
+1SD
Max (x)
-1SD
10
One-year forward P/B chart
P/B (x)
Min (x)
Avg (x)
+1SD
9.0
7.1
5.6
5.4
4.1
8.6
Max (x)
-1SD
35.3
Source: MOFSL, Company
26 September 2025
22
 Motilal Oswal Financial Services
Cables and Wires | Thematic
Financials and valuations (Consolidated)
Income Statement (INR m)
Y/E March
Net Sales
Change (%)
EBITDA
Change (%)
Margin (%)
Depreciation
Int. and Fin. Charges
Other Income
Profit before Taxes
Change (%)
Margin (%)
Tax
Tax Rate (%)
Profit before JV/Associates/Minority Interest
Share of JV/Associates
Adjusted PAT
Change (%)
Margin (%)
Reported PAT
Balance Sheet (INR m)
Y/E March
Share Capital
Reserves
Net Worth
Loans
Deferred Tax Liability
Capital Employed
Gross Fixed Assets
Less: Depreciation
Net Fixed Assets
Capital WIP
Investments
Curr. Assets
Inventory
Investments
Debtors
Cash & Bank Balance
Loans & Advances
Other Current Assets
Current Liab. & Prov.
Creditors
Other Liabilities
Provisions
Net Current Assets
Application of Funds
FY21
27,239
9.9
2,301
12.4
8.4
448
271
220
1,803
14.3
6.6
460
25.5
1,343
11
1,354
11
5.0
1,354
FY22
43,859
61.0
3,032
31.8
6.9
461
233
463
2,802
55.4
6.4
704
25.1
2,097
42
2,139
58
4.9
2,139
FY23
55,992
27.7
3,223
6.3
5.8
596
421
344
2,550
(9.0)
4.6
661
25.9
1,889
9
1,899
(11)
3.4
1,899
FY24
65,946
17.8
4,617
43.2
7.0
655
539
626
4,050
58.8
6.1
1,080
26.7
2,970
11
2,981
57
4.5
2,981
FY25
76,182
15.5
4,856
5.2
6.4
705
589
511
4,074
0.6
5.3
978
24.0
3,095
21
3,116
5
4.1
3,116
FY26E
88,517
16.2
6,488
33.6
7.3
766
679
526
5,569
36.7
6.3
1,426
25.6
4,143
35
4,178
34
4.7
4,178
FY27E
1,02,006
15.2
7,638
17.7
7.5
839
1,170
537
6,165
10.7
6.0
1,578
25.6
4,587
40
4,627
11
4.5
4,627
FY28E
1,17,517
15.2
9,068
18.7
7.7
991
1,362
548
7,262
17.8
6.2
1,859
25.6
5,403
45
5,448
18
4.6
5,448
FY21
239
10,227
10,466
4,987
79
15,532
5,526
1,527
3,999
67
406
12,679
5,341
1,960
4,204
85
58
1,032
1,619
1,135
369
115
11,061
15,532
FY22
239
12,264
12,503
5,211
131
17,845
5,914
1,923
3,991
423
622
15,471
7,096
2,055
5,171
123
143
882
2,661
1,679
771
212
12,809
17,845
FY23
478
13,718
14,197
5,158
149
19,504
7,574
2,403
5,172
436
777
19,951
8,602
2,849
5,919
811
129
1,642
6,832
4,401
1,982
448
13,119
19,504
FY24
564
17,721
18,285
2,890
247
21,422
8,222
2,876
5,346
1,636
1,065
20,646
8,978
2,350
6,412
988
326
1,592
7,271
4,292
2,582
397
13,375
21,422
FY25
565
20,961
21,526
2,220
302
24,049
11,098
3,409
7,690
2,347
1,868
23,264
10,109
524
8,232
2,269
367
1,764
11,120
7,623
3,052
445
12,144
24,049
FY26E
565
24,348
24,913
7,020
302
32,236
16,759
4,175
12,584
3,313
1,868
25,524
11,799
524
8,003
2,542
438
2,219
11,053
7,326
3,303
424
14,471
32,236
FY27E
565
28,183
28,749
8,120
302
37,171
20,413
5,014
15,399
3,313
1,868
29,340
13,597
524
9,222
2,953
505
2,539
12,748
8,453
3,807
488
16,591
37,171
FY28E
565
32,726
33,292
8,620
302
42,214
24,091
6,006
18,085
3,313
1,868
33,636
15,664
524
10,625
3,335
581
2,907
14,687
9,739
4,386
562
18,948
42,214
26 September 2025
23
 Motilal Oswal Financial Services
Cables and Wires | Thematic
Financials and valuations (Consolidated)
Ratios
Y/E March
Basic (INR)
EPS
Cash EPS
BV/Share
DPS
Payout %
Valuation (x)
P/E
Cash P/E
EV/Sales
EV/EBITDA
P/BV
Dividend Yield (%)
Return Ratios (%)
RoE
RoCE
RoIC
Working Capital Ratios
Debtor (Days)
Creditor (Days)
Inventory (Days)
Asset Turnover (x)
Leverage Ratio
Debt/Equity (x)
Cash Flow Statement
Y/E March
Profit before tax
Depreciation
Exceptional Income
Interest Paid
Others
Direct Taxes Paid
(Incr)/Decr in WC
CF from Operations
Incr in FA
Pur of Investments
Interest/MF/Div Income
Others
CF from Invest.
Changes in Net worth
Incr in Debt
Dividend Paid
Interest paid
Others
CF from Fin. Activity
Incr/Decr of Cash
Add: Opening Balance
Closing Balance (inc. bank balance)
FY21
12.0
15.9
218.7
0.0
0.0
101.7
76.4
5.2
61.1
5.6
0.0
13.9
10.8
10.2
56.3
15.2
71.6
1.9
0.5
FY22
18.9
23.0
261.3
0.0
0.0
64.4
53.0
3.2
46.4
4.7
0.0
18.6
13.7
12.3
43.0
14.0
59.1
2.6
0.4
FY23
16.8
22.1
148.4
0.0
0.0
72.5
55.2
2.5
43.2
8.2
0.0
14.2
11.9
12.3
38.6
28.7
56.1
3.0
0.4
FY24
26.4
32.2
162.1
3.0
11.4
46.2
37.9
2.1
29.7
7.5
0.2
18.4
16.6
16.1
35.5
23.8
49.7
3.2
0.2
FY25
27.6
33.8
190.4
6.0
21.8
44.2
36.0
1.8
28.2
6.4
0.5
15.7
15.8
14.8
39.4
36.5
48.4
3.4
0.1
FY26E
37.0
43.7
220.3
7.0
18.9
33.0
27.9
1.6
21.8
5.5
0.6
18.0
16.7
14.6
35.0
30.2
48.7
3.1
0.3
FY27E
40.9
48.3
254.2
7.0
17.1
29.8
25.2
1.4
18.6
4.8
0.6
17.2
15.9
15.0
35.0
30.2
48.7
2.9
0.3
FY28E
48.2
56.9
294.4
8.0
16.6
25.3
21.4
1.2
15.7
4.1
0.7
17.6
16.3
15.7
35.0
30.3
48.7
3.0
0.3
FY21
1,803
448
-
271
23
(419)
(2,837)
(711)
(474)
367
39
10
(59)
-
1,029
-
(287)
(33)
708
(61)
113
85
FY22
2,844
461
-
233
(69)
(733)
(1,754)
982
(682)
(2)
11
47
(627)
-
184
(278)
(222)
(40)
(356)
(1)
85
123
FY23
2,560
596
-
421
9
(582)
1,534
4,537
(1,083)
(1,188)
27
(1,090)
(3,335)
-
(160)
(500)
(355)
-
(1,015)
187
623
811
FY24
4,061
655
-
539
(259)
(965)
(641)
3,390
(1,897)
982
58
22
(835)
1,800
(2,408)
(838)
(506)
(98)
(2,050)
505
483
988
FY25
4,095
705
-
589
(136)
(965)
656
4,944
(3,671)
1,937
30
13
(1,690)
83
(836)
(621)
(538)
-
(1,912)
1,342
927
2,381
FY26E
5,604
766
-
679
(526)
(1,426)
(2,054)
3,044
(6,627)
-
526
-
(6,100)
-
4,800
(792)
(679)
-
3,329
273
2,381
2,654
FY27E
6,205
839
-
1,170
(537)
(1,578)
(1,709)
4,390
(3,654)
-
537
-
(3,117)
-
1,100
(792)
(1,170)
-
(861)
412
2,654
3,066
FY28E
7,307
991
-
1,362
(548)
(1,859)
(1,975)
5,278
(3,678)
-
548
-
(3,130)
-
500
(905)
(1,362)
-
(1,767)
381
3,066
3,447
Investment in securities market are subject to market risks. Read all the related documents carefully before investing.
26 September 2025
24
 Motilal Oswal Financial Services
Cables and Wires | Thematic
Explanation of Investment Rating
Investment Rating
BUY
SELL
NEUTRAL
UNDER REVIEW
NOT RATED
Expected return (over 12-month)
>=15%
< - 10%
< - 10 % to 15%
Rating may undergo a change
We have forward looking estimates for the stock but we refrain from assigning recommendation
*In case the recommendation given by the Research Analyst is inconsistent with the investment rating legend for a continuous period of 30 days, the Research Analyst shall be within following
30 days take appropriate measures to make the recommendation consistent with the investment rating legend.
Disclosures
The following Disclosures are being made in compliance with the SEBI Research Analyst Regulations 2014 (herein after referred to as the Regulations).
Motilal Oswal Financial Services Ltd. (MOFSL) is a SEBI Registered Research Analyst having registration no. INH000000412. MOFSL, the Research Entity (RE) as defined in the Regulations,
is engaged in the business of providing Stock broking services, Depository participant services & distribution of various financial products. MOFSL is a listed public company, the details in respect
of which are available on
www.motilaloswal.com.
MOFSL (erstwhile Motilal Oswal Securities Limited - MOSL) is registered with the Securities & Exchange Board of India (SEBI) and is a registered
Trading Member with National Stock Exchange of India Ltd. (NSE) and Bombay Stock Exchange Limited (BSE), Multi Commodity Exchange of India Limited (MCX) and National Commodity &
Derivatives Exchange Limited (NCDEX) for its stock broking activities & is Depository participant with Central Depository Services Limited (CDSL) National Securities Depository Limited
(NSDL),NERL, COMRIS and CCRL and is member of Association of Mutual Funds of India (AMFI) for distribution of financial products and Insurance Regulatory & Development Authority of India
(IRDA) as Corporate Agent for insurance products.
Details of associate entities of Motilal Oswal Financial Services Limited are available on the website at
http://onlinereports.motilaloswal.com/Dormant/documents/List%20of%20Associate%20companies.pdf
MOFSL and its associate company(ies), their directors and Research Analyst and their relatives may; (a) from time to time, have a long or short position in, act as principal in, and buy or sell the
securities or derivatives thereof of companies mentioned herein. (b) be engaged in any other transaction involving such securities and earn brokerage or other compensation or act as a market
maker in the financial instruments of the company(ies) discussed herein or act as an advisor or lender/borrower to such company(ies) or may have any other potential conflict of interests with
respect to any recommendation and other related information and opinions.; however the same shall have no bearing whatsoever on the specific recommendations made by the analyst(s), as
the recommendations made by the analyst(s) are completely independent of the views of the associates of MOFSL even though there might exist an inherent conflict of interest in some of the
stocks mentioned in the research report.
MOFSL and / or its affiliates do and seek to do business including investment banking with companies covered in its research reports. As a result, the recipients of this report should be aware
that MOFSL may have a potential conflict of interest that may affect the objectivity of this report. Compensation of Research Analysts is not based on any specific merchant banking, investment
banking or brokerage service transactions. Details of pending Enquiry Proceedings of Motilal Oswal Financial Services Limited are available on the website at
https://galaxy.motilaloswal.com/ResearchAnalyst/PublishViewLitigation.aspx
A graph of daily closing prices of securities is available at
www.nseindia.com, www.bseindia.com.
Research Analyst views on Subject Company may vary based on Fundamental research and
Technical Research. Proprietary trading desk of MOFSL or its associates maintains arm’s length distance with Research Team as all the activities are segregated from MOFSL research activity
and therefore it can have an independent view with regards to Subject Company for which Research Team have expressed their views.
Regional Disclosures (outside India)
This report is not directed or intended for distribution to or use by any person or entity resident in a state, country or any jurisdiction, where such distribution, publication, availability or use would
be contrary to law, regulation or which would subject MOFSL & its group companies to registration or licensing requirements within such jurisdictions.
For Hong Kong:
This report is distributed in Hong Kong by Motilal Oswal capital Markets (Hong Kong) Private Limited, a licensed corporation (CE AYY-301) licensed and regulated by the Hong Kong Securities
and Futures Commission (SFC) pursuant to the Securities and Futures Ordinance (Chapter 571 of the Laws of Hong Kong) “SFO”. As per SEBI (Research Analyst Regulations) 2014 Motilal
Oswal Securities (SEBI Reg. No. INH000000412) has an agreement with Motilal Oswal capital Markets (Hong Kong) Private Limited for distribution of research report in Hong Kong. This report
is intended for distribution only to “Professional Investors” as defined in Part I of Schedule 1 to SFO. Any investment or investment activity to which this document relates is only available to
professional investor and will be engaged only with professional investors.” Nothing here is an offer or solicitation of these securities, products and services in any jurisdiction where their offer or
sale is not qualified or exempt from registration. The Indian Analyst(s) who compile this report is/are not located in Hong Kong & are not conducting Research Analysis in Hong Kong.
For U.S.
Motilal Oswal Financial Services Limited (MOFSL) is not a registered broker - dealer under the U.S. Securities Exchange Act of 1934, as amended (the"1934 act") and under applicable state laws
in the United States. In addition MOFSL is not a registered investment adviser under the U.S. Investment Advisers Act of 1940, as amended (the "Advisers Act" and together with the 1934 Act,
the "Acts), and under applicable state laws in the United States. Accordingly, in the absence of specific exemption under the Acts, any brokerage and investment services provided by MOFSL,
including the products and services described herein are not available to or intended for U.S. persons. This report is intended for distribution only to "Major Institutional Investors" as defined by
Rule 15a-6(b)(4) of the Exchange Act and interpretations thereof by SEC (henceforth referred to as "major institutional investors"). This document must not be acted on or relied on by persons
who are not major institutional investors. Any investment or investment activity to which this document relates is only available to major institutional investors and will be engaged in only with
major institutional investors. In reliance on the exemption from registration provided by Rule 15a-6 of the U.S. Securities Exchange Act of 1934, as amended (the "Exchange Act") and
interpretations thereof by the U.S. Securities and Exchange Commission ("SEC") in order to conduct business with Institutional Investors based in the U.S., MOFSL has entered into a chaperoning
agreement with a U.S. registered broker-dealer, Motilal Oswal Securities International Private Limited. ("MOSIPL"). Any business interaction pursuant to this report will have to be executed within
the provisions of this chaperoning agreement.
The Research Analysts contributing to the report may not be registered /qualified as research analyst with FINRA. Such research analyst may not be associated persons of the U.S. registered
broker-dealer, MOSIPL, and therefore, may not be subject to NASD rule 2711 and NYSE Rule 472 restrictions on communication with a subject company, public appearances and trading
securities held by a research analyst account.
For Singapore
In Singapore, this report is being distributed by Motilal Oswal Capital Markets (Singapore) Pte. Ltd. (“MOCMSPL”) (UEN 201129401Z), which is a holder of a capital markets services license and
an exempt financial adviser in Singapore.This report is distributed solely to persons who (a) qualify as “institutional investors” as defined in section 4A(1)(c) of the Securities and Futures Act of
Singapore (“SFA”) or (b) are considered "accredited investors" as defined in section 2(1) of the Financial Advisers Regulations of Singapore read with section 4A(1)(a) of the SFA. Accordingly, if
a recipient is neither an “institutional investor” nor an “accredited investor”, they must immediately discontinue any use of this Report and inform MOCMSPL .
In respect of any matter arising from or in connection with the research you could contact the following representatives of MOCMSPL. In case of grievances for any of the services rendered by
MOCMSPL write to
grievances@motilaloswal.com.
Nainesh Rajani
Email:
nainesh.rajani@motilaloswal.com
Contact: (+65) 8328 0276
.
Specific Disclosures
1. Research Analyst and/or his/her relatives do not have a financial interest in the subject company(ies), as they do not have equity holdings in the subject company(ies).
MOFSL has financial interest in the subject company(ies) at the end of the week immediately preceding the date of publication of the Research Report: Yes.
Nature of Financial interest is holding equity shares or derivatives of the subject company
2. Research Analyst and/or his/her relatives do not have actual/beneficial ownership of 1% or more securities in the subject company(ies) at the end of the month immediately
preceding the date of publication of Research Report.
MOFSL has actual/beneficial ownership of 1% or more securities of the subject company(ies) at the end of the month immediately preceding the date of publication of Research
Report:No
3. Research Analyst and/or his/her relatives have not received compensation/other benefits from the subject company(ies) in the past 12 months.
MOFSL may have received compensation from the subject company(ies) in the past 12 months.
4. Research Analyst and/or his/her relatives do not have material conflict of interest in the subject company at the time of publication of research report.
MOFSL does not have material conflict of interest in the subject company at the time of publication of research report.
5. Research Analyst has not served as an officer, director or employee of subject company(ies).
6. MOFSL has not acted as a manager or co-manager of public offering of securities of the subject company in past 12 months.
7. MOFSL has not received compensation for investment banking /merchant banking/brokerage services from the subject company(ies) in the past 12 months.
26 September 2025
25
 Motilal Oswal Financial Services
Cables and Wires | Thematic
8.
MOFSL may have received any compensation for products or services other than investment banking or merchant banking or brokerage services from the subject company(ies)
in the past 12 months.
9. MOFSL may have received compensation or other benefits from the subject company(ies) or third party in connection with the research report.
10. MOFSL has not engaged in market making activity for the subject company.
********************************************************************************************************************************
The associates of MOFSL may have:
-
financial interest in the subject company
-
actual/beneficial ownership of 1% or more securities in the subject company at the end of the month immediately preceding the date of publication of the Research Report or date of the
public appearance.
-
received compensation/other benefits from the subject company in the past 12 months
-
any other potential conflict of interests with respect to any recommendation and other related information and opinions.; however the same shall have no bearing whatsoever on the
specific recommendations made by the analyst(s), as the recommendations made by the analyst(s) are completely independent of the views of the associates of MOFSL even though
there might exist an inherent conflict of interest in some of the stocks mentioned in the research report.
-
acted as a manager or co-manager of public offering of securities of the subject company in past 12 months
-
be engaged in any other transaction involving such securities and earn brokerage or other compensation or act as a market maker in the financial instruments of the company(ies)
discussed herein or act as an advisor or lender/borrower to such company(ies)
-
received compensation from the subject company in the past 12 months for investment banking / merchant banking / brokerage services or from other than said services.
-
Served subject company as its clients during twelve months preceding the date of distribution of the research report.
The associates of MOFSL has not received any compensation or other benefits from third party in connection with the research report
Above disclosures include beneficial holdings lying in demat account of MOFSL which are opened for proprietary investments only. While calculating beneficial holdings, It does not consider
demat accounts which are opened in name of MOFSL for other purposes (i.e holding client securities, collaterals, error trades etc.). MOFSL also earns DP income from clients which are not
considered in above disclosures.
Analyst Certification
The views expressed in this research report accurately reflect the personal views of the analyst(s) about the subject securities or issues, and no part of the compensation of the research analyst(s)
was, is, or will be directly or indirectly related to the specific recommendations and views expressed by research analyst(s) in this report.
Terms & Conditions:
This report has been prepared by MOFSL and is meant for sole use by the recipient and not for circulation. The report and information contained herein is strictly confidential and may not be
altered in any way, transmitted to, copied or distributed, in part or in whole, to any other person or to the media or reproduced in any form, without prior written consent of MOFSL. The report is
based on the facts, figures and information that are considered true, correct, reliable and accurate. The intent of this report is not recommendatory in nature. The information is obtained from
publicly available media or other sources believed to be reliable. Such information has not been independently verified and no guaranty, representation of warranty, express or implied, is made
as to its accuracy, completeness or correctness. All such information and opinions are subject to change without notice. The report is prepared solely for informational purpose and does not
constitute an offer document or solicitation of offer to buy or sell or subscribe for securities or other financial instruments for the clients. Though disseminated to all the customers simultaneously,
not all customers may receive this report at the same time. MOFSL will not treat recipients as customers by virtue of their receiving this report.
Disclaimer:
The report and information contained herein is strictly confidential and meant solely for the selected recipient and may not be altered in any way, transmitted to, copied or distributed, in part or in
whole, to any other person or to the media or reproduced in any form, without prior written consent. This report and information herein is solely for informational purpose and may not be used or
considered as an offer document or solicitation of offer to buy or sell or subscribe for securities or other financial instruments. Nothing in this report constitutes investment, legal, accounting and
tax advice or a representation that any investment or strategy is suitable or appropriate to your specific circumstances. The securities discussed and opinions expressed in this report may not be
suitable for all investors, who must make their own investment decisions, based on their own investment objectives, financial positions and needs of specific recipient. This may not be taken in
substitution for the exercise of independent judgment by any recipient. Each recipient of this document should make such investigations as it deems necessary to arrive at an independent
evaluation of an investment in the securities of companies referred to in this document (including the merits and risks involved), and should consult its own advisors to determine the merits and
risks of such an investment. The investment discussed or views expressed may not be suitable for all investors. Certain transactions -including those involving futures, options, another derivative
products as well as non-investment grade securities - involve substantial risk and are not suitable for all investors. No representation or warranty, express or implied, is made as to the accuracy,
completeness or fairness of the information and opinions contained in this document. The Disclosures of Interest Statement incorporated in this document is provided solely to enhance the
transparency and should not be treated as endorsement of the views expressed in the report. This information is subject to change without any prior notice. The Company reserves the right to
make modifications and alternations to this statement as may be required from time to time without any prior approval. MOFSL, its associates, their directors and the employees may from time to
time, effect or have effected an own account transaction in, or deal as principal or agent in or for the securities mentioned in this document. They may perform or seek to perform investment
banking or other services for, or solicit investment banking or other business from, any company referred to in this report. Each of these entities functions as a separate, distinct and independent
of each other. The recipient should take this into account before interpreting the document. This report has been prepared on the basis of information that is already available in publicly accessible
media or developed through analysis of MOFSL. The views expressed are those of the analyst, and the Company may or may not subscribe to all the views expressed therein. This document is
being supplied to you solely for your information and may not be reproduced, redistributed or passed on, directly or indirectly, to any other person or published, copied, in whole or in part, for any
purpose. This report is not directed or intended for distribution to, or use by, any person or entity who is a citizen or resident of or located in any locality, state, country or other jurisdiction, where
such distribution, publication, availability or use would be contrary to law, regulation or which would subject MOFSL to any registration or licensing requirement within such jurisdiction. The
securities described herein may or may not be eligible for sale in all jurisdictions or to certain category of investors. Persons in whose possession this document may come are required to inform
themselves of and to observe such restriction. Neither the Firm, not its directors, employees, agents or representatives shall be liable for any damages whether direct or indirect, incidental, special
or consequential including lost revenue or lost profits that may arise from or in connection with the use of the information.
The person accessing this information specifically agrees to exempt
MOFSL or any of its affiliates or employees from, any and all responsibility/liability arising from such misuse and agrees not to hold MOFSL or any of its affiliates or employees responsible for
any such misuse and further agrees to hold MOFSL or any of its affiliates or employees free and harmless from all losses, costs, damages,
expenses that may be suffered by the person accessing
this information due to any errors and delays.
This report is meant for the clients of Motilal Oswal only.
Investment in securities market are subject to market risks. Read all the related documents carefully before investing.
Registration granted by SEBI and certification from NISM in no way guarantee performance of the intermediary or provide any assurance of returns to investors.
Registered Office Address: Motilal Oswal Tower, Rahimtullah Sayani Road, Opposite Parel ST Depot, Prabhadevi, Mumbai-400025; Tel No.: 022 - 71934200 / 71934263;
www.motilaloswal.com. Correspondence Address: Palm Spring Centre, 2nd Floor, Palm Court Complex, New Link Road, Malad (West), Mumbai- 400 064. Tel No: 022 71881000. Details of
Compliance Officer: Neeraj Agarwal, Email Id: na@motilaloswal.com, Contact No.:022-40548085.
Grievance Redressal Cell:
Contact Person
Contact No.
Email ID
Ms. Hemangi Date
022 40548000 / 022 67490600
query@motilaloswal.com
Ms. Kumud Upadhyay
022 40548082
servicehead@motilaloswal.com
Mr. Ajay Menon
022 40548083
am@motilaloswal.com
Registration details of group entities.: Motilal Oswal Financial Services Ltd. (MOFSL): INZ000158836 (BSE/NSE/MCX/NCDEX); CDSL and NSDL: IN-DP-16-2015; Research Analyst:
INH000000412 . AMFI: ARN .: 146822. IRDA Corporate Agent – CA0579. Motilal Oswal Financial Services Ltd. is a distributor of Mutual Funds, PMS, Fixed Deposit, Insurance, Bond, NCDs
and IPO products.
Customer having any query/feedback/ clarification may write to query@motilaloswal.com. In case of grievances for any of the services rendered by Motilal Oswal Financial Services Limited
(MOFSL) write to grievances@motilaloswal.com, for DP to dpgrievances@motilaloswal.com.
26 September 2025
26