Rs
India Strategy
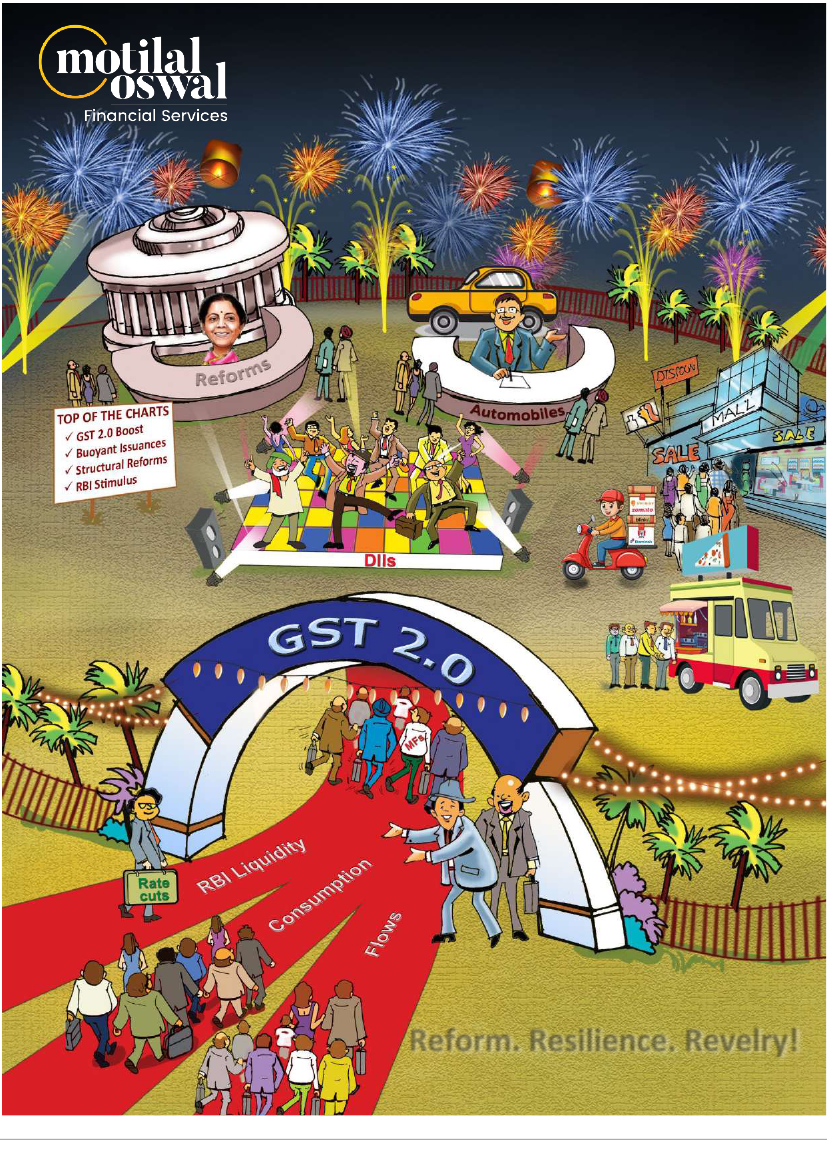
India Strategy | Earnings drought ending, finally!
October 2025
Reform. Resilience. Revelry!
Gautam Duggad
-
Research Analyst
(Gautam.Duggad@MotilalOswal.com)
Investors are advised to refer through important disclosures made at the last page of the Research Report.
1
Motilal Oswal research is available on www.motilaloswal.com/Institutional-Equities, Bloomberg, Thomson Reuters, Factset and S&P Capital.
April 2021
 Motilal Oswal Financial Services
Content:
Reform. Resilience. Revelry!
01
Page #3
Summary
02
Page #10
Corporate earnings at a glance:
Defensives poised to aid earnings
growth
03
Page #13
A year of range-bound market
movement
04
Page #17
2QFY26 Preview: OMCs to drive
earnings, while Private Banks to
drag the same
05
Page #30
MOFSL Universe: 2QFY26 Highlights
& Ready Reckoner
06
Page #47
Sector & Companies Preview
AUTOMOBILES
Pg47
CVs and 2Ws see demand
revival in Q2
CAPITAL GOODS
Pg65
Activity remains strong in
select pockets
CEMENT
Pg78
Near-term weakness
persists; the long-term
outlook positive
Chemicals
Pg88
Volume-led recovery
amid weak spreads and
pricing pressure
CONSUMER
Pg101
Trade disturbance and
early festive season to
impact growth trend; all
eyes on commentary
CON. DURABLE
Pg133
Strong C&W momentum,
but weak RAC demand
EMS
Pg139
Domestic EMS industry
continues to surge
ahead!
FIN. BANKS
Pg145
Headwinds persist;
earnings to recover in
2HFY26
NBFC
Pg164
Demand trends soft,
except in gold; asset
quality stays weak
NON LENDING
Pg183
Rebuilding momentum
with some regulatory
overhang
HEALTHCARE
Pg201
Pharma revenue growth
to be weak in 2QFY26
INFRA
Pg220
Weak execution due to
heavy monsoon
LOGISTICS
Pg224
Logistics volumes remain
muted in 2QFY26
METALS
Pg231
Weak steel prices to
dampen ferrous earnings
OIL & GAS
Pg243
Earnings to soften QoQ
amid weaker margins
Plastic Pipes
Pg257
Weak demand and
volatile pricing to
dampen 2Q earnings
REAL ESTATE
Pg253
Resilient presales
momentum despite
seasonal softness
RETAIL
Pg268
Steady quarter as early
festive boost offsets
weak start
TECHNOLOGY - Pg282
Indian IT: Navigating
headwinds
TELECOM - Pg296
Steady quarter; next
tariff hike key
monitorable
UTILITIES
Pg306
Power demand remains
muted, renewables hold
steady
Others
Pg310
 Motilal Oswal Financial Services
India Strategy
BSE Sensex: 83,433
Nifty 50: 25,461
India Strategy | 2QFY26
Revelry!
Reform. Resilience.
Preview
Mastering the game!
Reform. Resilience. Revelry!
India stands at a crucial juncture in shaping its economic and geopolitical future
through self-determination. Over the past six months, the country has faced several
adverse developments, such as the US tariffs, global geopolitical headwinds, and a
kinetic war. Nevertheless, Indian policymakers have chosen to respond with a ‘resolve
to reform’, turning adversities into opportunities to lay the ground for much stronger,
long-term economic outcomes. Against this backdrop, we discuss the 2QFY26
earnings, and see it as a quarter of bottoming earnings growth and a moderation in
the trajectory of earnings cuts. More importantly, this quarter will reflect the initial
and partial impact of GST2.0 announcements for few sectors, while the corporate
commentaries accompanying earnings releases will be crucial to better assess the
structural impact of reforms on overall demand and corporate earnings. Our bottom-
up estimates suggest a 9% YoY growth in 2QFY26 aggregate PAT for the MOFSL
universe. However, beyond 2QFY26 earnings, given the evolving macro and global
backdrop, we believe markets will start focusing to 2026 soon and keenly analyze
evidence of the positive effects of various policy measures.
Large caps outperform in CY25YTD
and since Sep’24 highs
Nifty-50
Nifty Midcap-100
Nifty Smallcap-100
13
4
-1
-6
YTD
change
-6 -7
-10
Change
from
Sep'24
high
3-yr
CAGR
(%)
India
resilient amid headwinds!
Over the past few months, India has witnessed an unprecedented confluence of
multiple headwinds, such as 1) geopolitical strife, with India forced to engage in kinetic
war, 2) a constant flow of disproportionate, punitive, and unfair US tariff measures, and
3) massive FII outflows
– USD9b between Jul and Sep’25. However, the Indian
government’s response to these chiefly
external developments has been swift,
decisive, and oriented towards long-term capacity building. GST2.0 is one of the
biggest reforms in the past decade, and the government is likely to follow this up with
further reform measures to improve the business environment and potential
economic growth rate. There will likely be a cavalry of reforms after GST 2.0, including
the long-overdue factor market reforms, especially in land and labor, along with
judicial reforms, faster approvals and permits, etc. In addition to policy changes, the
focus will also be on improving the ease of doing business and ease of living,
decriminalizing trivial offenses, and ironing out avoidable costs and day-to-day hassles
that reduce business efficiency.
23 23
Both monetary and fiscal policies working in tandem
The government has been proactive in addressing economic concerns, and the recent
GST rate rationalization response is in addition to several other measures announced
earlier. Particularly on the monetary side, the RBI has been cognizant of weakening
growth impulse, and emboldened by low inflation (the latest CPI print at 2.1%), the RBI
has opened monetary taps by cutting the repo rate by 100bp to 5.5%, while the CRR
rate will be cut by 150bp (by Nov’25). Moreover, the liquidity situation, which was
earlier in the deficit zone, has moved to the surplus territory
facilitating better
transmission
following several back-to - back OMOs and FX swaps. Although the
Central Bank did not announce any further repo rate cuts at the last policy meet, the
overall commentary was benign and growth-positive, with multiple measures aimed at
easing credit flow within the system. This, coupled with the personal income tax
forbearance of INR1t and the latest GST cuts, should work through the system and
3
Abhishek Saraf
Abhishek.Saraf@MotilalOswal.com
Deven Mistry
Deven@MotilalOswal.com
Anshul Agarawal
Aanshul.Agarawal@MotilalOswal.com
October 2025
 Motilal Oswal Financial Services
Reform. Resilience. Revelry!
Mastering the game!
MOFSL Universe to clock ~10%
earnings growth in 2QFY26E
PAT growth YoY (%)
9.9
6.5
10.6
catalyze demand revival, growth acceleration, and improved potential for corporate
earnings. However, growth can be affected if the tariff stalemate extends into 2HFY26,
especially if the US issues further trade-related announcements targeting other sectors
or aspects of its trade with India.
9.1
Resolution to tariff stalemate key for near-term performance
Indian equities have underperformed global peers in the past six months, owing in
good measure to the US tariff measures. Complex global geopolitical equations have
resulted in what we deem as an unjustified and harsh singling out of India by the US for
punitive economic measures. However, we believe the Indian economy is robust
enough to absorb such external shocks (the last two quarterly GDP growth prints of
7.4% and 7.8% in 4QFY25/1QFY26 bear testimony) and that economic forces will
eventually prevail over populist compulsive policies. Nonetheless, in the near term,
Indian markets will stay hostage to volatile sentiments towards Indian equities,
particularly from foreign investors. Hence, any resolution or signs of thaw/easing in
Indo-US engagement will be a key sentiment booster. This, coupled with strong
domestic macros and an improving earnings growth trajectory, should lend support to
Indian equities.
DII flows remain supportive; a pause in FII outflows can be a key catalyst
India’s domestic retail investors have
continued to maintain their faith in Indian equities
and have been consistently investing through SIPs into Mutual Funds (INR840b in
2QFY26). Consequently, DIIs have remained strong buyers of Indian equities (investing a
net USD25b in 2QFY26
~25% higher than the USD20b net flows posted in 1QFY26).
This has also broadly offset the supply of fresh issuances, thereby ensuring limited
impact from a surge in primary market activities. In contrast to domestic institutions, the
foreign institutional flows, after witnessing some traction in 1QFY26, again turned
negative in 2QFY26, posting a net outflow of USD9.3b vs. a net inflow of USD5.4b in
1QFY26. We continue to believe that domestic investors will remain steadfast in their
confidence in Indian equities, providing robust support during drawdowns. Hence,
Indian equities can recover even at the slightest indication of a pause in FII outflows.
Given India’s sharp underperformance over the past one year, combined with the
tailwinds of improving earnings and a policy overdrive, we expect a rotation of FII
capital back into India. This should offer a reasonable upside potential for Indian
equities from current levels.
Key investment themes to align the investment portfolio
Against the current backdrop, we view the following key investment themes emerging:
1) Divergence between Financials and IT services:
We are witnessing divergence in the
prospects of two of the largest sectors, Financials and IT services. Within Financials,
while non-lending names have done well in the past few years, banks were beset by
slowing growth and rising credit costs. However, we now expect banks to start posting
growth from H2FY26 onwards, driven by NIM expansion and higher credit growth as the
credit impulse improves on the back of multiple government measures, making a
stronger structural case for banks. The non-lenders, especially the capital market names,
remain a long-term structural play on rising financialization/equitization of savings.
In contrast, IT services are experiencing a slowdown in demand growth from their
primary market, the US, while the transitional phase of generative AI adoption is
expected to delay clarity regarding service growth.
2) Consumption revival:
The government, after taking cognizance of the need to
stimulate consumption, has embarked on a policy overdrive to announce measures
October 2025
4
 Motilal Oswal Financial Services
Reform. Resilience. Revelry!
Mastering the game!
that can drive higher consumption growth. We believe that all the measures put
together will have a synergistic impact on demand and drive an uptick in consumption
names, along with any derivative of consumption, such as retail lenders, logistics
providers, et al.
3) New-age themes:
While growth has remained a favorite theme for Indian investors,
the market has now broadened enough to offer a reasonably wider choice of
investable universe to investors. Many new-age themes have cropped up in the past
few years, and we recommend strong overweight in some of these themes, such as
quick commerce, renewable energy, mobile app ecosystem-based business models,
etc. At MOFSL too, we have expanded our coverage to include 331 companies, with
several new additions in emerging themes such as quick commerce, renewables, data
centres, high-end discretionary consumption, ER&D, and more.
Indian markets on a strong platform, performance should mean revert
While Indian equities have registered lackluster performance in the past one year
(down ~10% in USD terms since the Sep’24 highs), we continue to highlight that the
Indian markets now appear to be in a healthy state vs. last year, and the platform is set
for Indian equities to mean-revert and post an uptick going forward. The earnings cycle
is bottoming out, with growth likely to pick up into double digits (quarterly PAT growth
of 12%/12% YoY in 3QFY26/4QFY26 and annual PAT growth of 11%/14% YoY in
FY26/FY27). The earnings cut cycle has already started to ease, with the latest quarterly
cuts at a more modest ~1-2% range. Valuations are reasonable, with Nifty trading at
20.6x in line with LPA, and any evidence of earnings growth pickup should help
valuations expand. We believe that the cavalry of measures by the government will
help to reset the trajectory of corporate earnings as domestic reforms are expected to
continue, while any resolution of the tariff stalemate will be a key external catalyst in
our opinion. We see potential for further market upside, especially in an environment
characterized by improving corporate earnings growth, low interest rates, ample
liquidity, and macroeconomic recovery. Our model portfolio is more aligned towards
domestic names, driven by expectations of a domestic economic rebound. While
SMIDs trade at expensive valuations, we continue to focus on this segment, selectively
picking high-conviction SMID names in our portfolio.
Modest expectations for 2Q; Nifty EPS cut 1.1%/1.7% for FY26E/FY27E
We estimate the MOFSL Universe/Nifty-50 earnings to grow 9%/6% YoY in 2QFY26. Ex-
Financials, we expect earnings to increase 16%/10% YoY, whereas ex-Metals and O&G,
we project the earnings to rise 6%/4% YoY for the quarter. The overall earnings growth
is expected to be modest and will be anchored by O&G (+25% YoY), NBFC-Lending
(+21%), Telecom (loss-to-profit), Metals (+10%), Technology (+6%), Cement (+62%),
Capital Goods (+14%), and Healthcare (+10%). These sectors are likely to contribute
95% of the incremental YoY accretion in earnings. Conversely, both Private Banks (-7%)
and PSBs (-7%) are likely to contribute adversely to earnings. Further, we expect FY26
earnings to grow 12% YoY and 9% YoY for the MOFSL Universe and Nifty-50,
respectively. FY26 earnings, ex-Financials, are projected to rise 15% YoY and 11% YoY.
Barring Metals and O&G, FY26 earnings are likely to increase 11% and 9% YoY for the
MOFSL Universe and Nifty-50, respectively. We cut our FY26E/FY27E Nifty EPS by 1.1%/
1.7% and expect it to grow 8%/16% YoY to INR1,096/INR1,274. The Metals, Cement,
BFSI, Auto, and Technology sectors have contributed to the majority of the reduction in
our earnings estimate.
October 2025
5
 Motilal Oswal Financial Services
Reform. Resilience. Revelry!
Mastering the game!
Sectoral PAT growth for the
quarter-ended
Sep’25
(YoY %)
Telecom
Cement
EMS
Real Estate
Logistics
Oil & Gas
Cons. Durables
NBFC - Lending
Retail
Media
Cap. Goods
Staffing
Metals
Healthcare
MOFSL Univ.
Insurance
Technology
Auto
Utilities
Consumer
Chemicals
NBFC - Non Lending
Banks-PSU
Banks-PVT
Infra
Earnings highlights
2QFY26E | OMCs to drive the modest earnings growth
LP
62
36
29
26
25
24
21
19
18
14
12
10
10
9
6
6
5
4
3
3
0
-7
-7
-8
MOFSL: Large-/Mid-/Small-cap PAT
growth in 2QFY26 (YoY %)
23.4
14.3
9.1
6.9
We expect earnings of
MOFSL Universe and Nifty to grow 9% YoY and 6% YoY,
respectively, in 2QFY26.
Excluding financials, the earnings are expected to jump
16% YoY and 10% YoY, whereas, excluding global commodities (i.e., Metals and
O&G), the MOFSL Universe and Nifty are likely to report 6% and 4% YoY growth
in earnings, respectively, for the quarter.
The overall earnings growth is expected to be modest and will be anchored by
O&G (+25% YoY), NBFC-Lending (+21%), Telecom (loss-to-profit), Metals (+10%),
Technology (+6%), Cement (+62%), Capital Goods (+14%), and Healthcare (+10%).
These sectors are likely to contribute 95% of the incremental YoY accretion in
earnings. Conversely, both Private Banks (-7%) and PSBs (-7%) are likely to
contribute adversely to earnings.
Sales and EBITDA for the MOFSL Universe are likely to grow 6% and 8% YoY,
while the same for the Nifty are likely to improve 7% YoY and 8% YoY,
respectively. Ex-Commodities, EBITDA for the MOFSL Universe and Nifty is
projected to grow 5% YoY and 6% YoY, respectively.
In 2QFY26, the
MOFSL large-cap/mid-cap/small-cap
universe is likely to register a
PAT growth of 7%/23%/14%, YoY. Moreover, sales for large-/mid-/small-caps are
likely to grow 6%/6%/8% YoY, and their EBITDA would clock 8%/13%/3% YoY
growth for the quarter.
The earnings of the MOFSL
Financial
Universe are expected to dip 1% YoY,
primarily due to the weak performance of both Private and Public banks, offset by
the strong performance of NBFC-Lending. The
Private Banks
sector is projected to
report an earnings decline (of 7% YoY) for the second straight quarter since
Mar’20.
The
PSU Banks
Universe is also likely to report an earnings decline of 7%,
the lowest in 22 quarters. The earnings of the
Insurance
sector are expected to
remain modest at +6% YoY.
NBFC-Lending
is likely to post a strong 21% YoY
earnings growth (the highest in six quarters), while
NBFC Non-lending
is set to
post a flat YoY growth in earnings
the lowest in 13 quarters.
The earnings of the
O&G
Universe are likely to jump 25% YoY, led by OMCs. This
marks the second quarter of growth after five consecutive quarters of decline.
The
Telecom
universe is likely to clock profits (for the fourth successive quarter)
of INR23b in 2QFY26 (vs. a loss of INR15b in 2QFY25 and a profit of INR16b in
4QFY25), mainly fueled by continued improvement in margins of Bharti Airtel.
The
Metals
universe is projected to report a modest profit growth of 10% YoY.
The
Cement
universe is expected to report a strong earnings growth of 62% YoY
in 2QFY26 (over the weak base of 48% earnings decline for 2QFY25). The sector
is likely to clock the second quarter of earnings growth after four consecutive
quarters of significant earnings dip.
The
Capital Goods
sector is projected to report a healthy earnings growth of 14%
YoY. However, the sector would report the second quarter of less than 15%+
earnings growth after 4QFY25.
The
Healthcare
universe is likely to report 10% YoY earnings growth (the lowest
growth in eight quarters), after clocking six quarters of 15%+ earnings growth
until 4QFY25.
The
Real Estate
universe is likely to deliver a strong quarter with earnings
growth of 29% YoY in 2QFY26 over a strong base of 2QFY25.
October 2025
6
 Motilal Oswal Financial Services
Reform. Resilience. Revelry!
Mastering the game!
The
Technology
sector is likely to register a modest earnings growth of 6% YoY,
the lowest growth in six quarters. This will also mark the ninth quarter of single-
digit profit growth.
The
Auto
sector is likely to report a modest quarter of YoY earnings growth of 5%
in 2QFY26 over a flat base of 2QFY25.
The
Consumer
sector is expected to post a muted earnings growth of 3% YoY,
marking the sixth consecutive quarter of weak earnings print.
The
Chemicals
sector is also likely to report a muted 3% YoY earnings growth
(despite a weak base of 5% YoY earnings dip in 2QFY25). However, this will mark
the third consecutive quarter of earnings growth following a seven-quarter decline.
We expect the EBITDA margin (ex-Financials) to expand 110bp to 17.5% for the
MOFSL Universe. Conversely, for the Nifty-50, EBITDA margin is likely to expand
100bp to 21.1% (ex-Financials) during the quarter.
Sales/EBITDA/PAT of the MOFSL Universe
are expected to report a two-year
CAGR of 6%/5%/4% over 2QFY24 and 2QFY26.
FY26E earnings highlights:
The MOFSL Universe is likely to deliver sales/EBITDA/
PAT growth of 5%/11%/12% YoY. The O&G, NBFC Lending, Metals, and Telecom
sectors are likely to be the key earning drivers with 13%, 23%, 17%, and LP YoY
growth in FY26E, respectively. These four sectors are projected to contribute 49%
of the incremental earnings for the MOFSL Universe in FY26.
Nifty EPS cut for FY26E/27E:
We reduce our FY26E/FY27E Nifty EPS by 1.1%/ 1.7%
and expect it to grow 8%/16% YoY to INR1,096/INR1,274. The Metals, Cement, BFSI,
Auto, and Tech sectors have contributed to the majority of the reduction in our
earnings.
Top ideas: Largecaps:
Bharti Airtel, ICICI Bank, Larsen & Toubro, Mahindra &
Mahindra, Ultratech Cement, Titan Company, Max Healthcare, Bharat
Electronics, Tech Mahindra, TVS Motors, Macrotech, and Indian Hotels.
Midcaps
and Smallcaps
Dixon Technologies, SRF, Suzlon Energy, Jindal Stainless,
Coforge, Supreme Industries, Page Industries, Kaynes Tech, Radico Khaitan, VIP
Industries, UTI AMC, Swiggy, and Niva Bupa Health.
Model portfolio: Key changes
Our model portfolio broadly reflects our preference for growth visibility and
domestically focused plays in a still-strained global environment. We anticipate a
gradual recovery in earnings by FY26, and we marginally raise our weights in
domestic names. We discuss the key changes in our model portfolio below:
Our key Overweight (OW) sectors are Autos, Industrials, Healthcare, BFSI, and
Consumer Discretionary, while we are Underweight (UW) on Oil & Gas, Cement, and
Metals. We upgrade Automobiles to OW from Neutral. We have also made several
additions from a bottom-up standpoint across sectors.
FINANCIALS:
We retain our OW stance on the BFSI sector, with differentiation
among its sub-segments. We continue to prefer large private banks, holding the
highest OW position in ICICI Bank, followed by Kotak Bank, albeit we have
trimmed our allocations in both ICICI Bank and Kotak Bank by 100bp each. We
remain marginal OW on PSU banks, with only SBI representing this segment. We
are OW in diversified financials, reflecting our positive long-term outlook on this
theme. While maintaining our allocations to UTI AMC and Niva Bupa, we have
replaced Angel One with Max Financials, assigning a substantial allocation of
October 2025
7
 Motilal Oswal Financial Services
Reform. Resilience. Revelry!
Mastering the game!
300bp. We expect
Max Financials
to outperform in APE growth, product mix,
VNB margin, and RoEV over 2HFY26 and beyond, on the back of a favorable
outlook for the life insurance industry driven by GST rate cuts, interest rate cuts,
and a favorable base of 2HFY25. We project an APE/VNB CAGR of 18%/21%
during FY25-28E and consider the valuations attractive at FY27 P/EV of 1.9x.
CONSUMPTION:
We remain OW on Discretionary, our preferred long-term
theme in consumption, and maintain our UW stance on Staples. We have added
two more names to the Discretionary cohort, i.e., Indigo and V-Mart, with 300bp
and 100bp allocations, respectively. We have partially funded these additions by
replacing Jubilant Foodworks, while we have maintained allocations in Titan,
Radico Khaitan, Indian Hotels, and Page Industries at the same levels as last
quarter.
Indigo
is a key beneficiary of the surge in travel demand. It has demonstrated
resilience through cost control, strong network execution, and steady passenger
growth. Backed by early double-digit capacity growth, stable yields, a rising
international mix (currently ~30% of ASKs), and improving operating leverage
(from reduced damp leases and expanding wide-body routes), INDIGO is well-
positioned to sustain healthy profitability.
V-Mart
remains a formidable beneficiary of the unorganized-to-organized shift
and rising preference for one-stop shops, which provide a wider assortment at
competitive prices in Tier 2+ towns.
TECHNOLOGY:
We remain Neutral on Technology, within which we are UW on
IT services but OW on quick commerce, which offsets the services underweight.
Within IT services, we continue to prefer mid-cap players owing to their better
growth vs. the large-cap peers. Coforge and Hexaware are our key mid-cap IT
picks with unchanged allocation at 200bp. TechM is the sole large-cap IT name
in our portfolio. We have replaced HCL Tech by adding Swiggy to our model
portfolio with an allocation of 300bp.
Swiggy
is a beneficiary of improved execution and rising QC AOV, which
strengthens growth visibility while easing competition and moderating dark
store expansion, accelerating the path to breakeven.
AUTOMOBILES:
We upgrade Automobiles to OW from Neutral, as the
environment for the auto sector has improved materially over the past few
months, owing to a confluence of multiple enablers such as GST2.0
rationalization, interest rate cuts, higher personal disposable incomes, and
healthy rural demand. We have maintained our existing allocations of
400bp/300bp in M&M and TVS Motors, while adding Happy Forgings to the
portfolio with a 200bp weightage.
Happy Forgings
is our key preferred stock in the auto ancillary space, as it is
second order beneficiary of the expected demand revival at OEMs post-GST 2.0
rate rationalization. Happy Forging’s key customer segments in the domestic
market (CVs and tractors) have picked up in 2Q, holding potential for continued
strong growth. There is no material impact of US tariffs, as its US exposure is
below 3% of revenue, including indirect exports. The stock trades at a palatable
valuation of 27.4x 12-month forward earnings vs. the 10-year average of 34x.
INDUSTRIALS:
This sector remains one of our favorite themes. We maintain our
OW stance in this segment and retain our allocations and stock picks as in the
last quarter, with allocations to L&T, BEL, Ultratech, Dixon Technology, and
Kaynes. Among the sub-segments, we are very optimistic about EMS names, and
8
October 2025
 Motilal Oswal Financial Services
Reform. Resilience. Revelry!
Mastering the game!
hence, the sector is a key OW, as we see a continuation of super-normal growth
in this segment.
HEALTHCARE:
We retain our OW stance on Healthcare, albeit we have changed
the composition by replacing Sun Pharma with Lupin and assigned a 200bp
weightage. We have retained our allocations in Global Health and Dr. Agarwal’s
Health.
Lupin
is expected to post a continuation of strong earnings growth momentum
with expectations of 35%, 26%, and 42% YoY growth in 2Q, 3Q, and 4QFY26,
respectively. It has posted a strong sales growth in the US over the past 14
quarters. Further, LPC has a strong pipeline of products in the
inhalation/injectable space to sustain this growth momentum going forward.
Given its strong anti-diabetes franchise, LPC is gearing up for the launch of
semaglutide in India and is also scaling additional growth drivers in India,
including consumer health, diagnostics, and digital offerings for cardiac patients.
METALS/UTILITIES:
We continue to maintain our UW stance, with exposures
through Jindal Stainless and Suzlon Energy.
OTHERS:
We maintain our OW stance, which in a way signifies the growing
importance of newer, less prominent, and smaller themes. We have replaced
SRF and Macrotech Developers with Delhivery and VIP Industries in this
segment.
Delhivery
is a beneficiary of capacity additions through organic and inorganic
routes, market leadership position, increasing share of high-margin part-truck-
load (PTL) business, and cost efficiency driven by higher scale of operations.
VIP Industries
is now emerging from a strategic reset year with a cleaner
balance sheet, renewed brand investments, and meaningful cost efficiency
gains. We expect the refreshed strategy to be anchored around 1) augmenting
its supply chain efficiency, 2) enhancing employee productivity, 3) divesting low-
profitability brands, 4) expanding retail footprint to high-throughput locations,
and 5) realigning e-commerce discounting.
Note: Exhibit data is sourced from Bloomberg, Companies, and MOFSL research database
October 2025
9
 Motilal Oswal Financial Services
Corporate earnings at a glance: Defensives poised to aid earnings
Resilience. Revelry!
Reform.
growth
Mastering the game!
O&G is likely to lead the charge; excluding Financials, profits are anticipated to grow 16% YoY and 10% YoY for the MOFSL
Universe and Nifty, respectively.
BFSI and Auto would continue to lead, while contributions from Healthcare and Cement to improve
PAT expected to grow 9% YoY for
PAT likely to rise 16% YoY for the
PAT to grow 6% YoY for the MOFSL
the MOFSL Universe
MOFSL Universe, excluding Financials
Universe, sans Metals and O&G
MOFSL Universe
MOFSL Ex Financials
49 49
36
29
MOFSL Ex Metals and O&G
59
57
32
12
4
-4
13
16
33 32
37
24
23
18
15
11 10 9
9
6
21
2
6
11
3
0
6
6
6
10
11
9
-10
-8
-20
PAT growth for the Nifty Universe
anticipated to be only 6% YoY
Nifty Universe
25 24
19
PAT to grow 10% YoY for the Nifty
Universe (ex-Financials)
Nifty Ex Financials
24
21
PAT to grow 4% YoY for the Nifty
Universe (ex-Metals and O&G)
Nifty Ex Metals and O&G
57
16
12 12
15
8
9
6
5 6
6
1
2
7
12
36 33 33
10
8 8
5
2 2
10
26
18 17
11 9
8 7 10
4
Performance of the MOFSL Universe is likely to be driven by O&G, NBFC-Lending, and Telecom but would be weighed
down by Banks in 2QFY26
94 44
38
21
18 17 13
12
12
11
10
9
6
5
5
4
2
1
1
0
0
0
0
28
32
2,893
3,157
October 2025
10
 Motilal Oswal Financial Services
Corporate earnings at a glance:
O&G’s PAT contribution to rise sequentially
Reform. Resilience. Revelry!
Mastering the game!
O&G’s
PAT
contribution one-third share of total profits, though the sequential rise to dip from the highs of 40% in Sep’24
Financials to retain over to the MOFSL Universe shows some signs ofshare continues in 2QFY26, the highest in six quarters
O&G PAT (INRb)
21.6
17.9
13.8
15.1
15.9
15.2
12.5
13.0
21.2
O&G contribution to MOFSL universe PAT (%)
13.4
13.4
14.5
14.9
Financials to retain over one-third share of total profits, though the share continues to dip from the highs of 40% in Sep’24
BFSI PAT (INRb)
41
38
36
BFSI contribution to MOFSL universe PAT (%)
40
34
36
36
38
39
38
37
37
37
MOFSL (ex-OMC)’s
PAT share (%):
Defensives to drive 2QFY26 earnings
32 28
23 29
24
28
24
25
24
24
25
21
24
22
DEFENSIVES
22
23
23
22
22
22
24
21
21
23
22
23
21
24
21
21
21
24
20
24
20
23
36
35
33
33
32
33
GLOBAL CYCLICALS
42
42
44
43
54
54
DOMESTIC CYCLICALS
55
55
56
54
58
55
56
56
57
56
56
45 43
40
36
October 2025
11
 Motilal Oswal Financial Services
Reform. Resilience. Revelry!
Mastering the game!
MOFSL: MODEL PORTFOLIO
SECTOR WEIGHT /
PORTFOLIO PICKS
Financials
Private Banks
ICICI Bank
HDFC Bank
Kotak Mahindra Bank
PSU Bank
SBI
Diversified Financials
Max Financials
Shriram Finance
UTI AMC
Niva Bupa Health
Consumption / Retail
Titan Company
Indigo Aviation
Radico Khaitan
Indian Hotels
Page Industries
V-Mart
Technology
Tech Mahindra
Swiggy
Hexaware Tech.
Coforge
Auto
Mahindra & Mahindra
TVS Motor
Happy Forgings
Energy/Telecom
Reliance Industries
Bharti Airtel
Cap Goods, Infra & Cement
Larsen & Toubro
Bharat Electronics
UltraTech Cement
Healthcare
Lupin
Global Health
Dr Agarwals Health.
Metals / Utilities
Jindal Stainless
Suzlon Energy
EMS
Dixon Tech.
Kaynes Technology
Others
Delhivery
Supreme Inds.
VIP Inds.
TOTAL
BSE 100
34.2
23.3
6.9
10.4
2.2
3.5
2.6
7.5
0.0
0.6
0.0
0.0
13.8
1.0
0.9
0.0
0.5
0.0
0.0
9.5
0.6
0.0
0.0
0.4
7.8
2.2
0.6
0.0
12.5
6.6
3.7
8.8
3.1
1.1
1.0
4.3
0.3
0.0
0.0
7.4
0.0
0.5
0.5
0.5
0.0
1.2
0.0
0.0
0.0
100
MOFSL
WEIGHT
34.0
21.0
9.0
9.0
3.0
4.0
4.0
9.0
3.0
3.0
2.0
1.0
13.0
3.0
3.0
2.0
2.0
2.0
1.0
10.0
3.0
3.0
2.0
2.0
9.0
4.0
3.0
2.0
9.0
5.0
4.0
8.0
4.0
2.0
2.0
6.0
2.0
2.0
2.0
4.0
2.0
2.0
4.0
2.0
2.0
3.0
1.0
1.0
1.0
100
WEIGHT
RELATIVE
TO BSE100
-0.2
-2.3
2.1
-1.4
0.8
0.5
1.4
1.5
3.0
2.4
2.0
1.0
-0.8
2.0
2.1
2.0
1.5
2.0
1.0
0.5
2.4
3.0
2.0
1.6
1.2
1.8
2.4
2.0
-3.5
-1.6
0.3
-0.8
0.9
0.9
1.0
1.7
1.7
2.0
2.0
-3.4
2.0
1.5
3.5
1.5
2.0
1.8
1.0
1.0
1.0
EFFECTIVE SECTOR
STANCE
Neutral
Underweight
Buy
Buy
Buy
Neutral
Buy
Overweight
Buy
Buy
Buy
Buy
Neutral
Buy
Buy
Buy
Buy
Buy
Buy
Neutral
Buy
Buy
Buy
Buy
Overweight
Buy
Neutral
Buy
Underweight
Buy
Buy
Neutral
Buy
Buy
Buy
Overweight
Neutral
Buy
Buy
Underweight
Buy
Buy
Overweight
Buy
Buy
Overweight
Buy
Buy
Buy
PAT YoY / CAGR (%)
FY26E
FY27E
FY28E
FY25-
FY27
10
7
-5
2
27
12
7
-37
30
18
57
14
11
429
27
Loss
26
59
22
33
6
12
61
22
14
27
32
25
41
19
18
48
88
116
8
LP
12
12
15
19
18
18
21
16
133
19
11
28
22
15
64
28
Loss
16
28
19
20
24
10
40
19
20
34
2
25
38
23
78
59
62
25
34
288
18
17
16
22
18
11
19
18
93
19
12
23
11
13
47
12
Loss
15
23
13
16
32
10
32
19
19
21
3
21
53
10
6
31
48
33
20
45
18
11
11
6
10
22
17
11
21
24
15
42
18
13
195
27
Loss
21
43
21
27
15
11
50
21
17
31
16
25
39
21
45
53
74
64
21
LP
15
October 2025
12
 Motilal Oswal Financial Services
Reform. Resilience. Revelry!
Mastering the game!
MARKETS
Nifty-50: Remains positive in
CY25YTD
Nifty-50 YoY return (%)
29
15
24
12
3
3
A year of range-bound market movement…
…led
by robust DII flows, offsetting sharp FII outflows amid global volatility
20
4
9
4
-4
Nifty Midcap-100 remained nearly
flat
YoY return (%)
47
22
6 7
4
-4
-15
-1
46
47
24
Nifty Smallcap-100 underperforms
in CY25YTD
YoY return (%)
57
59
56
24
21
7 2
-10
-29
-14
-6
A range-bound market lacking a clear trend:
Indian equities have remained
broadly range-bound over the past year, posting only marginal gains in CY25YTD,
though they are slightly down from the
Sep’24 highs.
Heightened global tariff
headwinds, geopolitical uncertainties, and sharp FII selling were offset by strong
DII inflows, which helped prevent deeper drawdowns. Repeated tariff
announcements from Trump during the quarter, without resolution, contributed
to increased volatility following a recovery in 2QCY25. Although up 4% YTD, the
Nifty-50
closed 6% below its Sep’24 peak,
while the Nifty Midcap-100 and
Smallcap-100 declined 7% and 10% (down 1% and 6% YTD), respectively. Over
longer periods, the Nifty-50 has delivered a CAGR of 13%/17%/12% across 3-year,
5-year, and 10-year horizons.
India underperforms global peers in CY25:
Despite showing resilience, India
underperformed most major global markets in CY25YTD, many of which staged
sharper recoveries from a low CY24 base. South Korea (+50%), Brazil (+41%),
Germany (+36%), MSCI EM (+25%), the UK (+23%), France (+22%), Taiwan (+21%),
Japan (+20%), China (+19%), the US S&P500 (+14%), and Russia (+13%) all
outpaced India’s flat performance (0%)
in USD terms.
Mid- and small-cap outperformance narrows:
Following a strong 2023-24, mid- and
small-cap stocks have continued to underperform
since the Sep’24 highs and over
the past nine months. As of Sep’25, the Nifty Midcap-100
and Smallcap-100 indices
were down 7% and 10% from their all-time highs, while the Nifty-50 declined 6%.
Weak earnings and valuation concerns triggered a sharp sell-off in small-cap stocks,
while mid-caps delivered relatively stronger earnings growth, helping to moderate
their valuations. Nevertheless, small-cap valuations remain stretched, mid-caps
appear overvalued, and large-caps trade near their long-term averages.
DII flows set a record; FIIs remain net sellers:
DII inflows remain robust, aided
by resilient monthly SIP contributions of above USD3b and rising retail
participation. Record DII inflows of USD 66.7b in the first nine months of CY25
have already surpassed the total inflows for the entire CY24. Meanwhile, global
uncertainties, the
impact of Trump’s aggressive reciprocal
tariffs, and the start
of interest rate cuts have driven stronger FII flows in global markets (excluding
India), resulting in record net outflows of USD 17.5b from Indian equities. While
retail participation and DII momentum are expected to stay strong, geopolitical
developments, stable currency, and a recovery in domestic earnings will be key
factors shaping FII flows into India. Any progress or resolution regarding trade
tariffs could positively influence FII sentiments going forward.
October 2025
13
 Motilal Oswal Financial Services
Reform. Resilience. Revelry!
Mastering the game!
Exhibit 1:
Indian market remains range bound, the Nifty-50/Midcap-100/Smallcap-100 declined 6%/7%/9% YoY since Sep'24
27,500
25,811
25,500
24,611
24,256
Nifty-50 (down 6% YoY)
Nifty Midcap-100 (down 7% YoY)
Nifty Smallcap-100 (down 9% YoY)
(rebased to Nifty-50)
23,500
21,500
19,500
23,635
Exhibit 2:
Performance of global equity indices in USD terms (%): India underperforms global peers in CY25YTD
50
41
36
25
23
CY25YTD change (%)
22
21
20
19
14
13
0
South
Korea
Brazil
Germany MSCI EM
UK
France
Taiwan
Japan
China
S&P 500
Russia
MICEX
India -
Nifty
Exhibit 3:
Over the last 12 months, the global market cap has increased 15.6% (USD19.5t),
whereas India’s market cap has
declined 10% to USD5.1t
13.0
27
2.3
23
3.0
21
70.2
17
3.0
15
7.5
3.7
0.9
Mkt cap chg 12M (%)
0.8
5.1
Curr Mcap (USD Tr)
13
9
7
-1
-10
China
Korea
Taiwan
US
Germany
Japan
UK
Indonesia
Brazil
India
Exhibit 4:
Trend in India’s contribution to the global market cap (%) –
moderates from the
Mar’25
high and hovers around 3.5%
5.1
4.2
3.3
2.4
1.5
India's Contribution to World Mcap (%)
4.6
3.6
3.5
Average: 2.8%
1.6
October 2025
14
 Motilal Oswal Financial Services
Reform. Resilience. Revelry!
Mastering the game!
Exhibit 5:
FII registers the highest outflow in a year…
Net FII (USD b)
23.4
14.2
3.8
32.2
21.4
22.3
6.0
Exhibit 6:
…while
DII inflows continue to hit record highs
Net DII (USD b)
62.9
66.7
15.9
-0.8
-4.6
-17.0
12.1
-5.0
-17.5
Exhibit 7:
FII flows have weakened in the past three months
Net FII (USD b)
Exhibit 8:
DII flows have been robust for the last 26 months
Net DII (USD b)
Valuations for Nifty-50 above LPA, while broader markets remain elevated
Nifty is trading at a 12-month forward P/E of 20.6x, near its own LPA. We expect
FY26/FY27 EPS to grow 8%/16% to INR1,096/INR1,274.
India’s market cap-to-GDP
ratio has been volatile, dropping to 57% (of FY20
GDP) in Mar’20 from 80% in FY19. Since then, it has remained
above the long-
term average of 87%, reaching a multi-year
high of 146% in Sep’24. Following
the market correction and subsequent recovery, the ratio now stands at 125%.
We expect nominal GDP to grow 10.5% YoY in FY26 vs. 9.8% growth in FY25.
Exhibit 9:
Nifty-50 down 6% YoY but up 4% in CY25YTD; it is trading near to its LPA
29,000
23,000
Sep'15-25:
Nifty CAGR: 11.8%
Avg P/E: 20.7x
Nifty Index
Nifty P/E (x)
29.0
24,611
25.0
21.0
20.6
17.0
7,949
13.0
17,000
19.2
11,000
5,000
October 2025
15
 Motilal Oswal Financial Services
Reform. Resilience. Revelry!
Mastering the game!
Exhibit 10: The 12-month forward Nifty P/B (x)
4.1
3.5
2.9
10 Year Avg: 2.8x
2.3
1.7
12.2
10.5
Exhibit 11: The 12-month forward Nifty RoE (%)
17.3
3.1
15.6
13.9
10 Year Avg: 13.8
15.1
Exhibit 12:
Valuations, though below their peak, remain elevated for SMIDs, while aligning with averages for the Nifty-50
38
Mar'15-Mar-25 P/E(x)
Nifty-50 avg : 20.7x
Nifty Mid-cap 100 avg : 23.0x
Nifty Smallcap 100 avg : 16.6x
Nifty-50 P/E (x)
Nifty Midcap-100 P/E(x)
Nifty Smallcap- 100 PE (x)
32
26
Nifty50 trade at a premium
26.4
24.7
20.6
20
14
Nifty Mid-cap 100 and Nifty Small-cap 100 trade at a
premium to Nifty-50
8
Exhibit 13:
India’s market cap-to-GDP
ratio dips from the 17-year high levels of 146% in FY25, and stands at 125% in FY26YTD
GFC: Peak of 149% in Dec’07
Nominal GDP growth in FY25/FY26E:
9.8%/10.5%
Lowest since
the GFC
129 126 125
105
84
84
56
97
Average of 87% for the period
103 113
97
90
82
71
64
66
69
79
84
80
57
October 2025
16
 Motilal Oswal Financial Services
Reform. Resilience. Revelry!
Mastering the game!
2QFY26 PREVIEW
OMCs to drive earnings, while Private Banks to drag the same
MOFSL (ex-Commodities) earnings likely to grow 6% YoY
The
Auto
OEMs within our coverage universe are expected to deliver a 13% YoY
volume growth in 2QFY26 (after a weak 1Q).
Among the listed companies, 2W/CV
OEMs posted volume growth of 15%/10% in 2Q. Aggregate PV growth for the four listed
OEMs stood at just 3% YoY. For our OEM coverage universe (excl. TTMT), revenue is
likely to grow 13% YoY on the back of healthy volume growth. Similarly, excl. TTMT,
EBITDA/PAT for our coverage universe may decline by 13%/15% YoY. For auto ancillaries
under our coverage, we expect ~9% growth in revenue but a much slower 3% growth in
both EBITDA/PAT in 2QFY26.
Of the 18 major
sectors under
MOFSL Coverage,
only 10 are likely
to witness an
expansion in
EBITDA margin on
a YoY basis
BFSI:
We expect a weak (-1% YoY) adj. earnings growth for our BFSI universe, mainly
due to the weak performance of both Private Banks (-7% YoY) and PSBs (-7%), along
with flat earnings growth of NBFC Non-lending companies. NBFC lending (+21%)
and Insurance (+7%) are likely to post healthy earnings growth. We estimate NII for
our banking coverage universe will decline 0.9% YoY/1.8% QoQ, while PPoP is also
expected to dip 5.5% YoY/14% QoQ. For the private banks under our coverage, we
estimate PPoP to decline 2% YoY/18% QoQ. PSU banks’ PAT
is likely to dip 7.1% YoY
(-1.9% QoQ) in 2QFY26E, due to a contraction in NIM and moderation in treasury
gains for most PSBs. NII is likely to decline 2.5% YoY (-1.7% QoQ).
NBFCs:
We estimate ~14% YoY growth each in NII/PPoP in 2QFY26 for our NBFC
coverage universe, and PAT is expected to grow ~18% YoY (excl. Poonawalla).
Excluding NBFC-MFI and PFL, we estimate ~14% YoY growth in PAT for our
coverage
universe. We estimate loan growth of ~16% YoY/~4% QoQ as of Sep’25
for our coverage universe. AUM growth is estimated at ~12% YoY for our coverage
HFCs, including affordable and large HFCs. Vehicle financers (VFs) are projected to
report ~17% YoY AUM growth. Gold lenders (including non-gold products) are
likely to record ~29% YoY growth (primarily driven by ~44% YoY growth by
MUTH). NBFC-MFIs are estimated to post a decline of ~20% YoY in AUM, while
diversified lenders are expected to deliver ~24% YoY growth in AUM. Asset quality
stress persisted in the unsecured MSME and micro-LAP segments, with credit
costs anticipated to edge higher and deterioration in VFs to be mainly driven by
monsoon-related disruptions. However, asset quality was stable for HFCs and
power financiers with no material resolutions or incremental slippages in 2QFY26.
NBFC Non-lending:
We estimate the aggregate PAT of our Non-Lending
Financials Universe at INR138b, which reflects a modest 4% YoY increase but a
sharp 19% sequential decline. Within this, the capital market segment is
expected to post PAT of INR35b, largely flat on a YoY basis. Exchanges and
brokers are expected to post a modest 1% YoY decline in PAT (due to Angel
One). For AMCs, EBITDA is likely to rise 10% YoY, aided by robust AUM growth.
Intermediaries are likely to see a soft quarter, with PAT declining 9% YoY.
Wealth managers are likely to deliver the strongest performance within capital
market plays, with PAT growth of 9% YoY. While life insurance companies are
projected to deliver INR96b, reflecting healthy 7% YoY growth, their VNB
margins are likely to face some sequential pressure. In contrast, general
insurance players are likely to report INR8b, implying a 4% YoY decline.
The
Technology
sector (IT services companies) is expected to post a muted
quarter with no material improvement over the past quarter. We expect QoQ
growth in CC terms in the range of 0.3% to 2.4% for large-caps and -0.5% to
6.0% for mid-caps. We expect aggregate revenue for our coverage universe to
17
October 2025
 Motilal Oswal Financial Services
Reform. Resilience. Revelry!
Mastering the game!
Sectoral sales growth for the quarter-
ended
Sep’25
(YoY %)
EMS
Real Estate
Cement
Utilities
Telecom
Cap. Goods
Logistics
NBFC - Lending
Retail
Cons. Durables
Insurance
Healthcare
NBFC - Non Lending
Technology
Media
MOFSL Univ.
Consumer
Chemicals
Infra
Auto
Metals
Banks-PVT
Oil & Gas
Banks-PSU
Staffing
25
23
19
16
16
15
15
15
11
10
10
9
9
6
6
6
6
5
5
4
4
1
0
-3
-5
Sectoral PAT growth for the quarter-
ended Sep’25
(YoY %)
Telecom
Cement
EMS
Real Estate
Logistics
Oil & Gas
Cons. Durables
NBFC - Lending
Retail
Media
Cap. Goods
Staffing
Metals
Healthcare
MOFSL Univ.
Insurance
Technology
Auto
Utilities
Consumer
Chemicals
NBFC - Non…
Banks-PSU
Banks-PVT
Infra
LP
62
36
29
26
25
24
21
19
18
14
12
10
10
9
6
6
5
4
3
3
0
-7
-7
-8
grow by 6.0% YoY, while EBIT and PAT are likely to grow by 5.2% and 5.5% YoY
(all in INR terms), respectively.
The
Capital Goods
coverage companies are expected to report revenue growth
of 15% YoY, EBITDA growth of 11% YoY, and PAT growth of 14% YoY. Ordering
activity during the quarter remained strong yet selective, with traction seen
across defense, power T&D, renewables, thermal, hydrocarbon, and buildings &
factories segments. Although the sector has seen positive developments, a
broad-based revival in government and private capex is yet to be seen. We
maintain our view that valuation rerating for the sector is contingent upon a
broad-based capex revival.
The MOFSL
Consumer
universe is likely to deliver a modest revenue/EBITDA
growth during the quarter (staples: +5%/0%, paints & adhesives: +3%/+10%,
liquor: +9%/+10%, innerwear: +6%/+6%, QSR: +10%/-13%, and jewelry: +16%/
+24%).
Staple
companies are expected to see massive benefits from GST 2.0,
but the trade transition has been impacting primary growth in the interim. We
expect modest PAT growth of 2% YoY for staple companies in 2QFY26. The PAT
growth for the Paints/Liquor/Innerwear/QSR/Jewelry segments during the
quarter is estimated to be ~8%/13%/6%/-1%/29% YoY in 2QFY26.
The
Healthcare
companies under our coverage are expected to report a modest
Sales/EBITDA/PAT growth of 9%/8%/10% YoY in 2QFY26. The domestic
formulation (DF) segment growth is likely to moderate due to the GST transition.
Intensified competition in certain products is expected to curb YoY growth in the
US generics. Hospitals, however, remain on a robust growth path due to the
addition of beds and improvement in acquired units, driving 14.5% YoY EBITDA
growth for 2QFY26.
The
Metal
companies within our coverage universe are likely to report a modest
10% YoY earnings growth. Sales/EBITDA for the coverage to grow by 4% and
11% YoY. We expect
ferrous
companies to report a volume growth of 7% QoQ
(+11% YoY), which would be partially offset by a lower NSR of 7% QoQ and 5%
YoY, resulting in flat revenue QoQ (+6% YoY) in 2QFY26.
Non-ferrous
companies
under our coverage are expected to post an aggregate revenue and EBITDA
decline of 2% and 3% QoQ, respectively, mainly led by muted volumes.
We estimate our
Cement
coverage universe (ex-JSWC) to post 17%/52%/60%
YoY growth in revenue/EBITDA/PAT, albeit on a low base. Aggregate cement
volume is estimated to grow ~11% YoY to 92mt, aided by inorganic growth.
However, on a like-for-like basis, volume growth stood at ~5% YoY in 2QFY26.
Blended realization is estimated to grow ~5% YoY (down ~2% QoQ) to
INR5,446/t, led by pricing gains in Apr-May’25,
which partially declined in Jun-
Jul’25. We estimate EBITDA/t to rise ~40% YoY (down ~20% QoQ) to INR867.
Average EBITDA margin (ex-GRASIM) is estimated to expand 4.0pp YoY (contract
3.6pp QoQ) to ~16%. Cement prices, after witnessing a marginal correction in
Jun-Jul’25,
largely remained
stable in Aug-Sep’25,
despite
the intense monsoon
season. However, post-GST rate cuts, the cement players have passed on the full
benefits to the customers.
We expect the
O&G
sector to report flat sales YoY (+4% YoY excluding OMCs),
EBITDA growth of a 23% YoY rise in EBITDA (+9% YoY excluding OMCs), and a
25% YoY increase in PAT (+2% YoY excluding OMCs) in 2QFY26. In 2QFY26, crude
oil prices remained steady as oversupply and weak demand were balanced by
geopolitical risk and an
aggressive increase in China’s crude imports and
18
October 2025
 Motilal Oswal Financial Services
Reform. Resilience. Revelry!
Mastering the game!
stockpiling.
OMCs:
Standalone EBITDA for HPCL/BPCL/IOCL is expected to
decline QoQ due to contraction of marketing margins on a QoQ basis. SG GRM
averaged USD4.1/bbl in 2Q (vs. USD5.6/bbl in 1Q).
CGDs:
We estimate an
8%/7% YoY volume growth for MAHGL/IGL and a 1% YoY volume decline for
GUJGA. CGD margins are expected to decline sequentially as raw material costs
rise. Spot LNG prices remained elevated despite a sequential decline, averaging
around USD11.9/mmBtu in 2Q.
Upstream:
For ONGC and OINL, we expect O&G
sales volumes to remain largely flat both QoQ and YoY, while oil realizations are
likely to see a sharp YoY decline for both companies (flat QoQ).
The
Power Utility
companies under our coverage universe are anticipated to
report a revenue/EBITDA/Adj. PAT growth of 16%/17%/4% YoY in 2QFY26.
India’s overall power generation fell by 3.2% YoY in 2QFY26 to 448.7BUs
mainly
on account of softened demand due to a stronger-than-average monsoon.
However, the share of renewables in the generation mix improved to 21% from
17%. During Apr-May’25,
the country added a significant 7.9GW of renewable
capacity
largely solar
while 2.1GW of thermal capacity was added.
Retail:
2QFY26 is likely to be a steady quarter for retailers, with a boost from the
early festive season and GST rationalization offset by the transitory impact of GST
implementation in the wholesale channel and weather-related disturbances in
certain pockets. However, festive demand and GST cuts led to a pick-up in demand,
and retailers remain optimistic that demand revival will be sustained beyond the
festive season. We expect ~14% YoY aggregate revenue growth for our retail
coverage universe, with a more broad-based growth as several retailers are likely to
post double-digit revenue growth. Large retailers (DMart and Trent) continue to
deliver resilient 15%+ growth, value fashion retailers (VMM and V-Mart) continue to
outperform with 20%+ revenue growth, and footwear retailers are expected to see
modest growth recovery (+6% YoY in 2QFY26, vs. ~2% YoY decline in 1QFY26).
Telecom:
We expect the Telecom sector to report a profit of INR23b in 2QFY26
(vs. a loss of 15b in 2QFY25). We also project ~2% sequential growth in
combined wireless revenue/EBITDA for the three private telcos in 2QFY26. We
build in a ~1% sequential uptick in the blended ARPU for the three private
telcos. The subscriber net adds trend for the private telcos is expected to remain
stable QoQ. Given the consolidated market structure in the Indian telecom
industry, higher data consumption, lower ARPU, and inadequate returns
generated by telcos, we expect at least one more tariff reset. We continue to
build in a ~15% tariff hike (or INR50/month on the
base plan) in Dec’25.
The
Real Estate
coverage universe is expected to report strong presales of
INR275b in 2QFY26, up 19% YoY but down 38% QoQ due to seasonality impact.
Volumes are expected at 20msf, up 6% YoY and down 27% QoQ. Revenue
recognition for our coverage is expected to stand at INR172b (up 23% YoY), with
EBITDA of INR53b (up 44% YoY) and a margin of 31%. Adj. PAT is expected to rise
29% YoY to INR44b, with an adj. PAT margin of 26%.
The
Chemicals
sector is projected to report a third consecutive quarter of
earnings growth (albeit modest) at 3% YoY in 2QFY26 after seven consecutive
quarters of decline.
Brent crude prices averaged USD68/bbl in Sep’25 (vs.
67.9/bbl in Aug’25). Oil prices remained
stable MoM despite oversupply and
weak demand. This stability was established due to geopolitical risk and an
aggressive increase in China’s crude imports and stockpiling.
October 2025
19
 Motilal Oswal Financial Services
Reform. Resilience. Revelry!
Mastering the game!
The 2QFY26 snapshot:
We expect EBITDA/PBT/PAT to rise 8%/6%/9% YoY in
2QFY26 for the MOFSL Universe. Excluding Metals and O&G, EBITDA/PBT/PAT
for the MOFSL Universe would grow 5%/2%/6% YoY.
The
EBITDA margins
of the Cement, Consumer Durables, EMS, Infrastructure,
Logistics, Metals, O&G, Retail, Telecom, and Utilities sectors are likely to expand,
while EBITDA margins of the Automobile, Capital Goods, Chemicals, Consumer,
Healthcare, Media, Real Estate, and Technology sectors are anticipated to contract
on a YoY basis.
Nifty earnings to grow 6% YoY in 2QFY26:
Ex-Commodities, the Nifty earnings
are anticipated to rise ~4% YoY. Reliance Industries, Bharti Airtel, TATA Steel, JSW
Steel, and Bajaj Finance are likely to drive Nifty earnings, while ONGC, SBI, Axis
Bank, Tata Motors, and Hindalco are projected to drag the same.
The FY26E snapshot:
The MOFSL Universe and Nifty are likely to record 12% YoY
and 9% YoY earnings growth in FY26E, respectively. FY26 earnings, ex-Financials,
are projected to rise 15% YoY and 11% YoY. Barring Metals and O&G, FY26
earnings are likely to increase 11% and 9% YoY for the MOFSL Universe and
Nifty-50, respectively.
October 2025
20
 Motilal Oswal Financial Services
Reform. Resilience. Revelry!
Mastering the game!
Exhibit 14:
MOFSL and Nifty Universe to post 9% and 6% YoY earnings growth, respectively, in 2QFY26 (INR b)
Sales
Sector
Sep-25
PAT growth sectors
10,543
Telecom (5)
787
Others (26)
795
Cement (12)
607
EMS (7)
192
Real Estate (14)
172
Logistics (9)
204
Oil & Gas (14)
7,088
Consumer Durables (5)
184
NBFC - Lending (24)
515
Med/Low growth sectors
15,221
Retail (24)
684
Media (3)
48
Capital Goods (15)
1,154
Staffing (4)
114
Metals (11)
2,932
Healthcare (27)
959
Insurance (8)
2,049
Technology (16)
2,133
Automobiles (26)
3,173
Utilities (8)
847
Consumer (21)
952
Chemicals (13)
177
PAT de-growth sectors
1,895
NBFC - Non Lending (15)
81
Banks-PSU (6)
861
Banks-Private (12)
916
Infrastructure (3)
37
MOFSL Universe (328)
27,659
MOFSL Ex OMCs (325)
23,989
MO Ex Metals and O&G (303) 17,639
MOFSL Ex. Financials
23,238
Nifty (48)
14,036
Sensex (30)
10,799
Growth (%)
YoY
QoQ
5
-4
16
2
15
5
19
-10
25
3
23
16
15
2
0
-6
10
-8
15
2
7
3
11
2
6
5
15
14
-5
5
4
-3
9
3
10
15
6
4
4
-1
16
6
6
-2
5
4
0
-2
9
5
-3
-2
1
-2
5
-15
6
0
7
2
9
3
6
-1
7
1
7
1
EBITDA
Sep-25
2,123
400
105
85
10
53
70
958
19
423
2,425
73
10
143
3
526
228
59
473
375
290
211
32
1,328
42
601
675
11
5,876
5,646
4,393
4,077
3,631
2,961
Growth (%)
YoY
QoQ
22
-2
20
2
17
-16
55
-28
31
1
44
47
17
-1
23
-4
28
-3
14
8
6
1
11
-3
1
11
11
18
-20
15
11
-10
8
1
-1
41
6
5
-4
-1
17
9
2
-5
5
-2
-5
-14
4
6
-9
-9
-2
-18
7
-12
8
-4
6
-3
5
-3
13
-2
8
-4
8
-3
PAT
Sep-25
914
23
24
35
5
44
42
470
13
256
1,439
30
7
97
2
224
141
104
327
233
105
149
18
805
35
365
401
3
3,157
3,051
2,463
1,997
1,943
1,579
Growth (%) PAT Delta PAT
Delta
YoY
QoQ
INRb Share (%)Share (%)
33
-1
229
29
87
LP
44
38
1
14
228
-43
17
1
6
62
-29
13
1
5
36
7
1
0
1
29
30
10
1
4
26
-2
9
1
3
25
-1
94
15
36
24
-5
2
0
1
21
5
44
8
17
7
-5
95
46
36
19
-2
5
1
2
18
15
1
0
0
14
16
12
3
5
12
20
0
0
0
10
-21
21
7
8
10
0
12
4
5
6
-23
6
3
2
6
2
18
10
7
5
2
11
7
4
4
1
4
3
2
3
-5
5
5
2
3
-4
0
1
0
-7
-5
-60
25
-23
0
-4
0
1
0
-7
-2
-28
12
-11
-7
-7
-32
13
-12
-8
-27
0
0
0
9
-4
264
100
100
6
-2
178
6
-2
150
16
-3
274
6
-3
104
8
-1
111
October 2025
21
 Motilal Oswal Financial Services
Reform. Resilience. Revelry!
Mastering the game!
Exhibit 15:
Expect a two-year PBT/PAT CAGR of 3%/4% for the MOFSL Universe (INR b)
PBT (INR b)
Sector
Automobiles (26)
Capital Goods (15)
Cement (12)
Chemicals (13)
Consumer (21)
Consumer Durables (5)
EMS (7)
Financials (65)
Banks-Private (12)
Banks-PSU (6)
Insurance (8)
NBFC - Lending (24)
NBFC - Non-Lending (15)
Healthcare (27)
Infrastructure (3)
Logistics (9)
Media (3)
Metals (11)
Oil & Gas (14)
Oil Ex OMCs (11)
Real Estate (14)
Retail (24)
Staffing (4)
Technology (16)
Telecom (5)
Utilities (8)
Others (26)
MOFSL Universe (328)
MO Ex Metals and O&G (303)
MOFSL Ex OMCs (325)
Nifty (48)
Sensex (30)
Sep-23 Sep-24 Jun-25 Sep-25 YoY
302
102
58
24
195
13
3
1,339
527
411
102
270
28
143
6
34
12
264
846
494
24
33
2
381
-1
119
33
3,933
2,823
3,581
2,368
1,887
311
124
30
24
193
15
8
1,538
564
539
107
282
46
173
6
41
8
305
523
492
30
33
2
421
31
133
17
3,967
3,139
3,936
2,557
2,067
304
123
72
25
210
19
7
1,600
542
543
153
315
47
184
6
49
8
404
672
458
41
42
2
431
71
141
53
4,465
3,388
4,251
2,741
2,221
309
-1
140
13
48
61
24
3
199
3
18
22
8
2
1,418 -8
533
-6
493
-9
16
-85
331
18
45
-1
188
9
5
-23
51
23
9
16
329
8
660
26
518
5
51
67
40
23
3
10
442
5
79
153
140
5
38
119
4,199 6
3,209 2
4,056 3
2,686 5
2,208 7
Growth (%)
Two-year
QoQ
CAGR
1
1
17
14
-9
-34
1
-2
1
-5
17
-5
65
5
3
-11
1
-2
9
-9
-60
-89
11
5
26
-3
15
2
-9
-26
22
4
-11
10
12
-19
-12
-2
2
13
46
24
10
-4
12
28
8
2
LP
12
9
0
7
-29
3
-6
7
-5
6
-5
7
-2
8
-1
PAT (INR b)
Sep-23 Sep-24 Jun-25 Sep-25 YoY
221
72
42
19
145
9
2
1,031
409
294
98
207
22
110
3
29
8
198
614
348
19
25
2
282
-40
84
25
2,899
2,088
2,634
1,728
1,361
222
85
22
18
145
10
4
1,171
433
393
98
212
35
129
4
33
6
204
376
356
34
25
2
309
-15
100
7
2,893
2,313
2,873
1,838
1,468
229
84
50
19
157
14
5
1,216
430
372
134
243
36
141
5
43
6
283
474
312
34
31
2
321
16
104
43
3,276
2,519
3,114
1,997
1,602
233
5
97
14
35
62
18
3
149
3
13
24
5
36
1,161 -1
401
-7
365
-7
104
6
256
21
35
0
141
10
3
-8
42
26
7
18
224
10
470
25
364
2
44
29
30
19
2
12
327
6
23
LP
105
4
24
228
3,157 9
2,463 6
3,051 6
1,943 6
1,579 8
Growth (%)
Two-year
QoQ
CAGR
3
2
17
16
-8
-29
-1
-4
2
-5
18
-5
56
7
6
-5
-1
-7
11
-2
3
-23
11
5
26
-4
13
0
2
-27
20
-2
-6
15
6
-21
-12
-1
2
17
51
30
11
-2
10
20
8
2
Loss
44
12
1
0
-43
4
-4
9
-2
8
-2
6
-3
8
-1
Sales/PAT for the MOFSL Universe to grow 6%/9% YoY in 2QFY26
Exhibit 16:
Expect sales for the MOFSL Universe to grow 6%
YoY in 2QFY26
Exhibit 17: Expect MOFSL Universe earnings to grow 9% YoY
in
2QFY26
3
October 2025
22
 Motilal Oswal Financial Services
Reform. Resilience. Revelry!
Mastering the game!
Exhibit 18: Expect EBITDA margin (ex-Financials and OMCs)
to expand 40bp YoY to 19.7% in 2QFY26
Average: 20.3%
Exhibit 19: Expect PAT margin (ex-Financials and OMCs) to
expand 30bp YoY to 9.7% during the quarter
Average: 9.9%
Source: MOFSL, excluding Financials and OMCs
Exhibit 20:
O&G, NBFC-Lending, and Telecom to lead, while Banks, Infra, and NBFC Non-Lending to drag earnings in 2QFY26
94 44
38 21 18 17 13 12
12 11 10 9
6
5
5
4
2 1
1
0
0
0
0
28 32
2,893
3,157
Exhibit 21:
Quarterly sectoral PAT trend (INR b)
MOFSL Universe to report a 9% YoY growth in PAT in 2QFY26E
Sector
Automobiles
Banks-Private
Banks-PSU
Insurance
NBFC - Lending
NBFC
Non- Lend
Capital Goods
Cement
Chemicals
Consumer
Consumer Durables
EMS
Healthcare
Infrastructure
Logistics
Media
Metals
Oil & Gas
Real Estate
Retail
Staffing
Technology
Telecom
Utilities
Others
MOFSL Universe
Sep-22 Dec-22 Mar-23 June-23 Sep-23 Dec-23 Mar-24 June-24 Sep-24 Dec-24 Mar-25 June-25 Sep-25E
97
142
186
187
221
240
261
237
222
236
283
229
233
301
338
369
363
409
414
436
427
433
420
410
430
401
226
252
300
307
294
306
379
347
393
378
412
372
365
178
83
158
113
98
112
159
127
98
134
214
134
104
150
163
184
188
207
205
226
215
212
215
235
243
256
19
17
18
21
22
23
27
31
35
31
31
36
35
54
58
99
54
72
70
134
71
85
86
144
84
97
20
24
38
44
42
50
51
32
22
21
50
50
35
24
22
25
20
19
16
15
17
18
13
18
19
18
128
132
135
149
145
149
144
154
145
141
143
157
149
7
9
11
10
9
9
13
14
10
11
18
14
13
2
2
4
2
2
2
4
3
4
4
7
5
5
98
89
81
99
110
106
118
126
129
130
138
141
141
4
4
5
5
3
4
5
4
4
4
6
5
3
24
21
28
27
29
32
31
34
33
37
41
43
42
5
6
3
6
8
6
4
6
6
7
5
6
7
143
137
250
234
198
245
216
273
204
252
311
283
224
294
339
516
621
614
463
487
370
376
415
472
474
470
15
20
32
18
19
22
38
30
34
35
41
34
44
22
27
16
22
25
33
21
24
25
38
24
31
30
2
2
2
2
2
2
1
2
2
2
2
2
2
267
289
292
276
282
291
299
301
309
318
320
321
327
-41
-58
-19
-29
-40
-32
-25
-17
-15
12
5
16
23
83
89
101
87
84
98
107
94
100
104
116
104
105
10
47
50
54
25
46
43
41
7
55
65
43
24
2,128 2,252 2,884 2,877 2,899 2,911 3,196 2,963 2,893 3,100 3,510 3,276 3,157
October 2025
23
 Motilal Oswal Financial Services
Reform. Resilience. Revelry!
Mastering the game!
Expect earnings of Nifty constituents to rise 6% YoY in 2QFY26
We expect sales/EBITDA/PBT/PAT for Nifty constituents to improve 7%/8%/
5%/6% YoY.
Reliance Industries, Bharti Airtel, TATA Steel, JSW Steel, and Bajaj Finance are likely
to drive Nifty earnings, while ONGC, SBI, Axis Bank, Tata Motors, and Hindalco are
projected to drag the same.
Thirteen Nifty companies are likely to report a PAT growth of above 15% YoY.
Whereas 13 Nifty companies are expected to report a YoY decline in PAT.
Exhibit 22:
Sector-wise PAT breakdown for the Nifty constituents in 2QFY26E (YoY %)
66
Telecom, Cement
and Logistics are
likely to lead Nifty
earnings in 2QFY26
30
28
22
22
17
11
6
6
6
5
5
4
2
1
-3
-9
Loss
Exhibit 23:
Expect Nifty’s revenue to
grow 7% YoY in 2QFY26
Exhibit 24:
Expect Nifty’s EBITDA to grow 8% YoY
Exhibit 25:
Expect Nifty’s
PAT to rise 6% YoY
Exhibit 26:
Nifty’s
EBITDA margin to expand to 21.1% YoY
Average: 21.5%
October 2025
24
 Motilal Oswal Financial Services
Reform. Resilience. Revelry!
Mastering the game!
Exhibit 27:
Nifty’s earnings snapshot
for 2QFY26E (INR b)
Sales
Growth (%) EBITDA Growth (%)
PAT
Growth (%)
Contribution to PAT
Company
Sector
Sep-25
YoY QoQ Sep-25 YoY
QoQ Sep-25
YoY
QoQ
(%)
growth (%)
Bajaj Auto
Automobiles
147
11.8 16.6
29
10.7
18.3
24
9.0
15.2
1.2
1.9
Eicher Motors
Automobiles
61
42.6 20.6
16
42.9
29.2
14
31.1
19.7
0.7
3.3
Mahindra & Mahindra Automobiles
329
19.5
-3.4
46
16.9
-5.5
43
11.8
24.5
2.2
4.3
Maruti Suzuki
Automobiles
384
3.2
0.0
40
-9.5
0.1
33
8.1
-10.6
1.7
2.4
Tata Motors
Automobiles
926
-8.8 -11.3
78
-33.9 -20.2
23
-31.4
-42.2
1.2
-10.1
Axis Bank
Banks-Private
132
-2.3
-2.9
103
-3.4 -10.1
55
-20.0
-4.7
2.8
-13.3
HDFC Bank
Banks-Private
308
2.3
-2.0
254
2.8
-28.9
167
-0.5
-7.8
8.6
-0.9
ICICI Bank
Banks-Private
211
5.5
-2.3
173
3.6
-7.5
119
1.7
-6.5
6.1
1.9
Kotak Mahindra Bank Banks-Private
73
4.2
0.8
53
4.5
-4.2
33
-2.3
-0.4
1.7
-0.7
State Bank
Banks-PSU
406
-2.5
-1.2
269
-8.0 -11.8
167
-9
-12.7
8.6
-15.4
HDFC Life Insur.
Insurance
191
13.1 28.7
10
9.2
26.6
5
9.7
-13.1
0.2
0.4
SBI Life Insurance
Insurance
235
15.2 32.0
16
8.9
44.9
5
2.7
-8.5
0.3
0.1
Bajaj Finance
NBFC - Lending
108
21.7
5.1
89
21.2
4.3
49
21.8
2.6
2.5
8.4
Bajaj Finserv
NBFC - Lending
332
19.9 15.8
95
20.3
1.5
29
36.9
2.3
1.5
7.4
Shriram Finance
NBFC - Lending
60
10.7
4.8
44
10.7
5.2
22
5.8
1.6
1.1
1.2
Bharat Electronics
Capital Goods
53
14.7 19.0
14
3.8
16.2
11
2.4
15.3
0.6
0.3
Larsen & Toubro
Capital Goods
715
16.2 12.3
70
9.8
10.6
39
14.3
7.3
2.0
4.7
Grasim Industries
Cement
92
21.0
0.0
3
-1.6 -16.8
8
2.6
LP
0.4
0.2
Ultratech Cement
Cement
185
18.2 -13.2
31
51.8 -30.6
13
56.2
-43.2
0.7
4.4
Asian Paints
Consumer
81
1.0
-9.3
14
9.0
-16.9
9
3.8
-18.8
0.5
0.3
Hind. Unilever
Consumer
163
2.1
-1.5
36
-3.8
-1.9
26
-1.8
1.1
1.3
-0.5
ITC
Consumer
217
4.6
0.9
69
2.1
1.2
53
5.6
0.6
2.7
2.7
Nestle
Consumer
54
5.3
5.4
12
0.3
6.9
7
-6.2
13.0
0.4
-0.5
Tata Consumer
Consumer
48
13.6
0.2
6
1.2
4.4
4
-3.0
11.7
0.2
-0.1
Apollo Hospitals
Healthcare
61
9.8
5.0
9
9.1
4.5
4
15.5
1.0
0.2
0.6
Cipla
Healthcare
73
4.0
5.4
18
-3.2
2.7
13
0.6
0.9
0.7
0.1
Dr Reddy’ s Labs
Healthcare
86
6.7
0.1
20
-8.4
-6.2
13
-1.1
-5.1
0.7
-0.1
Max Healthcare
Healthcare
26
22.7
6.0
7
16.4
7.0
4
17.6
17.4
0.2
0.6
Sun Pharma
Healthcare
140
5.9
1.9
40
5.0
-0.8
30
4.2
1.1
1.6
1.2
Adani Ports
Logistics
87
22.5
-5.2
52
19.5
-5.0
32
28.3
-6.1
1.6
6.7
Coal India
Metals
299
-2.6 -16.6
85
18.6 -23.7
63
-0.6
-28.5
3.2
-0.3
Hindalco
Metals
637
9.5
-0.8
75
-5.3
-5.6
36
-14.8
-9.2
1.9
-6.1
JSW Steel
Metals
431
8.5
-0.2
64
18.4 -15.0
15
140.3
-29.1
0.8
8.7
Tata Steel
Metals
568
5.4
6.8
85
54.5
14.9
28
514.9
30.2
1.4
22.3
ONGC
Oil & Gas
325
-4.1
1.5
185
1.6
-0.7
100
-16.5
24.8
5.2
-18.9
Reliance Inds.
Oil & Gas
2,467
6.5
1.3
458
17.2
6.7
202
22.1
11.9
10.4
35.0
Titan Company
Retail
164
12.6
-1.0
18
20.0
0.0
12
23.6
5.5
0.6
2.1
Trent
Retail
48
18.0
-0.4
8
19.7
-8.5
4
1.9
2.1
0.2
0.1
HCL Technologies
Technology
316
9.6
4.3
65
1.6
7.2
43
2.7
13.1
2.2
1.1
Infosys
Technology
444
8.2
4.9
107
8.5
6.6
72
10.2
3.5
3.7
6.3
TCS
Technology
654
1.8
3.1
173
3.1
2.5
126
5.0
-2.1
6.5
5.7
Tech Mahindra
Technology
139
4.1
3.8
21
18.8
7.5
13
4.7
14.8
0.7
0.6
Wipro
Technology
228
2.4
3.1
45
0.4
3.9
31
-2.2
-5.8
1.6
-0.7
Bharti Airtel
Telecom
511
23.1
3.2
287
31.3
3.0
65
66.1
9.2
3.3
24.8
NTPC
Utilities
453
12.4
6.5
118
22.4
15.2
44
3.9
-1.1
2.2
1.6
Power Grid Corp.
Utilities
107
4.2
7.7
92
4.9
13.6
37
6.2
7.0
1.9
2.1
Eternal
Others
81
68.0 12.5
3
39.3 173.8
3
70.3 1,099.0 0.2
1.2
Interglobe Aviation Others
183
7.9
-10.6
26
8.5
-54.6
-7
Loss
PL
-0.3
3.1
Nifty Universe
14,036
7.0
1.5
3,631
7.8
-4.2
1,943
5.7
-2.7
100
100
Note: For Banks: Sales = Net Interest Income, EBITDA = Operating Profits; For Life Insurance: Sales = Net Premium, EBITDA = VNB.
October 2025
25
 Motilal Oswal Financial Services
Reform. Resilience. Revelry!
Mastering the game!
Exhibit 28:
Expect a 14% PAT CAGR for the MOFSL Universe over FY25-27
Sales
EBITDA
EBITDA
PAT Grw /
PAT Delta
PAT (INR b)
CAGR (%) CAGR (%)
Margin (%)
CAGR (%)
Share (%)
Sector
(FY25-27) (FY25-27) FY26E FY27E FY28E FY26E FY27E FY28E FY26E FY27E FY28E (FY25-27) (FY25-27)
High PAT CAGR (>25%)
17
20
23.6 23.9 24.3 1,061 1,515 2,012 58
43
33
50
21
Telecom (5)
12
14
51.4 51.5 52.2
118
261
442
LP
121
69
LP
7
EMS (7)
41
44
6.1
6.3
6.9
27
42
58
54
55
38
54
1
Others (26)
19
25
17.2 18.6 19.4
242
368
487
37
52
32
44
5
Cement (12)
13
29
16.4 18.2 19.0
234
303
366
38
29
21
34
3
Infrastructure (3)
16
21
29.8 31.2 32.2
23
30
39
29
31
27
30
0
Real Estate (14)
23
30
30.6 30.9 31.4
194
231
289
38
19
25
28
2
Retail (24)
16
19
11.2 11.4 11.5
139
174
212
28
25
22
27
2
Chemicals (13)
11
20
19.4 21.2 21.5
82
105
119
23
28
13
25
1
Medium PAT CAGR (15-25%)
11
15
20.9 21.5 21.9 2,449 2,940 3,338 18
20
14
19
22
Logistics (9)
15
18
35.0 35.3 35.4
180
214
248
23
19
16
21
2
Staffing (4)
11
16
3.0
3.1
3.2
10
11
13
25
17
13
21
0
Metals (11)
8
15
19.6 20.6 21.0 1,214 1,491 1,644 17
23
10
20
11
Capital Goods (15)
16
18
13.5 13.8 14.0
469
551
668
21
18
21
19
4
Consumer Durables (5)
13
19
10.6 11.1 11.4
62
75
90
17
21
20
19
1
Utilities (8)
13
15
36.1 36.4 37.5
514
597
675
17
16
13
16
4
Low PAT CAGR (<15%)
4
10
22.0 23.1 24.6 10,760 12,222 13,986 8
14
14
11
57
Healthcare (27)
11
12
24.1 24.4 24.4
580
665
761
11
15
14
13
4
Financials (68)
11
12
45.2 46.1 48.1 5,334 6,289 7,458
7
18
19
12
33
Banks-PVT (12)
11
12
77.9 76.5 77.8 1,853 2,223 2,664
4
20
20
12
11
Banks-PSU (6)
9
8
70.2 69.4 70.8 1,608 1,866 2,192
1
16
17
8
7
Insurance (8)
10
16
10.0 10.7 11.3
609
677
747
6
11
10
9
3
NBFC - Lending (27)
18
18
80.2 81.0 82.1 1,117 1,350 1,652 23
21
22
22
11
NBFC - Non Lending (15)
14
16
53.5 54.8 55.9
146
173
203
15
19
17
17
1
Consumer (21)
10
10
22.9 23.4 23.5
632
721
796
9
14
10
11
4
Auto (26)
10
9
11.9 12.9 13.5
987 1,198 1,420
1
21
19
11
6
Media (3)
7
9
21.1 21.1 21.3
27
29
32
13
8
11
10
0
Technology (16)
7
8
22.2 22.8 22.9 1,335 1,448 1,546
7
8
7
8
5
Oil & Gas (14)
-3
7
12.8 13.1 14.0 1,866 1,872 1,973 13
0
5
7
6
Ex OMCs (11)
-1
7
17.9 18.6 19.3 1,405 1,519 1,615
5
8
6
7
5
MOFSL (331)
7
12
22.0 22.9 24.0 14,270 16,677 19,336 12
17
16
14
100
MOFSL Ex OMCs (328)
9
13
24.1 25.0 25.9 13,809 16,324 18,978 11
18
16
15
NA
Nifty (50)
7
12
26.5 27.4 28.5 8,707 10,093 11,572 9
16
15
13
NA
Sensex (30)
9
12
28.5 29.4 30.5 6,917 8,095 9,397 10
17
16
14
NA
Note: For Banks, sales represent net interest income, and EBITDA represents operating profit; Sensex and Nifty Numbers are free float
October 2025
26
 Motilal Oswal Financial Services
Reform. Resilience. Revelry!
Mastering the game!
Exhibit 29:
Upgrades/downgrades for the Nifty-50 in 2QFY26E Preview vs. 1QFY26 review
(INR)
ONGC
Eicher Motors
Eternal
Power Grid Corp.
Bharti Airtel
Tata Steel
Bajaj Auto
Mahindra & Mahindra
Titan Company
ICICI Bank
Hind. Unilever
Nestle
Maruti Suzuki
Infosys
Kotak Mahindra Bank
Dr Reddy’ s Labs
Larsen & Toubro
Adani Ports
Bharat Electronics
HDFC Bank
Reliance Inds.
Cipla
Sun Pharma
ITC
Bajaj Finance
TCS
Tata Consumer
Shriram Finance
Tech Mahindra
Hindalco
Grasim Industries
Wipro
Apollo Hospitals
Axis Bank
HCL Technologies
Max Healthcare
State Bank
Asian Paints
Trent
NTPC
HDFC Life Insur.
Coal India
Tata Motors
JSW Steel
SBI Life Insurance
Ultratech Cement
Interglobe Aviation
Nifty (50)
FY25
30.6
172.7
0.6
16.7
30.3
3.4
299.5
98.7
42.3
66.8
44.3
16.0
443.9
63.8
111.3
67.3
106.8
50.2
7.2
44.0
51.5
62.8
47.1
16.0
27.0
134.2
14.0
44.0
47.9
74.8
74.1
12.5
100.6
85.3
63.9
15.1
86.9
42.5
43.2
20.8
8.4
57.4
63.2
15.6
24.1
207.6
188.1
1,014
Current EPS (INR)
FY26E
31.0
192.1
1.3
18.7
48.9
8.9
329.0
120.7
55.1
73.1
46.1
16.9
490.2
68.7
105.4
67.0
130.5
62.7
8.2
47.1
57.6
61.7
51.1
17.0
32.9
141.8
16.7
49.4
60.7
69.2
85.1
12.5
126.7
79.2
65.9
18.7
87.4
44.2
49.7
24.8
9.4
54.7
41.9
44.6
24.8
264.2
222.1
1,096
FY27E
32.0
213.0
4.5
19.8
65.3
13.0
362.1
143.7
65.5
82.1
52.4
19.7
607.4
72.5
125.7
63.1
155.1
73.1
9.8
54.3
63.2
65.7
59.5
18.7
42.6
150.2
19.9
59.9
77.5
74.0
105.5
12.9
152.2
99.6
72.8
24.3
101.1
51.8
57.8
28.2
10.5
59.9
54.5
72.4
26.6
354.0
246.4
1,274
EPS UPGRADE /
DOWNGRADE (%)
FY26E
FY27E
9.8
7.6
7.3
9.0
5.7
14.5
4.2
3.6
3.1
2.1
2.6
0.2
2.0
0.4
1.1
5.1
1.0
2.1
0.7
-2.7
0.5
1.7
0.3
1.6
0.3
12.7
0.2
-0.1
0.2
-1.1
0.1
0.0
0.0
0.0
0.0
0.0
0.0
0.0
-0.1
-4.6
-0.1
-0.4
-0.1
-0.1
-0.1
-2.7
-0.3
0.4
-0.5
0.5
-0.7
-1.6
-0.7
0.6
-0.8
0.0
-1.0
-1.1
-1.1
1.8
-1.1
-1.3
-1.3
-1.8
-1.3
-7.5
-1.6
-1.7
-1.7
-4.1
-1.9
0.0
-2.2
0.0
-2.6
-4.2
-3.1
-5.0
-3.8
0.5
-4.2
-8.0
-5.2
-11.0
-8.4
5.1
-9.0
-3.6
-10.2
-17.2
-13.6
-7.5
-17.6
-5.9
-1.1
-1.7
EPS GROWTH (%)
FY26E
1.4
11.3
112.9
12.2
61.4
164.0
9.9
22.3
30.4
9.5
4.0
5.9
10.4
7.7
-5.2
-0.5
22.2
24.9
13.6
7.0
11.9
-1.7
8.5
6.6
21.8
5.6
19.3
12.4
26.7
-7.6
14.8
-0.3
26.0
-7.1
3.1
23.6
0.5
4.1
15.2
19.3
12.2
-4.6
-33.7
186.3
2.8
27.3
18.1
8.1
FY27E
3.1
10.9
256.2
5.8
33.5
46.4
10.1
19.0
18.8
12.3
13.6
16.4
23.9
5.5
19.2
-5.8
18.9
16.6
19.6
15.3
9.7
6.6
16.3
9.6
29.4
6.0
18.9
21.2
27.6
7.0
24.0
3.4
20.2
25.7
10.5
30.1
15.7
17.3
16.1
13.7
12.0
9.4
30.1
62.4
7.2
34.0
10.9
16.2
October 2025
27
 Motilal Oswal Financial Services
Reform. Resilience. Revelry!
Mastering the game!
Exhibit 30:
Absolute change in FY26E PAT for Nifty constituents (INR b)
Exhibit 31:
Absolute change in FY27E PAT for Nifty constituents (INR b)
October 2025
28
 Motilal Oswal Financial Services
Reform. Resilience. Revelry!
Mastering the game!
Exhibit 32:
Nifty performance
Expect FF PAT CAGR (FY25-27E) at 13%
Sales
CAGR %
25-27
High PAT Growth (20%+)
15
Eternal
66
JSW Steel
12
Tata Steel
8
Bharti Airtel
16
Bajaj Finserv
32
Ultratech Cement
13
Tech Mahindra
6
Max Healthcare
21
Bajaj Finance
24
Titan Company
16
Apollo Hospitals
14
Adani Ports
16
Mahindra & Mahindra
16
Larsen & Toubro
15
Medium PAT Growth (0-20%)
5
Grasim Industries
16
Tata Consumer
9
Maruti Suzuki
12
Shriram Finance
17
Bharat Electronics
17
NTPC
8
Trent
18
Interglobe Aviation
12
Sun Pharma
10
HDFC Life Insur.
16
ICICI Bank
13
HDFC Bank
11
Eicher Motors
15
Nestle
10
Reliance Inds.
4
Asian Paints
7
Bajaj Auto
11
State Bank
9
Power Grid Corp.
7
Hind. Unilever
8
Axis Bank
9
ITC
8
Infosys
7
HCL Technologies
7
Kotak Mahindra Bank
11
TCS
4
SBI Life Insurance
15
Cipla
7
ONGC
-8
Coal India
7
Wipro
4
Jio Financial
0
Adani Enterprises
0
PAT de-growth (<0%)
7
Hindalco
5
Dr Reddy’ s Labs
7
Tata Motors
8
Nifty (PAT free float)
7
Company
EBITDA Margin (%)
FY25
23
3
14
12
54
73
17
13
27
83
10
14
60
15
10
28
4
14
12
74
29
29
16
26
27
80
83
82
25
24
17
18
20
66
85
24
77
34
24
22
87
26
7
26
15
33
20
189
15
13
13
26
13
25
FY26E
25
4
18
15
57
68
19
15
26
82
11
15
60
15
10
30
4
14
11
74
28
31
17
27
28
80
84
90
25
24
19
18
20
66
85
23
79
33
24
21
74
27
7
24
18
33
20
189
15
11
12
24
9
26
FY27E
26
8
20
16
57
64
21
17
27
82
11
15
61
15
11
31
6
15
12
75
28
32
16
28
29
80
84
84
26
24
20
18
20
66
84
24
80
34
24
21
74
27
7
24
19
34
20
189
15
12
13
23
11
27
EBITDA
CAGR %
FY28E
25-27
27
22
12
159
21
35
16
24
58
19
61
23
22
27
18
22
27
22
82
24
11
20
15
17
61
16
15
16
11
17
32
10
7
50
15
13
13
15
75
17
28
16
33
13
16
20
29
16
29
14
81
16
85
14
85
12
26
16
25
11
21
11
19
9
20
11
67
9
83
6
24
8
83
11
34
8
24
7
21
6
76
3
27
6
7
15
25
3
18
2
34
9
21
4
189
0
15
0
13
1
13
3
23
-1
12
0
28
12
PAT YoY (%)
FY25
12
50
-58
41
55
9
-13
17
10
16
8
61
22
11
13
4
-23
1
6
15
32
9
48
-11
13
15
16
11
18
-22
0
-27
7
16
0
1
6
-2
9
11
21
6
27
20
-32
-5
19
0
15
20
64
6
3
8
FY26E
44
113
186
164
61
48
27
27
24
22
30
26
25
22
22
6
15
19
10
12
14
19
15
18
8
12
10
7
11
6
12
4
9
2
12
4
-7
7
8
3
-5
6
3
-2
1
-5
0
0
0
-20
-8
-1
-34
9
FY27E
32
256
62
46
40
20
34
28
30
29
19
20
17
19
19
12
24
19
24
21
20
14
16
11
16
12
12
15
11
16
10
17
12
18
6
14
26
10
6
10
19
6
7
7
3
9
3
0
0
15
7
-6
30
16
PAT Contbn to
CAGR %
FY28E
Delta %
25-27
23
38
45
125
175
2
24
116
7
14
97
6
32
50
10
18
34
3
21
31
2
12
27
1
5
27
0
27
26
5
19
24
1
24
23
0
12
21
2
13
21
3
19
21
3
12
9
57
21
19
1
10
19
0
18
17
2
19
17
1
19
17
1
12
16
3
12
16
0
12
15
1
11
12
1
14
12
0
17
11
5
16
11
7
13
11
1
11
11
0
10
11
7
12
10
0
10
10
1
18
10
7
5
9
1
8
9
1
23
8
2
7
8
2
6
7
2
4
7
1
22
6
1
4
6
3
9
5
0
11
2
0
2
2
1
3
2
1
7
2
0
0
0
0
0
0
0
22
-4
-2
8
-1
0
9
-3
0
37
-7
-1
16
13
100
October 2025
29
 Motilal Oswal Financial Services
Sectors & Companies
BSE Sensex: 81,207
Nifty 50: 24,894
October 2025
Reform. Resilience. Revelry!
Mastering the game!
MOFSL Universe:
2QFY26 Highlights & Ready Reckoner
Note:
In our quarterly performance tables, our four-quarter numbers may not always add up to the
full-year
numbers. This is because of differences in classification of account heads in the company’s
quarterly and annual results or because of differences in the way we classify account heads as opposed
to the company.
All stock prices and indices as on 1 October 2025, unless otherwise stated.
October 2025
30
 Motilal Oswal Financial Services
Reform. Resilience. Revelry!
Mastering the game!
MOFSL Universe: 2QFY26 aggregate performance highlights
Exhibit 33:
Quarterly Performance - MOFSL Universe (INR b)
Sector
Sales
EBITDA
PAT
(Nos of Cos)
Sep-25
Var. % YoY Var. % QoQ Sep-25
Var. % YoY Var. % QoQ
Automobiles (26)
3,173
4.2
-1.0
375
-3.9
-0.7
233
5.0
1.5
Capital Goods (15)
1,154
15.4
14.2
143
11.1
17.5
97
14.2
15.8
Cement (12)
607
19.3
-10.3
85
55.1
-28.0
35
61.5
-29.5
Chemicals (13)
177
5.5
4.3
32
4.7
-1.8
18
2.7
-3.9
Consumer (21)
952
5.7
-2.3
211
1.8
-4.8
149
3.2
-4.8
Consumer Durables (5)
184
9.7
-7.9
19
28.2
-3.1
13
23.9
-5.1
EMS (7)
192
24.9
3.3
10
31.3
1.0
5
35.6
6.6
Financials (65)
4,421
5.6
6.1
1,800
-1.1
-8.1
1,161
-0.9
-4.5
Banks-Private (12)
916
0.6
-2.0
675
-2.0
-18.0
401
-7.3
-6.7
Banks-PSU (6)
861
-2.5
-1.7
601
-9.2
-9.1
365
-7.1
-1.9
Insurance (8)
2,049
9.5
15.4
59
-1.3
41.2
104
5.7
-22.9
NBFC - Lending (24)
515
14.6
2.4
423
14.4
7.7
256
20.8
5.3
NBFC - Non Lending (15)
81
8.8
4.9
42
3.6
6.0
35
-0.1
-3.7
Healthcare (27)
959
9.2
3.0
228
8.4
1.1
141
9.5
0.5
Infrastructure (3)
37
4.7
-15.1
11
7.2
-12.0
3
-8.0
-27.5
Logistics (9)
204
14.8
1.7
70
17.4
-1.2
42
25.9
-1.5
Media (3)
48
6.0
5.3
10
0.9
11.2
7
18.5
14.8
Metals (11)
2,932
4.2
-2.5
526
10.6
-10.4
224
10.2
-20.6
Oil & Gas (14)
7,088
0.4
-6.3
958
22.7
-4.2
470
24.9
-0.7
Oil Ex OMCs (11)
3,419
3.8
0.4
728
9.3
4.0
364
2.0
16.7
Real Estate (14)
172
22.9
15.8
53
44.5
47.1
44
29.4
29.7
Retail (24)
684
11.0
2.0
73
10.9
-3.2
30
19.4
-2.3
Staffing (4)
114
-4.6
5.5
3
-19.7
14.9
2
11.9
19.7
Technology (16)
2,133
6.0
4.0
473
5.6
5.5
327
5.7
1.9
Telecom (5)
787
16.4
2.5
400
20.2
2.4
23
LP
43.7
Utilities (8)
847
16.4
5.5
290
17.4
8.7
105
4.4
1.1
Others (26)
795
15.3
4.9
105
17.1
-16.4
24
227.9
-43.4
MOFSL Universe (328)
27,659
5.9
-0.1
5,876
8.3
-3.8
3,157
9.1
-3.6
Nifty (48)
14,036
7.0
1.5
3,631
7.8
-4.2
1,943
5.7
-2.7
Sensex (30)
10,799
6.9
1.2
2,961
8.2
-3.4
1,579
7.6
-1.5
For Banks: Sales = Net Interest Income, EBITDA = Operating Profits; For Life Insurance: Sales = Net Premium, EBITDA = VNB
Exhibit 34:
Quarter-wise sales growth (% YoY)
6.2
5.8
5.6
5.9
Dec-24
Mar-25
Jun-25
Sep-25E
Exhibit 35:
Quarter-wise net profit growth (% YoY)
10.6
9.9
9.1
6.5
Dec-24
Mar-25
Jun-25
Sep-25E
October 2025
31
 Motilal Oswal Financial Services
Reform. Resilience. Revelry!
Mastering the game!
Annual performance - MOFSL universe (INR b)
Sector
Sales (INR b)
FY26E FY27E FY28E
Chg. YoY (%)
EBIDTA (INR b)
Chg. YoY (%)
PAT (INR b)
Chg. YoY (%)
FY26E FY27E FY28E FY26E FY27E FY28E FY26E FY27E FY28E FY26E FY27E FY28E FY26E FY27E FY28E
11.1
16.9
11.6
10.6
9.6
15.9
19.6
13.8
17.3
14.5
10.2
19.0
15.3
11.2
11.6
13.5
6.6
5.9
-1.1
1.7
19.1
15.6
11.8
6.2
10.9
11.3
18.7
8.3
9.9
1,662
681
448
141
892
90
50
8,389
3,018
2,542
852
1,799
178
933
57
297
41
2,496
4,225
3,245
239
326
14
1,912
1,639
1,369
592
26,494
25,515
2,004
795
556
174
1,007
109
73
9,752
3,458
2,905
996
2,182
211
1,055
72
345
43
2,875
4,327
3,471
284
387
16
2,092
1,813
1,539
769
30,088
29,232
2,320
944
647
196
1,106
130
96
11,558
4,125
3,392
1,162
2,631
248
1,173
83
393
46
3,102
4,572
3,662
343
452
18
2,235
2,037
1,763
953
34,171
33,261
-1.1
20.0
34.5
16.4
7.3
17.5
42.1
8.4
9.3
1.2
14.6
15.1
14.0
10.2
15.4
19.1
10.7
14.5
11.3
7.6
43.4
18.4
15.9
6.7
16.6
16.7
20.6
11.1
10.6
20.6
16.7
24.0
23.7
12.9
21.2
46.9
16.2
14.6
14.3
16.9
21.3
18.4
13.0
26.6
16.2
6.5
15.2
2.4
6.9
18.6
18.6
16.2
9.4
10.6
12.4
29.9
13.6
14.6
15.8 987 1,198
18.8 469
551
16.4 234
303
12.2
82
105
9.8
632
721
19.3
62
75
30.8
27
42
18.5 5,334 6,289
19.3 1,853 2,223
16.8 1,608 1,866
16.6 609
677
20.6 1,117 1,350
17.5 146
173
11.2 580
665
15.3
23
30
14.1 180
214
7.5
27
29
7.9 1,214 1,491
5.7 1,866 1,872
5.5 1,405 1,519
20.9 194
231
16.8 139
174
16.3
10
11
6.8 1,335 1,448
12.4 118
261
14.6 514
597
24.0 242
368
13.6 14,270 16,677
13.8 13,809 16,324
1,420
668
366
119
796
90
58
7,458
2,664
2,192
747
1,652
203
761
39
248
32
1,644
1,973
1,615
289
212
13
1,546
442
675
487
19,336
18,978
1.1
21.0
38.1
23.1
8.6
16.6
53.9
7.0
4.4
0.7
6.3
22.8
14.7
10.6
29.5
23.2
13.0
16.9
13.3
5.2
37.8
28.3
24.8
7.0
LP
16.5
37.0
12.1
11.2
21.4
17.7
29.4
27.9
14.1
21.1
54.8
17.9
20.0
16.1
11.1
20.8
18.5
14.6
31.2
18.7
8.0
22.8
0.4
8.1
18.8
24.8
17.0
8.5
121
16.2
51.8
16.9
18.2
18.5
21.2
20.7
13.1
10.5
19.6
37.6
18.6
19.8
17.4
10.3
22.4
17.3
14.4
27.3
15.6
11.3
10.3
5.4
6.3
25.3
21.7
13.4
6.7
69.4
13.1
32.4
15.9
16.3
Auto (26)
13,930 15,508 17,227 9.3
11.3
Capital Goods (15)
5,028
5,755
6,729 18.6 14.4
Cement (12)
2,737
3,050
3,403 13.8 11.4
Chemicals (13)
725
821
909
8.6
13.2
Consumer (21)
3,901
4,300
4,712
9.3
10.2
Consumer Durables (5)
854
989
1,145 11.0 15.7
EMS (7)
825
1,168
1,397 40.6 41.6
Financials (68)
18,562 21,136 24,049 7.8
13.9
Banks-PVT (12)
3,875
4,518
5,300
6.0
16.6
Banks-PSU (6)
3,623
4,188
4,793
2.1
15.6
Insurance (8)
8,488
9,353 10,307 9.2
10.2
NBFC-Lending (27)
2,242
2,693
3,205 15.4 20.1
NBFC-Non Lending (15) 333
384
443
12.9 15.5
Healthcare (27)
3,878
4,326
4,809 10.0 11.5
Infrastructure (3)
191
231
258
10.5 21.0
Logistics (9)
848
977
1,110 15.5 15.2
Media (3)
192
205
218
7.0
6.7
Metals (11)
12,733 13,940 14,759 7.3
9.5
Oil & Gas (14)
33,061 33,002 32,646 -6.1 -0.2
Ex OMCs (11)
18,131 18,673 18,981 -4.1
3.0
Real Estate (14)
782
918
1,094 29.7 17.4
Retail (24)
2,916
3,400
3,932 16.4 16.6
Staffing (4)
458
516
577
9.0
12.6
Technology (16)
8,612
9,182
9,756
7.2
6.6
Telecom (5)
3,186
3,521
3,905 14.5 10.5
Utilities (8)
3,791
4,222
4,699 15.6 11.4
Others (26)
3,439
4,131
4,903 17.9 20.1
MOFSL (331)
1,20,650 1,31,298 1,42,237 5.4
8.8
MOFSL Ex OMCs (328) 1,05,721 1,16,970 1,28,572 7.7
10.6
For Banks: Sales = Net Interest Income, EBIDTA = Operating Profits.
Valuations - MOFSL universe
Sector
Auto (26)
Capital Goods (15)
Cement (12)
Chemicals (13)
Consumer (21)
Consumer Durables (5)
EMS (7)
Financials (68)
Banks-PVT (12)
Banks-PSU (6)
Insurance (8)
NBFC - Lending (27)
NBFC - Non Lending (15)
Healthcare (27)
Infrastructure (3)
Logistics (9)
Media (3)
Metals (11)
Oil & Gas (14)
Ex OMCs (11)
Real Estate (14)
Retail (24)
Staffing (4)
Technology (16)
Telecom (5)
Utilities (8)
Others (26)
MOFSL (331)
MOFSL Ex OMCs (328)
N.M.: Not Meaningful
FY26E
29.6
39.1
42.3
36.7
44.3
48.4
78.4
15.8
18.8
8.6
19.6
16.3
37.8
33.8
18.3
26.7
17.1
13.3
15.9
17.9
32.9
80.2
14.0
22.5
122.9
18.2
56.0
23.4
23.9
PE (x)
FY27E
24.4
33.2
32.7
28.7
38.8
39.9
50.6
13.4
15.7
7.4
17.7
13.5
31.9
29.5
14.0
22.5
15.9
10.8
15.8
16.6
27.7
64.2
12.0
20.8
55.6
15.6
36.9
20.0
20.2
FY28E
20.6
27.4
27.1
25.4
35.1
33.4
36.8
11.3
13.1
6.3
16.0
11.0
27.2
25.8
11.0
19.4
14.3
9.8
15.0
15.6
22.1
52.8
10.6
19.5
32.8
13.8
27.9
17.3
17.4
FY26E
4.7
7.3
3.4
3.9
10.6
8.1
12.4
2.3
2.4
1.2
4.7
2.5
9.5
4.8
1.3
4.2
1.4
2.3
1.6
1.7
3.9
11.4
2.3
6.5
11.8
2.5
6.3
3.4
3.5
PB (x)
FY27E
4.2
6.3
3.2
3.5
9.9
7.0
10.0
2.1
2.2
1.1
3.9
2.1
8.2
4.2
1.2
3.6
1.3
2.0
1.5
1.6
3.4
10.1
2.0
6.3
10.4
2.2
5.5
3.1
3.1
FY28E
3.6
5.4
3.0
3.1
9.2
6.0
7.9
1.8
1.9
1.0
3.2
1.8
7.1
3.7
1.1
3.1
1.3
1.8
1.4
1.5
3.0
8.8
1.8
6.1
9.7
2.0
4.7
2.7
2.8
EV/EBIDTA (x)
FY26E FY27E FY28E
16.2
13.2
11.1
26.2
22.1
18.2
23.1
18.5
15.8
21.5
17.3
15.3
30.6
27.0
24.4
32.2
26.4
22.0
42.4
28.5
21.4
N.M
N.M
N.M
N.M
N.M
N.M
N.M
N.M
N.M
N.M
N.M
N.M
N.M
N.M
N.M
N.M
N.M
N.M
20.7
17.9
15.7
6.1
4.4
3.4
17.2
14.6
12.6
10.4
9.3
9.4
7.3
6.2
5.5
8.4
8.0
7.4
8.8
8.0
7.3
26.8
22.1
18.1
35.2
29.8
25.1
9.9
8.0
6.4
14.9
13.5
12.6
10.7
9.2
7.8
10.4
9.5
8.3
22.5
17.1
13.5
14.4
12.6
11.2
14.8
12.8
11.3
ROE (%)
FY26E FY27E FY28E
16.0
17.1
17.6
18.7
18.9
19.5
8.1
9.8
11.0
10.5
12.1
12.3
24.0
25.6
26.2
16.7
17.5
18.0
15.9
19.8
21.5
14.8
15.3
15.9
12.9
13.8
14.5
14.4
14.9
15.6
24.0
21.9
20.1
15.0
15.8
16.6
25.1
25.8
26.2
14.1
14.2
14.2
6.9
8.3
9.6
15.6
16.0
16.1
8.3
8.5
8.9
17.5
18.8
18.1
10.2
9.4
9.2
9.5
9.5
9.4
11.9
12.5
13.6
14.3
15.6
16.6
16.1
16.8
16.9
29.0
30.4
31.2
9.6
18.7
29.6
13.5
14.3
14.6
11.3
14.9
16.8
14.7
15.3
15.8
14.7
15.6
16.1
EARN. CAGR
(FY25-FY27)
10.8
19.3
33.7
25.5
11.3
18.8
54.3
12.4
11.9
8.1
8.7
21.8
16.6
12.6
30.4
20.9
10.5
19.8
6.6
6.6
28.0
26.5
20.9
7.7
LP
16.4
44.2
14.5
14.7
October 2025
32
 Motilal Oswal Financial Services
Reform. Resilience. Revelry!
Mastering the game!
Ready reckoner: Quarterly performance
Sector
Amara Raja Energy
Apollo Tyres
Ashok Leyland
Bajaj Auto
Balkrishna Inds
Bharat Forge
Bosch
CEAT
CIE Automotive
Craftsman Auto
Eicher Motors
Endurance Tech.
Escorts Kubota
Exide Inds.
Happy Forgings
Hero Motocorp
Hyundai Motor
Mahindra & Mahindra
Maruti Suzuki
Samvardhana Motherson
Motherson Wiring
MRF
Sona BLW Precis.
Tata Motors
Tube Investments
TVS Motor
Automobiles
ABB India
Bharat Dynamics
Bharat Electronics
Cummins India
Hind.Aeronautics
Hitachi Energy
Kalpataru Proj.
KEC International
Kirloskar Oil
Larsen & Toubro
Siemens
Siemens Energy
Thermax
Triveni Turbine
Zen Technologies
Capital Goods
ACC
Ambuja Cements
Birla Corporation
Dalmia Bharat
Grasim Industries
India Cements
J K Cements
JK Lakshmi Cem.
JSW Cement
Ramco Cements
Shree Cement
Ultratech Cement
Cement
Alkyl Amines
Atul
Clean Science
Deepak Nitrite
Ellenbarrie Industrial
October 2025
CMP
(INR)
993
468
141
8619
2304
1219
38338
3488
413
6725
7005
2812
3637
395
925
5430
2537
3463
15971
106
46
148630
414
718
3082
3457
5198
1542
407
3848
4803
18168
1241
854
926
3670
3123
3400
3167
524
1464
1829
571
1212
2232
2792
391
6306
869
139
992
29262
12119
1900
6182
1097
1842
470
RECO
Neutral
Buy
Buy
Neutral
Neutral
Neutral
Neutral
Buy
Buy
Neutral
Sell
Buy
Neutral
Neutral
Buy
Buy
Buy
Buy
Buy
Buy
Buy
Sell
Neutral
Neutral
Buy
Neutral
Buy
Buy
Buy
Buy
Buy
Sell
Buy
Neutral
Buy
Buy
Neutral
Buy
Sell
Buy
Neutral
Neutral
Buy
Buy
Buy
Buy
Sell
Buy
Buy
Neutral
Neutral
Neutral
Buy
Neutral
Buy
Neutral
Sell
Buy
SALES (INR M)
EBDITA (INR M)
NET PROFIT (INR M)
Var
Var
Var
Var
Var
Var
Sep-25
Sep-25
Sep-25
% YoY % QoQ
% YoY % QoQ
% YoY % QoQ
33,553
7.0
0.2
4,026
-8.6
4.1
2,065
-14.2
6.4
69,968
8.7
6.6
9,581
9.1
10.4
3,709
23.2
31.9
97,232
10.9
11.4
11,473
12.8
18.3
7,430
7.2
25.1
1,46,728 11.8
16.6
29,351
10.7
18.3
24,148
9.0
15.2
25,517
3.5
-7.5
6,226
0.7
-5.1
3,672
5.0
28.0
20,949
-6.8
-0.5
5,237
-16.3
-8.4
3,041
-13.4
-10.2
48,777
11.0
1.9
6,439
14.9
0.7
5,629
12.5
-16.0
36,350
10.0
3.0
4,289
18.4
10.6
1,415
16.1
23.2
23,233
8.8
-1.9
3,278
-0.8
-2.6
1,962
0.8
-3.3
18,319
50.9
2.7
2,766
43.5
4.4
863
39.9
14.0
60,781
42.6
20.6
15,545
42.9
29.2
14,422
31.1
19.7
34,702
19.1
4.6
4,651
21.7
5
2,460
21.2
8.7
27,588
21.8
11.1
3,752
61.2
15.5
3,703
22.3
17.4
44,380
4.0
-1.6
5,414
12.0
-1.2
3,268
9.7
2.0
3,792
5.0
7.2
1,092
3.6
8.0
719
7.8
9.4
1,18,735 13.5
24.0
18,031
18.9
30.5
14,432
19.9
28.2
1,73,749
0.7
5.9
23,385
6.0
7.0
14,844
7.9
8.4
3,29,211 19.5
-3.4
46,154
16.9
-5.5
42,940
11.8
24.5
3,84,110
3.2
0.0
39,991
-9.5
0.1
33,167
8.1
-10.6
2,98,356
7.3
-1.2
23,415
-4.3
-4.8
6,340
-15.1
2.1
26,047
12.0
4.4
2,708
8.5
10.9
1,627
7.0
13.7
75,716
12.0
0.1
10,752
10.5
3.9
5,016
10.1
3.6
8,883
-4.0
10.9
2,194
-13.9
13.3
1,368
-11.5
9.6
9,25,667
-8.8
-11.3
77,577
-33.9
-20.2
22,929
-31.4
-42.2
21,342
3.4
6.4
2,600
5.7
5.1
1,786
6.4
6.2
1,18,886 28.8
17.9
15,455
43.1
22.4
9,844
48.6
26.4
31,72,572 4.2
-1.0
3,75,383
-3.9
-0.7
2,32,801
5.0
1.5
33,412
14.7
5.2
4,778
-11.6
15.4
3,949
-10.3
12.2
7,095
30.2
186.2
1,419
43.6
LP
1,637
33.6
792.1
52,580
14.7
19.0
14,408
3.8
16.2
11,178
2.4
15.3
28,779
15.5
-1.0
5,756
19.7
-7.7
5,264
16.8
-5.2
67,496
12.9
40.1
18,561
13.2
44.7
17,548
16.6
26.8
20,931
34.7
41.5
2,512
128.9
62.1
1,856
254.9
41.0
51,718
25.0
2.6
4,448
27.6
3.8
1,973
49.1
-1.7
58,575
14.6
16.6
4,276
33.5
22.1
1,706
99.7
36.9
14,389
20.5
-0.4
1,871
13.4
-1.7
1,199
8.0
-2.3
7,15,302 16.2
12.3
69,844
9.8
10.6
38,815
14.3
7.3
47,966
7.6
10.3
6,413
17.7
23.0
5,179
-0.9
22.3
20,412
-1.8
14.4
4,290
11.5
26.1
4,126
50.8
57.1
28,863
10.5
34.2
2,763
-0.6
22.7
1,779
-10.2
17.4
4,972
-0.8
33.9
1,019
-8.5
38.5
849
-6.7
31.8
1,379
-42.9
24.2
483
-39.2
26.9
398
-38.9
7.3
11,53,868 15.4
14.2 1,42,840 11.1
17.5
97,456
14.2
15.8
53,915
17.0
-11.1
5,989
39.5
-22.5
3,122
33.5
-18.8
88,601
20.1
-13.9
13,710
40.8
-30.1
4,137
-9.5
-43.6
21,354
9.4
-13.0
2,330
31.5
-32.8
379
LP
-68.3
34,678
12.3
-4.6
6,700
54.4
-24.1
2,125
286.3
-43.0
92,210
21.0
0.0
3,200
-1.6
-16.8
7,770
2.6
LP
10,670
5.0
4.1
655
LP
-20.1
-257
Loss
Loss
29,402
14.8
-12.3
4,596
61.8
-33.2
1,646
358.2
-49.2
14,057
13.9
-19.3
2,007
124.8
-35.5
661
LP
-56.0
13,452
NA
-13.8
1,913
NA
-40.7
402
NA
-63.6
21,174
3.9
2.3
3,464
11.0
-12.9
479
87.2
-44.3
42,395
13.8
-14.3
9,648
62.8
-21.5
2,155
131.4
-65.2
1,84,766 18.2
-13.2
30,629
51.8
-30.6
12,812
56.2
-43.2
6,06,675 19.3
-10.3
84,840
55.1
-28.0
35,429
61.5
-29.5
4,232
2.0
4.4
776
5.6
1.4
505
6.3
2.1
15,792
13.4
6.8
2,890
19.1
22.7
1,790
28.3
35.2
2,604
9.4
7.2
977
9.0
-2.1
668
13.7
-4.6
19,229
-5.4
1.7
1,930
-35.1
1.8
1,151
-40.7
2.5
930
NA
11.2
351
NA
14.5
254
NA
35.6
33
 Motilal Oswal Financial Services
Reform. Resilience. Revelry!
Mastering the game!
Ready reckoner: Quarterly performance
Sector
Fine Organic
Galaxy Surfactants
Navin Fluorine
NOCIL
P I Industries
SRF
Tata Chemicals
Vinati Organics
Chemicals
Asian Paints
Britannia
Colgate
Dabur
Emami
Godrej Consumer
Hind. Unilever
Indigo Paints
ITC
Jyothy Labs
L T Foods
Marico
Nestle
P&G Hygiene
Page Industries
Pidilite Inds.
Radico Khaitan
Tata Consumer
United Breweries
United Spirits
Varun Beverages
Consumer
Havells India
KEI Industries
Polycab India
R R Kabel
Voltas
Consumer Durables
Amber Enterp.
Avalon Tech
Cyient DLM
Data Pattern
Dixon Tech.
Kaynes Tech
Syrma SGS Tech.
EMS
Ajanta Pharma
Alembic Pharma
Alkem Lab
Apollo Hospitals
Aurobindo Pharma
Biocon
Blue Jet Healthcare
Cipla
Divis Labs
Dr Agarwals Health.
Dr Reddy’ s Labs
Eris Lifescience
Gland Pharma
Glenmark Pharma
Global Health
Granules India
October 2025
CMP
(INR)
4525
2226
4624
174
3584
2907
918
1724
2336
5965
2225
495
543
1148
2536
1073
406
319
402
701
1166
14092
42159
1475
2916
1144
1799
1347
443
1485
4034
7353
1268
1353
8239
1008
431
2630
16454
7152
803
2399
904
5460
7442
1087
347
662
1514
5711
504
1246
1623
1981
1959
1306
542
RECO
Sell
Buy
Neutral
Neutral
Buy
Buy
Neutral
Buy
Neutral
Neutral
Buy
Buy
Buy
Buy
Buy
Buy
Buy
Neutral
Buy
Buy
Neutral
Neutral
Buy
Neutral
Buy
Buy
Neutral
Neutral
Buy
Neutral
Buy
Buy
Neutral
Neutral
Buy
Buy
Buy
Neutral
Buy
Buy
Buy
Buy
Neutral
Neutral
Buy
Buy
Buy
Buy
Neutral
Neutral
Buy
Neutral
Neutral
Buy
Buy
Buy
Buy
SALES (INR M)
EBDITA (INR M)
NET PROFIT (INR M)
Var
Var
Var
Var
Var
Var
Sep-25
Sep-25
Sep-25
% YoY % QoQ
% YoY % QoQ
% YoY % QoQ
6,256
5.0
6.3
1,277
-15.2
3.3
1,041
-11.4
-7.0
12,501
17.6
-2.2
1,324
3.8
6.9
824
-2.7
3.7
7,519
45.0
3.7
1,731
61.3
-16.3
892
51.7
-23.9
3,448
-4.9
2.5
310
-16.3
5.0
195
-52.9
17.8
17,769
-20.0
-6.5
4,349
-30.8
-16.2
3,264
-35.8
-18.4
38,840
13.4
1.7
8,247
47.1
0.4
4,286
91.3
1.2
41,974
5.0
12.9
6,250
1.1
-3.7
2,097
8.1
-16.8
6,307
14.0
16.3
1,699
26.8
2.5
1,251
17.9
10.9
1,77,400
5.5
4.3
32,113
4.7
-1.8
18,218
2.7
-3.9
81,078
1.0
-9.3
13,511
9.0
-16.9
9,072
3.8
-18.8
49,315
8.0
8.7
8,738
11.5
15.4
6,107
14.9
17.4
15,252
-5.8
6.4
4,545
-8.6
0.4
3,215
-9.6
0.3
32,067
5.9
-5.8
5,868
6.2
-12.1
4,570
5.5
-12.5
8,018
-10.0
-11.3
1,719
-31.4
-19.8
1,594
-31.7
-13.5
39,331
7.3
7.4
7,229
-5.1
4.1
5,002
1.0
7.1
1,62,625
2.1
-1.5
36,484
-3.8
-1.9
25,552
-1.8
1.1
3,025
1.0
-2.1
430
3.5
-3.0
240
5.8
-7.6
2,16,873
4.6
0.9
69,009
2.1
1.2
52,731
5.6
0.6
7,567
3.1
0.7
1,351
-2.4
8.9
1,009
-3.9
4.3
25,958
23.2
5.4
2,863
24.9
7.9
1,664
12.1
-1.3
34,168
28.3
4.8
5,563
6.6
-15.1
4,219
7.8
-16.3
53,732
5.3
5.4
11,955
0.3
6.9
7,306
-6.2
13.0
11,579
2.0
23.6
2,953
1.6
10.9
2,192
3.5
14.2
13,144
5.5
-0.2
2,984
6.3
1.3
2,051
5.5
2.2
35,204
8.8
-6.2
8,531
11.0
-9.3
6,079
13.7
-9.6
13,939
24.9
-7.4
2,126
30.3
-8.4
1,225
49.1
-12.7
47,886
13.6
0.2
6,335
1.2
4.4
3,734
-3.0
11.7
21,781
3.0
-23.9
2,135
-5.9
-31.3
1,200
-9.3
-34.7
30,385
6.9
19.2
5,621
10.9
35.5
3,797
13.3
28.2
49,248
2.5
-29.8
11,490
-0.2
-42.5
6,685
7.9
-49.2
9,52,176
5.7
-2.3
2,11,440
1.8
-4.8
1,49,243
3.2
-4.8
47,637
4.9
-12.7
4,537
21.0
-12.0
3,026
13.0
-12.9
27,405
20.2
5.8
2,836
28.6
9.9
2,100
35.6
7.3
65,124
18.4
10.3
8,933
41.4
4.2
5,994
36.3
1.2
21,063
16.4
2.3
1,548
80.5
9.0
965
94.8
7.5
22,478
-14.2
-42.9
1,053
-35.1
-41.0
874
-34.8
-37.8
1,83,706
9.7
-7.9
18,907
28.2
-3.1
12,958
23.9
-5.1
20,114
19.4
-41.7
1,442
26.8
-43.8
264
37.2
-74.6
3,300
20.0
2.1
367
21.6
22.7
232
32.8
63.3
3,116
-20.0
11.9
303
-4.2
20.9
115
-25.5
54.4
1,365
50.0
37.5
544
58.7
69.7
456
50.6
78.9
1,44,140 25.0
12.3
5,243
23.0
8.7
2,555
19.2
13.6
9,440
65.0
40.2
1,543
87.9
36.5
1,141
89.5
52.9
10,659
28.0
12.9
921
29.8
6.3
570
57.2
14.5
1,92,133 24.9
3.3
10,363
31.3
1.0
5,333
35.6
6.6
13,078
10.2
0.4
3,714
10.3
-1.3
2,642
12.1
-1.2
17,963
9.0
5.0
2,964
23.9
5.4
1,724
21.0
11.7
37,790
10.7
12.1
8,427
11.9
14.0
7,087
2.9
8.5
61,369
9.8
5.0
8,898
9.1
4.5
4,373
15.5
1.0
81,128
4.1
3.1
16,550
5.7
3.2
8,646
5.8
4.8
41,433
15.4
5.1
8,369
21.9
11.9
700
91.6
133.3
2,838
36.3
-20.0
924
32.9
-23.6
709
21.5
-22.3
73,324
4.0
5.4
18,258
-3.2
2.7
13,098
0.6
0.9
26,090
11.6
8.3
8,088
13.0
10.9
5,853
19.3
13.4
4,958
19.0
1.7
1,299
21.4
1.6
268
61.7
-11.0
85,500
6.7
0.1
20,178
-8.4
-6.2
13,449
-1.1
-5.1
8,079
9.0
4.5
2,925
10.6
5.7
1,272
38.8
8.4
15,159
7.8
0.7
3,441
15.9
-6.4
2,069
26.5
-4.0
35,199
2.5
7.8
5,913
-1.8
1.9
3,224
-7.6
2.7
10,080
5.4
-2.2
2,369
1.1
0.9
1,488
13.8
-0.8
11,843
22.5
-2.1
2,570
26.4
4.2
1,322
35.9
-0.5
34
 Motilal Oswal Financial Services
Reform. Resilience. Revelry!
Mastering the game!
Ready reckoner: Quarterly performance
Sector
GSK Pharma
IPCA Labs.
Laurus Labs
Laxmi Dental
Lupin
Mankind Pharma
Max Healthcare
Piramal Pharma
Sun Pharma
Torrent Pharma
Zydus Lifesciences
Healthcare
G R Infraproject
IRB Infra
KNR Constructions
Infrastructure
Adani Ports
Blue Dart Express
Concor
Delhivery
JSW Infra
Mahindra Logistics
TCI Express
Transport Corp.
VRL Logistics
Logistics
PVR Inox
Sun TV
Zee Entertainment
Media
Coal India
Hindalco
Hindustan Zinc
Jindal Stainless
Jindal Steel
JSW Steel
Nalco
NMDC
SAIL
Tata Steel
Vedanta
Metals
Aegis Logistics
BPCL
Castrol India
GAIL
Gujarat Gas
Gujarat State Petronet
HPCL
Indraprastha Gas
IOC
Mahanagar Gas
Oil India
ONGC
Petronet LNG
Reliance Inds.
Oil & Gas
Oil Ex OMCs
Anant Raj
Brigade Enterpr.
DLF
October 2025
CMP
(INR)
2695
1328
872
328
1982
2439
1113
199
1636
3563
992
1231
41
199
1422
5715
527
435
317
348
733
1197
274
1099
602
114
389
766
481
762
1064
1146
215
76
135
168
465
787
340
201
175
435
318
434
209
150
1277
412
243
275
1369
RECO
Neutral
Buy
Buy
Buy
Neutral
Buy
Buy
Buy
Buy
Neutral
Neutral
Buy
Neutral
Neutral
Buy
Buy
Buy
Buy
Buy
Neutral
Neutral
Buy
Buy
Neutral
Neutral
Neutral
Buy
Buy
Neutral
Buy
Buy
Buy
Neutral
Buy
Neutral
Neutral
Neutral
Neutral
Neutral
Buy
Buy
Buy
Neutral
Buy
Buy
Neutral
Buy
Neutral
Neutral
Buy
Buy
SALES (INR M)
Var
Var
Sep-25
% YoY % QoQ
10,361
2.5
28.7
24,786
5.3
7.4
15,624
27.7
-0.5
697
22.0
6.2
64,498
16.4
2.9
37,631
22.3
5.4
25,992
22.7
6.0
20,537
-8.4
6.2
1,40,428
5.9
1.9
32,165
11.3
1.2
60,247
15.0
-8.4
9,58,796
9.2
3.0
13,911
23.3
-23.8
17,623
11.1
-16.0
5,860
-31.5
22.3
37,394
4.7
-15.1
86,560
22.5
-5.2
15,968
10.2
10.7
23,460
2.8
9.1
25,025
14.3
9.1
12,012
20.0
-1.9
17,366
14.2
6.9
3,147
1.0
9.7
12,361
10.3
8.5
7,850
-1.8
5.5
2,03,749 14.8
1.7
18,100
11.6
23.2
10,051
11.7
-20.0
19,785
-1.1
8.4
47,936
6.0
5.3
2,98,782
-2.6
-16.6
6,37,385
9.5
-0.8
80,975
-1.9
4.2
1,04,887
7.3
2.8
1,07,114
-4.5
-12.9
4,30,607
8.5
-0.2
37,113
-7.3
-2.5
60,186
22.4
-10.7
2,43,593
5.7
-5.4
5,68,006
5.4
6.8
3,62,872
-3.6
-4.1
29,31,519 4.2
-2.5
19,141
9.4
11.3
9,26,347
-9.8
-17.7
13,218
2.6
-11.7
3,24,713
-1.3
-6.6
37,413
-1.1
-3.3
2,500
5.1
3.1
9,04,918
-9.4
-18.3
42,919
16.1
9.7
18,38,328 5.7
-4.7
19,475
13.8
-1.4
54,219
-1.8
8.2
3,24,796
-4.1
1.5
1,13,592 -12.8
-4.4
24,66,848 6.5
1.3
70,88,427 0.4
-6.3
34,18,834 3.8
0.4
5,324
3.8
-10.1
12,178
13.6
-4.9
24,451
23.8
-10.0
EBDITA (INR M)
Var
Var
Sep-25
% YoY % QoQ
3,253
1.2
29.6
4,585
3.6
10.1
3,422
91.9
-10.5
129
47.7
8.3
16,447
33.0
0.2
9,709
14.2
14.7
6,602
16.4
7.0
2,259
-33.9
111.7
39,741
5.0
-0.8
10,679
13.7
2.0
16,568
17.0
-18.4
2,28,281
8.4
1.1
1,628
38.9
-29.6
8,547
11.5
-10.2
785
-43.1
27.2
10,960
7.2
-12.0
52,196
19.5
-5.0
1,389
14.0
38.7
5,067
-11.9
18.8
1,627
184.0
9.3
6,054
16.3
4.2
886
33.4
16.1
334
-9.3
18.9
1,347
15.1
11.4
1,498
12.6
-1.2
70,397
17.4
-1.2
2,792
49.2
192.9
5,980
13.1
-3.1
1,690
-47.3
-25.9
10,462
0.9
11.2
84,868
18.6
-23.7
74,636
-5.3
-5.6
43,730
6.1
13.3
13,011
9.7
-0.7
15,840
-28.0
-47.3
64,387
18.4
-15.0
11,537
-25.5
-22.7
21,282
53.6
-14.1
16,460
29.0
-36.6
85,319
54.5
14.9
94,892
-3.4
-4.3
5,25,962 10.6
-10.4
2,581
15.3
7.6
74,332
64.7
-23.1
3,017
5.4
-13.7
30,493
-18.6
-8.5
4,412
-14.2
-15.1
1,988
3.0
-1.8
59,049
113.3
-23.1
5,062
-5.5
-1.1
96,675
130.6
-23.3
3,510
-11.9
-27.7
21,884
0.2
36.2
1,85,263
1.6
-0.7
11,600
-3.4
0.0
4,57,719 17.2
6.7
9,57,588 22.7
-4.2
7,27,531
9.3
4.0
1,896
68.1
25.8
4,292
47.0
32.6
7,347
46.3
101.7
NET PROFIT (INR M)
Var
Var
Sep-25
% YoY % QoQ
2,473
-0.2
20.7
2,665
15.6
14.3
1,408
609.7
-12.2
97
64.5
17.1
10,346
34.7
-9.6
5,060
-22.6
17.1
4,353
17.6
17.4
40
-82.3
LP
30,287
4.2
1.1
5,980
32.0
7.0
10,792
22.8
-24.1
1,41,422
9.5
0.5
1,446
24.5
-33.0
1,351
35.3
-33.3
550
-62.7
27.1
3,348
-8.0
-27.5
31,598
28.3
-6.1
751
23.6
60.1
3,432
-13.3
33.2
820
704.2
-9.9
3,617
37.6
1.2
75
LP
LP
237
-4.9
21.8
1,131
6.3
6.2
520
45.0
3.9
42,181
25.9
-1.5
1,379
515.8
LP
4,961
24.6
-6.2
995
-49.9
-30.8
7,335
18.5
14.8
62,539
-0.6
-28.5
36,371
-14.8
-9.2
24,943
3.5
11.7
7,418
21.3
3.9
3,663
-57.5
-75.5
15,483
140.3
-29.1
7,758
-25.8
-26.1
16,367
35.1
-16.8
1,009
LP
-82.3
27,733
514.9
30.2
21,181
-28.2
-33.5
2,24,466 10.2
-20.6
1,279
1.6
-2.6
46,125
92.4
-24.7
2,124
2.4
-13.0
21,155
-20.8
12.1
2,442
-20.4
-25.3
3,335
-14.3
134.0
29,593
368.8
-32.3
4,009
-7.0
12.6
30,995
LP
-45.5
2,396
-15.3
-26.1
16,730
-8.8
105.7
1,00,126 -16.5
24.8
7,850
-7.4
-7.7
2,02,172 22.1
11.9
4,70,329 24.9
-0.7
3,63,616
2.0
16.7
1,235
16.9
-1.9
2,350
97.5
56.8
10,931
-20.9
43.3
35
699
896
722
Buy
Buy
Buy
 Motilal Oswal Financial Services
Reform. Resilience. Revelry!
Mastering the game!
Ready reckoner: Quarterly performance
Sector
Godrej Properties
Kolte Patil Dev.
Lodha Developers
Mahindra Lifespace
Oberoi Realty
Phoenix Mills
Prestige Estates
SignatureGlobal
Sobha
Sri Lotus Developers
Sunteck Realty
Real Estate
Aditya Birla Fashion
Aditya Birla Lifestyle
Avenue Supermarts
Barbeque Nation
Bata India
Campus Activewear
Devyani Intl.
Go Fashion
Jubilant Foodworks
Kalyan Jewellers
Metro Brands
P N Gadgil Jewellers
Raymond Lifestyle
Relaxo Footwear
Restaurant Brands
Sapphire Foods
Senco Gold
Shoppers Stop
Titan Company
Trent
V-Mart Retail
Vedant Fashions
Vishal Mega Mart
Westlife Foodworld
Retail
Quess Corp
SIS
Team Lease Serv.
Updater Services
Staffing
Coforge
Cyient
HCL Technologies
Hexaware Tech.
Infosys
KPIT Technologies
LTIMindtree
L&T Technology
MphasiS
Persistent Systems
Tata Elxsi
Tata Technologies
TCS
Tech Mahindra
Wipro
Zensar Tech
Technology
Bharti Airtel
Bharti Hexacom
October 2025
CMP
(INR)
2031
431
1140
361
1595
1564
1543
1045
1517
191
438
86
134
4449
234
1188
271
171
685
619
465
1248
607
1181
446
78
297
345
521
3406
4834
725
691
149
681
255
350
1753
252
1601
1149
1389
676
1446
1155
5124
4185
2691
4955
5227
690
2914
1416
241
769
1867
1653
RECO
Buy
Buy
Buy
Neutral
Neutral
Buy
Buy
Buy
Buy
Buy
Buy
Neutral
Neutral
Buy
Neutral
Neutral
Buy
Buy
Buy
Neutral
Buy
Buy
Buy
Buy
Sell
Buy
Buy
Neutral
Neutral
Buy
Buy
Buy
Neutral
Buy
Neutral
Neutral
Buy
Buy
Buy
Buy
Sell
Buy
Buy
Neutral
Buy
Buy
Neutral
Neutral
Buy
Sell
Sell
Buy
Buy
Sell
Neutral
Buy
Neutral
SALES (INR M)
Var
Var
Sep-25
% YoY % QoQ
11,286
3.2
159.7
6,853
122.3
732.0
32,597
24.1
-6.6
857
1,027
168.2
14,237
7.9
44.2
10,747
17.1
12.8
28,062
21.8
21.6
8,720
16.4
0.7
11,679
25.1
37.1
2,713
NA
342.5
2,232
32.0
18.5
1,71,937 22.9
15.8
19,619
NA
7.1
19,673
NA
6.9
1,67,017 15.6
2.1
3,070
0.4
3.4
8,624
3.0
-8.4
3,760
12.8
9.5
13,139
7.5
-3.2
2,224
6.7
-0.2
17,089
16.5
0.4
76,401
26.0
5.1
6,510
11.2
3.6
21,483
7.3
25.3
17,985
5.3
25.7
6,793
0.0
3.8
5,613
14.1
1.6
7,567
8.8
-2.6
18,006
20.0
-1.4
11,556
8.2
5.6
1,63,633 12.6
-1.0
47,620
18.0
-0.4
8,070
22.1
-8.8
2,709
1.1
-3.7
29,507
21.1
-6.0
6,610
7.0
0.5
6,84,276 11.0
2.0
38,828
-25.0
6.3
35,626
9.0
0.4
31,654
13.2
9.5
7,695
13.2
9.9
1,13,804
-4.6
5.5
41,116
34.3
11.5
18,296
-1.1
6.9
3,16,416
9.6
4.3
34,659
10.5
6.3
4,43,511
8.2
4.9
15,570
5.8
1.2
1,02,778
9.0
4.4
29,604
15.1
3.3
38,795
9.7
3.9
35,259
21.7
5.8
9,258
-3.1
3.8
12,844
-0.9
3.2
6,53,898
1.8
3.1
1,38,632
4.1
3.8
2,28,284
2.4
3.1
14,163
8.3
2.3
21,33,086 6.0
4.0
5,10,584 23.1
3.2
23,050
9.9
1.9
EBDITA (INR M)
NET PROFIT (INR M)
Var
Var
Var
Var
Sep-25
Sep-25
% YoY % QoQ
% YoY % QoQ
1,418
344.5
LP
5,205
55.9
-13.0
1,408
770.5
LP
885
808.9
LP
9,290
31.9
-5.6
6,564
56.3
-3.5
-162
Loss
Loss
99
LP
-80.6
9,110
11.9
75.1
6,413
8.8
52.2
6,642
28.3
17.7
4,087
87.4
69.8
7,526
19.2
-15.8
3,029
57.6
3.6
1,585
LP
377.1
1,566
3,714
355
1,461
89.4
513.4
878
236.5
544.6
987
NA
235.2
742
NA
189.7
336
-10.2
-29.7
273
-21.3
-18.5
53,136
44.5
47.1
44,258
29.4
29.7
1,095
NA
-1.9
-2,034
Loss
Loss
3,072
NA
16.8
475
1,095.4
97.2
12,103
10.7
-6.8
6,990
6.0
-9.6
439
-3.7
-4.6
-124
Loss
Loss
2,087
19.5
5.0
630
21.3
11.0
500
31.0
1.5
223
56.0
0.5
1,973
-0.7
-3.7
-101
Loss
PL
663
4.5
-3.4
186
-9.4
-16.5
3,243
14.1
0.3
631
21.3
-5.4
5,106
28.9
0.5
2,669
46.6
1.1
1,754
13.3
-9.5
798
11.2
-19.2
1,241
72.2
12.9
754
42.4
8.7
1,748
-18.6
127.0
683
-32.8
LP
934
6.6
-6.1
430
17.2
-12.0
794
13.4
6.5
-146
Loss
Loss
997
-11.0
-11.7
-116
PL
Loss
1,170
43.2
-36.3
509
47.5
-51.4
1,708
16.3
2.7
-132
Loss
Loss
18,306
20.0
0.0
11,505
23.6
5.5
7,667
19.7
-8.5
4,315
1.9
2.1
644
66.8
-48.9
-176
Loss
PL
1,201
-1.6
-0.4
652
-2.6
-7.2
3,775
24.8
-17.8
1,411
35.7
-31.5
826
5.1
-3.3
8
116.1
-29
73,048
10.9
-3.2
30,041
19.4
-2.3
785
-59.9
12.6
522
-43.3
-1.0
1,663
14.9
9.4
1,149
67.0
23.6
450
34.5
46.9
399
60.3
59.4
454
3.9
15.5
321
14.6
10.7
3,352
-19.7
14.9
2,391
11.9
19.7
7,442
53.8
15.4
3,779
63.5
-3.7
3,019
1.8
30.8
1,773
-5.0
10.8
64,680
1.6
7.2
43,483
2.7
13.1
5,996
22.1
48.3
3,795
26.6
0.0
1,06,973
8.5
6.6
71,667
10.2
3.5
3,254
7.8
0.5
2,051
0.7
19.3
17,883
5.2
8.4
12,873
2.9
2.6
4,737
1.6
2.4
3,230
1.0
2.3
7,294
12.6
3.8
4,717
11.4
6.8
6,488
35.0
6.1
4,480
37.8
5.4
2,129
-20.1
14.0
1,662
-27.6
15.1
2,183
-7.3
9.1
1,640
4.2
-3.7
1,73,034
3.1
2.5
1,25,535
5.0
-2.1
20,795
18.8
7.5
13,089
4.7
14.8
44,744
0.4
3.9
31,387
-2.2
-5.8
2,139
6.3
1.6
1,739
11.6
-4.5
4,72,790
5.6
5.5
3,26,897
5.7
1.9
2,86,834 31.3
3.0
64,952
66.1
9.2
12,344
23.2
6.4
4,437
75.3
13.3
36
 Motilal Oswal Financial Services
Reform. Resilience. Revelry!
Mastering the game!
Ready reckoner: Quarterly performance
Sector
CMP
(INR)
RECO
Neutral
Neutral
Sell
Buy
Neutral
Buy
Buy
Neutral
Buy
Buy
Buy
Buy
Buy
Buy
Buy
Buy
Buy
Buy
Buy
Buy
Buy
Buy
Neutral
Buy
Buy
Buy
Buy
Neutral
Buy
Buy
Neutral
Buy
Buy
Buy
Neutral
Buy
Buy
SALES (INR M)
Var
Var
Sep-25
% YoY % QoQ
81,628
9.3
1.3
60,542
7.3
1.6
1,10,925
1.5
0.6
7,86,729 16.4
2.5
4,559
75.6
-10.8
1,542
10.7
10.2
12,167
66.2
47.3
56,970
76.0
10.8
4,53,461 12.4
6.5
1,06,906
4.2
7.7
27,852
32.4
-11.1
1,83,632 17.0
1.8
8,47,090 16.4
5.5
56,523
18.4
9.3
14,611
6.6
7.3
5,587
14.0
5.6
85,817
15.5
21.9
3,335
5.3
-4.4
12,124
11.6
9.4
80,641
68.0
12.5
25,670
4.8
-1.8
10,655
14.9
2.5
3,807
9.5
2.3
20,622
12.9
1.0
7,440
13.4
1.0
1,83,166
7.9
-10.6
12,183
3.3
10.5
3,112
9.4
-1.4
1,522
-20.0
-2.8
20,112
21.2
4.9
6,330
1.8
9.1
5,173
13.0
-2.0
17,184
14.4
2.3
23,587
3.8
-9.6
54,639
51.7
10.1
15,398
12.4
13.8
1,11,663
0.7
21.2
8,181
16.8
11.5
5,794
6.5
3.2
7,94,874 15.3
4.9
EBDITA (INR M)
NET PROFIT (INR M)
Var
Var
Var
Var
Sep-25
Sep-25
% YoY % QoQ
% YoY % QoQ
43,127
-11.3
-0.8
16,864
18.9
0.9
12,090
15.9
6.4
3,080
214.7
46.4
46,033
1.2
-0.2
-66,147
Loss
Loss
4,00,429 20.2
2.4
23,186
LP
43.7
4,007
81.5
-12.5
980
540.4
-33.2
1,315
9.3
15.4
1,159
9.3
2.6
2,185
26.3
18.9
1,065
14.6
0.6
30,306
79.9
8.7
8,363
-2.0
12.5
1,18,444 22.4
15.2
43,644
3.9
-1.1
92,182
4.9
13.6
37,188
6.2
7.0
4,225
43.6
-29.5
1,993
-0.9
-38.6
37,344
-0.3
-9.8
10,522
-2.3
-0.7
2,90,008 17.4
8.7
1,04,914
4.4
1.1
4,124
198.7
10.9
2,667
395.6
12.4
2,173
3.4
17.5
1,112
1.1
37.1
1,268
6.9
16.3
847
3.8
16.0
11,176
14.7
42.9
7,687
15.8
52.2
250
8.4
-7.2
192
19.6
-9.9
2,657
20.5
17.2
1,266
45.5
26.6
3,149
39.3
173.8
2,997
70.3
1,099.0
2,196
-1.7
-18.6
1,274
13.4
-20.7
1,174
15.7
5.1
946
31.4
1.5
1,296
-3.8
-2.7
1,176
-13.0
-23.2
5,713
14.0
-0.8
2,826
-12.8
-4.6
2,814
2.5
1.3
2,625
205.7
1.1
25,845
8.5
-54.6
-6,610
Loss
PL
2,081
31.0
11.4
1,219
44.7
11.9
1,386
6.0
-1.3
330
11.5
-13.8
283
-23.3
-0.5
119
-36.8
9.7
772
LP
7.5
1,345
LP
-3.3
501
9.6
26.6
128
-12.9
165.7
688
43.7
-13.2
420
41.8
-16.7
20,913
19.0
-0.4
6,047
49.5
8.8
3,036
-4.9
-4.8
1,928
-6.7
-4.7
-10,445
Loss
Loss
-11,258
Loss
Loss
2,271
15.7
16.5
1,190
20.9
25.1
17,881
13.5
37.2
3,317
LP
242.8
1,053
12.5
10.2
745
5.5
13.2
336
LP
36.3
-58
Loss
Loss
1,04,592 17.1
-16.4
24,478
227.9
-43.4
Indus Towers
352
Tata Comm
1611
Vodafone Idea
9
Telecom
ACME Solar
288
Indian Energy Exch.
141
Inox Wind
142
JSW Energy
537
NTPC
340
Power Grid Corp.
281
Suzlon Energy
55
Tata Power
391
Utilities
APL Apollo Tubes
1732
Astral
1377
Cello World
574
Coromandel International
2251
Dreamfolks Services
102
EPL
214
Eternal
329
Godrej Agrovet
696
Gravita India
1560
Indiamart Inter.
2400
Indian Hotels
723
Info Edge
1339
Interglobe Aviation
5609
Kajaria Ceramics
1190
Lemon Tree Hotel
166
MTAR Tech
1899
One 97 Comm.
1149
Prince Pipes
325
Safari Inds.
2182
SBI Cards
875
Supreme Inds.
4190
Swiggy
418
Time Technoplast
222
UPL
661
Va Tech Wabag
1432
VIP Inds.
416
Others
PL: Profit to Loss; LP: Loss to Profit
October 2025
37
 Motilal Oswal Financial Services
Reform. Resilience. Revelry!
Mastering the game!
Ready reckoner: Quarterly performance
CMP
(INR)
Financials
AU Small Finance
Axis Bank
Bandhan Bank
DCB Bank
Equitas Small Fin.
Federal Bank
HDFC Bank
ICICI Bank
IDFC First Bank
IndusInd Bank
Kotak Mahindra Bank
RBL Bank
Banks-Private
Bank of Baroda
Canara Bank
Indian Bank
Punjab National Bank
State Bank
Union Bank
Banks-PSU
HDFC Life Insur.
ICICI Lombard
ICICI Pru Life
Life Insurance Corp.
Max Financial
Niva Bupa Health
SBI Life Insurance
Star Health
Insurance
AAVAS Financiers
Bajaj Finance
Bajaj Housing
Can Fin Homes
Chola. Inv & Fin.
CreditAccess
Five-Star Business
Fusion Finance
HDB Financial
Home First Fin.
IIFL Finance
L&T Finance
LIC Housing Fin
M & M Financial
Manappuram Finance
MAS Financial
Muthoot Finance
PFC
PNB Housing
Poonawalla Fincorp
REC
Repco Home Fin
October 2025
726
1159
163
129
57
194
965
1372
69
744
2063
275
260
124
737
113
864
139
765
1905
596
905
1622
82
1800
458
1640
988
112
784
1606
1401
535
193
770
1235
452
259
577
273
287
304
3144
411
882
502
378
364
RECO
NII (INR M)
Var
Var
Sep-25
% YoY
% QoQ
2.5
-2.3
-12.9
11.1
-7.0
-2.3
2.3
5.5
4.6
-17.8
4.2
-5.9
0.6
-5.4
-3.7
2.2
0.2
-2.5
-4.1
-2.5
13.1
-2.8
10.3
8.1
15.9
18.5
15.2
7.5
9.5
17.1
21.7
31.3
10.7
22.8
-0.7
16.9
-33.2
17.5
33.8
6.9
8.8
0.9
16.7
-17.7
27.8
36.7
18.4
14.2
21.4
14.4
11.3
-1.0
-2.9
-6.8
-2.6
-5.0
-1.0
-2.0
-2.3
1.5
-5.2
0.8
2.6
-2.0
-3.9
-0.4
-0.4
-0.4
-1.2
-4.8
-1.7
28.7
-4.9
48.7
8.7
40.2
17.8
32.0
1.1
15.4
2.0
5.1
5.7
3.6
4.6
2.3
4.5
-2.4
2.9
8.0
10.6
4.0
-3.5
5.0
-2.5
3.0
-0.9
-4.6
1.3
6.2
2.1
1.5
OP. PROFITS (INR M)
Var
Var
Sep-25
% YoY
% QoQ
11,246
1,03,466
14,148
2,672
2,176
14,883
2,53,963
1,73,313
19,295
19,364
53,274
6,880
6,74,679
71,485
77,455
47,752
69,581
2,69,396
64,848
6,00,517
10,244
-2,625
5,765
27,380
5,962
-1,018
15,790
-2,465
59,032
2,049
88,534
8,468
3,180
24,462
6,713
4,300
1,003
14,543
1,797
9,199
16,716
17,885
14,436
6,443
1,587
26,790
63,259
6,449
3,282
57,021
1,470
-0.6
-3.4
-23.7
4.7
-37.8
-4.9
2.8
3.6
-1.7
-46.2
4.5
-24.4
-2.0
-24.6
1.2
1.0
1.5
-8.0
-20.1
-9.2
9.2
Loss
-1.6
-6.9
16.4
Loss
8.9
Loss
-1.3
5.2
21.2
18.8
10.5
27.3
-0.1
13.2
-64.7
18.2
42.5
7.8
5.1
2.7
20.7
-37.6
23.6
39.9
18.7
15.3
15.6
16.5
7.5
-14.3
-10.1
-15.2
-18.3
-30.9
-4.4
-28.9
-7.5
-13.8
-24.6
-4.2
-2.1
-18.0
-13.2
-9.4
0.1
-1.7
-11.8
-6.1
-9.1
26.6
Loss
26.1
40.8
78.0
Loss
44.9
PL
41.2
7.6
4.3
6.1
4.6
1.4
2.8
6.8
15.8
3.7
6.8
5.9
6.1
-5.5
6.7
-2.5
2.5
-3.9
30.9
2.1
1.1
13.4
2.4
NET PROFIT (INR M)
Var
Var
Sep-25
% YoY
% QoQ
4,947
55,331
3,068
1,419
309
8,438
1,67,323
1,19,401
3,441
3,127
32,684
1,881
4,01,368
42,943
42,552
29,351
47,856
1,67,274
35,290
3,65,266
4,751
7,008
2,998
80,886
1,543
381
5,439
547
1,03,552
1,524
48,881
6,204
2,386
11,324
912
2,837
7
5,671
1,291
2,961
7,246
13,228
5,024
1,940
863
19,085
53,512
5,434
744
44,253
1,089
-13.4
-20.0
-67.3
-8.7
140.1
-20.2
-0.5
1.7
71.5
-76.5
-2.3
-15.4
-7.3
-18.0
6.0
8.4
11.2
-8.8
-25.2
-7.1
9.7
1.0
19.1
6.1
10.7
192.5
2.7
-50.8
5.7
3.0
21.8
13.7
12.8
17.6
-51.0
5.9
LP
-4.0
39.9
LP
4.0
-0.5
36.0
-66.1
12.6
52.5
22.4
15.7
LP
10.5
-3.2
-14.8
-4.7
-17.5
-9.8
LP
-2.1
-7.8
-6.5
-25.6
-48.2
-0.4
-6.1
-6.7
-5.4
-10.5
-1.3
185.7
-12.7
-14.3
-1.9
-13.1
-6.2
-0.4
-26.4
79.4
LP
-8.5
-79.2
-22.9
9.4
2.6
6.4
6.6
-0.3
51.6
6.5
LP
-0.1
8.5
26.9
3.4
-2.7
-5.1
46.4
2.8
-6.7
18.9
1.9
18.8
-0.6
0.9
38
Buy
20,233
Neutral 1,31,679
Neutral 25,690
Buy
5,656
Buy
7,461
Buy
23,126
Buy
3,08,205
Buy
2,11,453
Neutral 50,065
Neutral 43,977
Buy
73,148
Buy
15,190
9,15,883
Neutral 1,09,910
Buy
89,705
Buy
63,324
Buy
1,05,382
Buy
4,05,757
Neutral 86,774
8,60,852
Buy
1,91,452
Buy
48,867
Buy
1,33,161
Buy 12,96,098
Buy
89,681
Buy
14,372
Buy
2,35,058
Buy
39,825
20,48,513
Neutral
2,831
Neutral 1,07,528
Neutral
9,369
Neutral
3,760
Buy
33,313
Buy
9,264
Buy
6,036
Buy
2,664
Neutral 21,531
Buy
2,095
Buy
14,318
Buy
23,697
Neutral 19,926
Buy
21,123
Neutral 13,458
Buy
2,447
Neutral 34,433
Buy
52,189
Buy
7,556
Buy
6,786
Buy
56,829
Neutral
1,843
 Motilal Oswal Financial Services
Reform. Resilience. Revelry!
Mastering the game!
NII (INR M)
OP. PROFITS (INR M)
NET PROFIT (INR M)
RECO
Var
Var
Var
Var
Var
Var
Sep-25
Sep-25
Sep-25
% YoY
% QoQ
% YoY
% QoQ
% YoY
% QoQ
Shriram Finance
649
Buy
60,497
10.7
4.8
44,096
10.7
5.2
21,903
5.8
1.6
Spandana Sphoorty
254
Neutral
1,066
-69.4
-18.0
-565
PL
Loss
-2,419
Loss
Loss
NBFC - Lending
5,14,560
14.6
2.4
4,23,116
14.4
7.7
2,55,899
20.8
5.3
360 One WAM
1037
Buy
7,331
24.5
10.7
3,383
16.9
8.8
3,032
22.6
5.6
Aditya Birla AMC
799
Buy
4,598
8.4
2.8
2,745
9.6
3.2
2,496
3.0
-9.9
Anand Rathi Wealth
2883
Neutral
2,906
19.9
6.1
1,370
31.7
7.2
1,009
32.3
7.4
Angel One
2176
Buy
8,348
-14.6
5.0
2,772
-51.5
68.6
2,051
-51.6
79.2
BSE
2081
Neutral 10,143
35.9
5.8
6,299
61.9
0.6
5,082
46.9
-4.0
Cams Services
3822
Buy
3,681
0.8
4.0
1,655
-2.8
7.3
1,170
-3.2
8.3
CDSL
1476
Neutral
2,983
-7.4
15.2
1,559
-22.0
19.5
1,187
-26.7
15.9
HDFC AMC
5555
Buy
10,115
14.0
4.5
7,997
13.7
3.5
6,600
14.5
-11.7
KFin Technologies
1080
Neutral
3,041
8.4
10.9
1,296
2.5
13.9
910
1.9
17.8
MCX
7997
Neutral
3,760
31.7
0.7
2,383
32.8
-1.4
1,962
27.7
-3.4
Nippon Life AMC
879
Buy
6,332
10.8
4.4
4,090
9.3
5.4
3,464
-3.8
-12.5
NSDL
1203
Neutral
3,334
-6.5
6.8
1,064
-5.7
11.8
980
1.8
9.3
Nuvama Wealth
6489
Buy
7,496
1.3
-2.7
3,083
-11.3
-11.7
2,333
-9.4
-11.6
Prudent Corp.
2642
Neutral
3,066
7.2
4.4
683
-0.6
1.5
529
2.8
2.2
UTI AMC
1308
Buy
3,916
5.0
3.2
1,802
-1.5
4.5
1,804
-31.4
-28.9
NBFC - Non Lending
81,050
8.8
4.9
42,183
3.6
6.0
34,609
-0.1
-3.7
PL: Profit to Loss; LP: Loss to Profit;
For Banks: Sales = Net Interest Income, EBITDA = Operating Profits; For Life Insurance: Sales = Net
Premium, EBITDA = Operating Profits
CMP
(INR)
October 2025
39
 Motilal Oswal Financial Services
Reform. Resilience. Revelry!
Mastering the game!
Ready reckoner: Full year valuations
Company
Name
Automobiles
Amara Raja Energy
Apollo Tyres
Ashok Leyland
Bajaj Auto
Balkrishna Inds
Bharat Forge
Bosch
CEAT
CIE Automotive
Craftsman Auto
Eicher Motors
Endurance Tech.
Escorts Kubota
Exide Inds.
Happy Forgings
Hero Motocorp
Hyundai Motor
Mahindra & Mahindra
Maruti Suzuki
Motherson Wiring
MRF
Samvardhana Motherson
Sona BLW Precis.
Tata Motors
Tube Investments
TVS Motor
Capital Goods
ABB India
Bharat Dynamics
Bharat Electronics
Cummins India
Hind.Aeronautics
Hitachi Energy
Kalpataru Proj.
KEC International
Kirloskar Oil
Larsen & Toubro
Siemens
Siemens Energy
Thermax
Triveni Turbine
Zen Technologies
Cement
ACC
Ambuja Cements
Birla Corporation
Dalmia Bharat
Grasim Industries
India Cements
J K Cements
JK Lakshmi Cem.
JSW Cement
Ramco Cements
Shree Cement
Ultratech Cement
Chemicals
Alkyl Amines
Atul
Clean Science
Deepak Nitrite
Ellenbarrie Industrial
October 2025
EPS (INR)
PE (x)
PB (x)
ROE (%)
FY26E FY27E FY28E FY26E FY27E FY28E FY26E FY27E FY28E FY26E FY27E
29.6 24.4 20.6
4.7
4.2
3.6
16.0 17.1
993
Neutral 45.4 54.7 60.7 21.9 18.2 16.4
2.3
2.1
1.9
12.0 12.8
468
Buy
24.0 29.1 32.1 19.5 16.1 14.6
1.5
1.4
1.3
10.0 11.4
141
Buy
6.0
7.2
8.5
23
20
16.7
6.3
5.5
4.7
28.8 30.0
8,619 Neutral 329.0 362.1 396.5 26.2 23.8 21.7
6.9
6.4
5.9
27.4 27.9
2,304 Neutral 83.6 103.5 111.7 27.6 22.3 20.6
3.8
3.3
2.9
14.6 16.0
1,219 Neutral 24.2 33.0 40.9 50.4 37.0 29.8
5.8
5.3
4.7
12.0 14.9
38,338 Neutral 824.3 976.1 1,113.4 46.5 39.3 34.4
7.3
6.7
6.0
16.6 17.9
3,488
Buy 156.8 207.8 248.3 22.2 16.8 14.0
2.9
2.6
2.3
13.7 16.2
413
Buy
21.7 22.9 23.8 19.0 18.1 17.3
2.2
2.0
1.8
11.9 11.5
6,725 Neutral 156.2 229.2 303.4 43.0 29.3 22.2
5.0
4.3
3.7
12.3 15.8
7,005
Sell 192.1 213.0 241.2 36.5 32.9 29.0
7.8
6.8
5.9
23.0 22.1
2,812
Buy
72.0 83.3 98.3 39.0 33.8 28.6
6.1
5.3
4.6
16.5 16.7
3,637 Neutral 119.5 128.6 134.4 30.4 28.3 27.1
3.9
3.5
3.2
13.4 13.0
395
Neutral 15.3 16.7 17.7 25.8 23.6 22.3
2.2
2.0
1.9
8.4
8.5
925
Buy
30.2 37.5 49.6 30.6 24.7 18.7
4.2
3.6
3.1
14.4 15.7
5,430
Buy 258.3 283.1 311.5 21.0 19.2 17.4
5.1
4.7
4.3
25.1 25.3
2,537
Buy
71.8 89.5 109.1 35.3 28.3 23.3 10.1
8.0
6.4
31.7 31.5
3,463
Buy 120.7 143.7 163.0 28.7 24.1 21.2
5.7
4.8
4.1
21.5 21.6
15,971
Buy 490.2 607.4 714.2 32.6 26.3 22.4
4.8
4.2
3.7
14.6 16.0
46
Buy
1.0
1.3
1.6
46.1 34.1 28.6 15.3 12.3 10.0 35.8 40.0
1,48,630
Sell 5,100.4 5,918.4 6,658.0 29.1 25.1 22.3
3.1
2.8
2.5
11.1 11.6
106
Buy
3.2
4.7
5.7
33.5 22.7 18.7
3.0
2.8
2.5
9.4
12.8
414
Neutral 8.8
10.4 11.5 46.8 39.8 36.0
4.4
4.1
3.8
9.5
10.6
718
Neutral 41.9 54.5 74.7 17.1 13.2
9.6
2.0
1.8
1.5
12.6 14.5
3,082
Buy
41.6 47.1 52.1 74.0 65.4 59.2 10.1
8.9
7.9
14.5 14.4
3,457 Neutral 76.1 91.3 106.4 45.4 37.8 32.5 12.6
9.9
7.9
31.6 29.3
39.1 33.2 27.4
7.3
6.3
5.4
18.7 18.9
5,198
Buy
80.0 95.1 111.9 64.9 54.6 46.5 14.2 12.8 11.6 22.8 24.6
1,542
Buy
28.2 37.8 52.0 54.6 40.7 29.7 11.7
9.5
7.5
21.5 23.3
407
Buy
8.2
9.8
11.7 49.5 41.4 34.7 11.9
9.5
7.7
24.0 22.9
3,848
Buy
83.5 98.4 114.3 46.1 39.1 33.7 13.4 11.8 10.4 30.9 32.1
4,803
Buy 141.2 161.2 197.9 34.0 29.8 24.3
7.7
6.5
5.4
22.6 21.8
18,168
Sell 177.4 238.4 319.9 102.4 76.2 56.8 15.4 12.8 10.4 15.9 17.6
1,241
Buy
57.0 74.9 87.0 21.8 16.6 14.3
2.6
2.3
2.0
12.8 14.8
854
Neutral 34.9 44.2 53.6 24.5 19.3 15.9
3.7
3.2
2.7
16.2 17.9
926
Buy
33.6 40.9 47.6 27.6 22.6 19.4
4.0
3.5
3.1
15.3 16.4
3,670
Buy 130.5 155.1 185.0 28.1 23.7 19.8
4.6
4.0
3.5
17.3 18.2
3,123 Neutral 75.8 66.9 77.8 41.2 46.7 40.2
6.2
5.4
4.8
14.9 11.7
3,400
Buy
32.4 41.5 61.4 105.0 81.9 55.4 27.7 20.7 15.1 26.4 25.3
3,167
Sell
68.0 79.8 94.6 46.6 39.7 33.5
6.4
5.7
5.0
14.6 15.2
524
Buy
11.8 14.0 16.8 44.5 37.4 31.2 11.2
9.2
7.6
27.7 27.1
1,464 Neutral 28.9 45.5 61.1 50.6 32.2 24.0
6.8
5.6
4.5
14.3 19.1
42.3 32.7 27.1
3.4
3.2
3.0
8.1
9.8
1,829 Neutral 89.9 117.2 135.6 20.3 15.6 13.5
1.7
1.6
1.4
8.9
10.6
571
Buy
10.2 14.5 17.4 56.1 39.4 32.7
2.5
2.4
2.3
4.6
6.3
1,212
Buy
67.9 84.8 95.9 17.9 14.3 12.6
1.3
1.2
1.1
7.2
8.4
2,232
Buy
70.4 68.6 83.0 31.7 32.5 26.9
2.3
2.1
2.0
7.4
6.8
2,792
Buy
85.1 105.5 127.4 32.8 26.5 21.9
3.3
3.2
3.1
-4.1
-1.1
391
Sell
-1.4
3.8
11.4 -275.4 103.7 34.4
1.3
1.2
1.2
-0.5
1.2
6,306
Buy 155.8 193.5 219.5 40.5 32.6 28.7
6.8
5.8
4.9
18.2 19.2
869
Buy
43.2 52.4 53.4 20.1 16.6 16.3
2.6
2.3
2.0
13.8 14.8
139
Neutral 2.3
2.9
3.6
60.1 47.3 38.9
3.1
2.8
2.6
7.4
6.2
992
Neutral 15.8 24.7 34.3 63.0 40.2 28.9
3.0
2.8
2.6
4.9
7.3
29,262 Neutral 448.7 551.1 683.9 65.2 53.1 42.8
4.7
4.4
4.1
7.4
8.6
12,119
Buy 264.2 354.0 427.8 45.9 34.2 28.3
4.7
4.3
3.9
10.6 13.2
36.7 28.7 25.4
3.9
3.5
3.1
10.5 12.1
1,900 Neutral 38.7 44.5 47.3 49.0 42.7 40.1
6.3
5.7
5.2
13.5 14.0
6,182
Buy 225.0 260.6 277.3 27.5 23.7 22.3
3.0
2.7
2.4
11.3 11.8
1,097 Neutral 31.1 39.2 44.7 35.3 28.0 24.5
6.9
5.7
4.8
21.3 22.3
1,842
Sell
47.9 61.7 64.1 38.4 29.9 28.8
4.2
3.8
3.4
11.5 13.3
470
Buy
9.4
15.6 18.7 49.9 30.2 25.1
6.4
5.3
4.4
17.5 19.3
CMP
(INR)
Reco
FY28E
17.6
12.8
11.6
30.2
28.3
15.2
16.7
18.5
17.1
11.0
17.9
21.8
17.2
12.3
8.4
18.0
25.7
30.6
20.7
16.4
38.5
11.7
14.1
11.0
17.2
14.1
27.0
19.5
26.2
25.2
22.1
32.8
22.2
19.2
15.0
18.6
16.8
19.1
11.9
27.2
15.9
26.7
20.9
11.0
11.1
7.1
8.8
7.7
1.5
3.6
18.5
13.3
7.0
9.4
9.9
14.5
12.3
13.5
11.4
21.2
12.4
19.1
40
 Motilal Oswal Financial Services
Reform. Resilience. Revelry!
Mastering the game!
Ready reckoner: Full year valuations
Company
Name
Fine Organic
Galaxy Surfactants
Navin Fluorine
NOCIL
P I Industries
SRF
Tata Chemicals
Vinati Organics
Consumer
Asian Paints
Britannia
Colgate
Dabur
Emami
Godrej Consumer
Hind. Unilever
Indigo Paints
ITC
Jyothy Labs
L T Foods
Marico
Nestle
P&G Hygiene
Page Industries
Pidilite Inds.
Radico Khaitan
Tata Consumer
United Breweries
United Spirits
Varun Beverages
Consumer Durables
Havells India
KEI Industries
Polycab India
R R Kabel
Voltas
EMS
Amber Enterp.
Avalon Tech
Cyient DLM
Data Pattern
Dixon Tech.
Kaynes Tech
Syrma SGS Tech.
Financials
Banks-Private
AU Small Finance
Axis Bank
Bandhan Bank
DCB Bank
Equitas Small Fin.
Federal Bank
HDFC Bank
ICICI Bank
IDFC First Bank
IndusInd Bank
Kotak Mahindra Bank
RBL Bank
Banks-PSU
Bank of Baroda
Canara Bank
Indian Bank
October 2025
CMP
(INR)
4,525
2,226
4,624
174
3,584
2,907
918
1,724
2,336
5,965
2,225
495
543
1,148
2,536
1,073
406
319
402
701
1,166
14,092
42,159
1,475
2,916
1,144
1,799
1,347
443
1,485
4,034
7,353
1,268
1,353
8,239
1,008
431
2,630
16,454
7,152
803
EPS (INR)
PE (x)
PB (x)
ROE (%)
FY26E FY27E FY28E FY26E FY27E FY28E FY26E FY27E FY28E FY26E FY27E
Sell 136.8 138.7 158.2 33.1 32.6 28.6
5.3
4.6
4.0
17.4 15.2
Buy
89.7 105.2 118.8 24.8 21.2 18.7
3.0
2.7
2.5
12.8 13.6
Neutral 88.5 112.4 134.5 52.3 41.1 34.4
6.3
5.6
5.0
14.2 14.5
Neutral 5.2
6.5
7.5
33.7 26.7 23.2
1.6
1.5
1.5
4.8
5.9
Buy
98.8 118.0 134.3 36.3 30.4 26.7
4.8
4.2
3.7
13.9 14.7
Buy
69.5 93.6 107.7 41.8 31.0 27.0
6.1
5.2
4.5
15.4 18.2
Neutral 34.8 54.4 60.6 26.4 16.9 15.1
1.1
1.0
1.0
4.1
6.1
Buy
50.4 58.5 69.7 34.2 29.5 24.8
5.5
4.8
4.1
17.3 17.4
44.3 38.8 35.1 10.6
9.9
9.2
24.0 25.6
Neutral 44.2 51.8 58.3 52.9 45.1 40.1 11.4 10.9 10.2 21.7 24.8
Neutral 103.6 121.6 138.3 57.6 49.0 43.1 28.8 23.9 19.5 53.4 53.3
Buy
51.7 58.2 63.3 43.1 38.2 35.1 38.4 38.3 36.9 86.8 100.4
Buy
11.1 12.6 13.8 44.5 39.2 35.8
7.5
7.3
7.1
17.6 18.9
Buy
20.7 22.7 24.6 26.2 23.9 22.1
7.9
7.0
6.4
31.7 31.1
Buy
21.8 26.7 31.1 52.8 43.0 36.9
9.3
9.0
8.5
18.1 21.3
Buy
46.1 52.4 56.7 55.0 48.4 44.7 11.8 11.4 11.0 21.7 24.0
Buy
31.3 36.5 42.2 34.3 29.4 25.5
4.5
3.9
3.4
13.7 14.1
Buy
17.0 18.7 20.0 23.8 21.7 20.3
7.0
6.7
6.5
29.8 31.5
Neutral 10.7 11.9 13.3 29.8 26.7 24.0
5.5
5.1
4.6
18.8 19.8
Buy
21.8 27.7 32.1 18.4 14.5 12.5
3.1
2.7
2.3
18.3 19.9
Buy
14.0 16.3 18.1 49.9 43.1 38.7 21.7 20.0 18.1 44.5 48.2
Neutral 16.9 19.7 21.9 68.9 59.2 53.2 51.9 47.7 43.8 78.2 83.9
Neutral 269.5 297.0 330.7 52.3 47.5 42.6 50.1 41.4 34.6 106.2 95.7
Buy 725.3 830.8 937.2 58.1 50.7 45.0 27.7 23.2 19.5 47.7 45.6
Neutral 24.1 27.7 31.6 61.2 53.3 46.7 13.6 12.1 10.7 23.6 24.0
Buy
40.6 51.9 63.8 71.8 56.2 45.7 12.5 10.6
8.9
17.4 18.9
Buy
16.7 19.9 21.8 68.4 57.5 52.5
5.0
4.7
4.4
8.1
9.1
Neutral 20.7 30.4 37.8
87
59
47.5 10.2
9.4
8.5
12.2 16.5
Neutral 21.3 23.6 26.7
63
57
50.4 10.4
8.8
7.4
16.4 15.4
Buy
8.9
10.8 12.8 49.8 41.2 34.6
8.0
6.9
6.0
17.0 18.0
48.4 39.9 33.4
8.1
7.0
6.0
16.7 17.5
Neutral 25.4 32.0 38.5 58.5 46.5 38.6
9.9
8.7
7.6
17.0 18.8
Buy
91.9 108.5 128.4 43.9 37.2 31.4
5.8
5.1
4.4
14.2 14.6
Buy 171.2 199.5 238.1 42.9 36.9 30.9
9.3
7.8
6.5
21.7 21.2
Neutral 37.0 40.9 48.2 34.3 31.0 26.3
5.8
5.0
4.3
18.0 17.2
Neutral 23.0 31.4 38.0 58.8 43.1 35.6
6.3
5.7
5.0
10.8 13.1
78.4 50.6 36.8 12.4 10.0
7.9
15.9 19.8
Buy 116.2 181.4 262.9 70.9 45.4 31.3 10.4
8.5
6.7
15.8 20.6
Buy
15.6 24.6 33.8 64.5 41.0 29.8
9.3
7.6
6.1
15.6 20.4
Buy
12.0 19.2 26.8 36.0 22.5 16.1
3.3
2.9
2.4
9.5
13.6
Neutral 48.2 62.8 80.6 54.6 41.9 32.6
8.3
7.0
5.7
16.4 18.1
Buy 173.5 275.2 361.7 94.8 59.8 45.5 24.8 17.7 12.9 29.8 34.5
Buy
82.2 132.9 196.2 87.0 53.8 36.5
9.2
7.8
6.4
14.1 16.4
Buy
15.3 22.4 30.6 52.6 35.9 26.2
7.2
6.0
5.0
14.5 18.3
Reco
18.8
Buy
34.9 48.7 63.3 20.8
Neutral 79.2 99.6 122.0 14.6
Neutral 14.9 21.9 26.9 10.9
Buy
22.9 32.2 43.6
5.6
Buy
0.2
5.5
8.8 275.3
Buy
15.6 19.5 25.8 12.4
Buy
47.1 54.3 62.9 20.5
Buy
73.1 82.1 96.1 18.8
Neutral 2.8
5.3
7.5
24.7
Neutral 36.5 62.2 83.1 20.4
Buy 105.4 125.7 153.0 19.6
Buy
17.3 31.3 43.9 15.9
8.6
Neutral 35.4 41.0 50.7
7.3
Buy
20.4 22.2 25.2
6.1
Buy
91.1 95.5 107.2 8.1
15.7
14.9
11.6
7.5
4.0
10.3
9.9
17.8
16.7
13.0
11.9
16.4
8.8
7.4
6.3
5.6
7.7
13.1
11.5
9.5
6.1
2.9
6.4
7.5
15.3
14.3
9.2
9.0
13.5
6.3
6.3
5.1
4.9
6.9
2.4
2.8
1.8
1.0
0.7
1.1
1.3
2.7
2.9
1.3
0.9
2.4
1.0
1.2
1.0
1.0
1.3
2.2
2.3
1.6
0.9
0.6
1.0
1.2
2.4
2.5
1.2
0.8
2.1
1.0
1.1
0.9
0.9
1.2
1.9
2.0
1.4
0.8
0.5
0.9
1.0
2.1
2.2
1.1
0.8
1.8
0.9
1.0
0.8
0.9
1.0
12.9
14.2
12.9
9.6
12.7
0.4
10.9
13.7
16.8
5.2
4.3
11.7
6.6
14.4
13.9
18.7
18.3
13.8
17.1
14.4
13.0
15.7
10.3
12.2
14.3
16.4
9.3
7.1
12.6
11.4
14.9
14.7
18.3
16.9
FY28E
15.1
13.9
15.4
6.5
14.7
18.0
6.5
18.0
26.2
26.3
49.8
107.0
20.1
30.3
23.6
25.1
14.3
32.5
20.0
19.5
49.1
85.8
88.6
43.5
24.3
19.6
9.4
18.7
14.7
18.6
18.0
19.7
15.0
21.1
17.6
14.1
21.5
23.8
22.6
16.3
19.3
32.7
20.1
20.8
14.5
18.6
15.4
14.4
18.2
14.8
14.3
14.7
16.5
12.1
8.8
13.5
14.7
15.6
16.2
18.9
16.7
41
726
1,159
163
129
57
194
965
1,372
69
744
2,063
275
260
124
737
 Motilal Oswal Financial Services
Reform. Resilience. Revelry!
Mastering the game!
Ready reckoner: Full year valuations
Company
Name
Punjab National Bank
State Bank
Union Bank
Insurance
HDFC Life Insur.
ICICI Lombard
ICICI Pru Life
Life Insurance Corp.
Max Financial
Niva Bupa Health
SBI Life Insurance
Star Health
NBFC - Lending
AAVAS Financiers
Aditya Birla Cap
Bajaj Finance
Bajaj Housing
Can Fin Homes
Chola. Inv & Fin.
CreditAccess
Five-Star Business
Fusion Finance
HDB Financial
Home First Fin.
IIFL Finance
Indostar Capital
L&T Finance
LIC Housing Fin
M & M Financial
Manappuram Finance
MAS Financial
Muthoot Finance
PFC
Piramal Enterprises
PNB Housing
Poonawalla Fincorp
REC
Repco Home Fin
Shriram Finance
Spandana Sphoorty
NBFC - Non Lending
360 ONE WAM
Aditya Birla AMC
Anand Rathi Wealth
Angel One
BSE
Cams Services
CDSL
HDFC AMC
KFin Technologies
MCX
Nippon Life AMC
NSDL
Nuvama Wealth
Prudent Corp.
UTI AMC
Healthcare
Ajanta Pharma
Alembic Pharma
Alkem Lab
Apollo Hospitals
Aurobindo Pharma
October 2025
CMP
(INR)
113
864
139
765
1,905
596
905
1,622
82
1,800
458
1,640
300
988
112
784
1,606
1,401
535
193
770
1,235
452
252
259
577
273
287
304
3,144
411
1,125
882
502
378
364
649
254
1,037
799
2,883
2,176
2,081
3,822
1,476
5,555
1,080
7,997
879
1,203
6,489
2,642
1,308
2,399
904
5,460
7,442
1,087
EPS (INR)
PE (x)
PB (x)
ROE (%)
FY26E FY27E FY28E FY26E FY27E FY28E FY26E FY27E FY28E FY26E FY27E
Buy
14.1 18.4 21.3
8.0
6.1
5.3
0.9
0.8
0.8
12.9 15.0
Buy
87.4 101.1 119.6 9.9
8.5
7.2
1.4
1.2
1.1
15.4 15.3
Neutral 21.2 23.4 27.2
6.6
5.9
5.1
0.9
0.8
0.7
14.3 14.1
19.6 17.7 16.0
4.7
3.9
3.2
24.0 21.9
Buy
9.4
10.5 12.0 81.4 72.6 63.5
2.6
2.2
1.9
16.1 16.5
Buy
61.9 71.4 80.9 30.8 26.7 23.5
5.7
4.9
4.2
19.8 19.6
Buy
9.9
11.5 13.8 60.4 51.8 43.3
1.6
1.4
1.2
12.8 13.0
Buy
79.9 87.9 95.6 11.3 10.3
9.5
0.7
0.6
0.5
11.6 11.4
Buy
11.9 14.1 15.6 136.0 115.4 104.0 2.3
2.0
1.6
19.2 19.4
Buy
0.7
1.7
3.3 111.7 48.0 24.8
3.8
3.5
3.1
3.8
7.7
Buy
24.8 26.6 29.1 72.6 67.7 61.9
2.2
1.8
1.5
18.8 18.4
Buy
12.8 17.8 24.5 35.8 25.8 18.7
3.5
3.1
2.6
10.2 12.6
16.3 13.5 11.0
2.5
2.1
1.8
15.0 15.8
Neutral 80.3 97.6 117.4 20.4 16.8 14.0
2.6
2.3
1.9
13.6 14.4
Buy
15.0 19.1 24.7 19.9 15.7 12.1
2.3
2.1
1.8
12.2 13.9
Neutral 32.9 42.6 53.8 30.0 23.2 18.3
5.4
4.5
3.7
19.4 21.1
Neutral 3.1
3.8
4.7
36.1 29.4 23.9
4.1
3.6
3.1
12.1 13.1
Neutral 72.2 79.0 91.9 10.9
9.9
8.5
1.8
1.6
1.3
17.6 16.7
Buy
61.3 79.0 97.5 26.2 20.3 16.5
4.5
3.7
3.0
19.4 19.9
Buy
52.9 106.0 131.3 26.5 13.2 10.7
2.9
2.4
1.9
11.4 19.6
Buy
39.1 43.9 54.6 13.7 12.2
9.8
2.1
1.8
1.5
16.8 16.1
Buy
0.6
19.9 27.2 346.0 9.7
7.1
1.5
1.1
1.0
0.4
13.4
Neutral 31.3 41.2 52.4 24.6 18.7 14.7
3.1
2.6
2.2
14.1 15.1
Buy
51.7 64.2 77.4 23.9 19.2 15.9
3.0
2.6
2.3
15.7 14.5
Buy
35.6 54.9 67.4 12.7
8.2
6.7
1.4
1.2
1.0
11.5 15.7
Buy
46.6 18.0 26.9
5.4
14.0
9.4
0.9
0.9
0.8
19.3
6.4
Buy
12.0 16.1 20.3 21.5 16.0 12.7
2.3
2.1
1.8
11.2 13.6
Neutral 97.4 105.6 114.2 5.9
5.5
5.1
0.8
0.7
0.6
14.0 13.6
Buy
18.4 23.3 27.3 14.8 11.7 10.0
1.5
1.4
1.3
11.5 12.6
Neutral 10.4 18.8 24.7 27.4 15.2 11.6
1.7
1.6
1.4
6.9
11.1
Buy
19.4 25.5 29.0 15.7 11.9 10.5
1.9
1.7
1.5
13.1 15.1
Neutral 195.5 221.5 250.0 16.1 14.2 12.6
3.6
3.0
2.5
24.7 23.0
Buy
59.4 61.1 69.7
6.9
6.7
5.9
1.3
1.1
1.0
20.0 18.1
Neutral 63.7 105.4 169.1 17.7 10.7
6.7
0.9
0.8
0.8
5.2
8.1
Buy
87.5 98.3 119.4 10.1
9.0
7.4
1.2
1.1
0.9
12.7 12.7
Buy
8.7
22.4 31.6 57.8 22.4 15.9
3.9
3.4
2.8
7.6
16.2
Buy
68.4 72.9 90.7
5.5
5.2
4.2
1.1
0.9
0.8
21.4 19.6
Neutral 69.9 73.6 84.4
5.2
4.9
4.3
0.6
0.5
0.5
12.4 11.7
Buy
49.4 59.9 71.3 13.1 10.8
9.1
1.9
1.7
1.4
15.4 16.4
Neutral -83.1 30.1 48.7
-3.1
8.4
5.2
1.0
0.9
0.7
-27.7 11.1
37.8 31.9 27.2
9.5
8.2
7.1
25.1 25.8
Buy
30.8 36.4 40.2 33.7 28.5 25.8
5.1
4.3
3.7
16.3 16.8
Buy
37.0 41.4 47.2 21.6 19.3 16.9
5.5
4.9
4.3
26.9 26.8
Neutral 49.0 60.7 72.6 58.8 47.5 39.7 24.0 17.0 12.5 48.7 41.9
Buy
91.0 130.7 168.7 23.9 16.7 12.9
2.9
2.6
2.3
14.0 18.0
Neutral 50.8 56.3 65.4 40.9 37.0 31.8 14.1 10.9
8.6
34.4 29.5
Buy
98.5 115.6 136.2 38.8 33.1 28.1 14.3 12.2 10.4 39.7 39.8
Neutral 21.8 28.5 33.8 67.7 51.8 43.7 15.8 13.9 11.9 24.5 28.6
Buy 131.8 150.8 172.1 42.2 36.8 32.3 13.4 12.3 11.2 33.2 34.9
Neutral 21.1 25.2 30.5 51.1 42.9 35.4 12.9 11.4
9.5
26.7 28.3
Neutral 169.9 203.4 234.4 47.1 39.3 34.1 19.8 18.0 16.3 43.8 47.9
Buy
23.7 27.4 31.6 37.2 32.1 27.9 12.9 12.7 12.4 35.1 39.8
Neutral 18.0 21.6 26.0 66.6 55.6 46.3 10.2
8.7
7.4
16.6 16.9
Buy 292.9 351.2 416.2 22.2 18.5 15.6
5.8
5.1
4.4
28.1 29.7
Neutral 53.4 67.3 85.8 49.5 39.2 30.8 63.3 49.5 38.4 28.9 28.3
Buy
68.3 79.2 93.6 19.1 16.5 14.0
3.1
2.9
2.7
16.4 18.1
33.8 29.5 25.8
4.8
4.2
3.7
14.1 14.2
Buy
83.8 97.0 109.3 28.6 24.7 22.0
6.6
5.5
4.6
25.1 24.3
Neutral 34.9 45.4 52.1 25.9 19.9 17.3
3.1
2.7
2.4
12.4 14.4
Neutral 206.3 182.6 209.5 26.5 29.9 26.1
4.7
4.3
3.9
19.2 15.1
Buy 126.7 152.2 188.8 58.8 48.9 39.4 10.4
8.6
7.1
20.1 19.9
Buy
63.8 77.7 93.0 17.0 14.0 11.7
1.7
1.6
1.4
10.8 11.8
Reco
FY28E
15.4
15.5
14.6
20.1
16.7
19.1
13.1
11.3
19.5
13.3
18.4
15.1
16.6
14.9
15.9
22.2
14.1
16.9
20.2
19.9
17.1
14.7
16.4
15.2
16.7
8.9
15.3
13.2
13.4
12.7
14.9
21.6
18.2
11.9
13.7
19.4
21.0
12.0
17.1
15.1
26.2
15.8
27.1
36.2
20.5
27.1
39.9
29.4
36.4
29.3
50.0
44.9
17.2
30.4
28.1
20.2
14.2
23.0
14.5
15.6
20.3
12.5
42
 Motilal Oswal Financial Services
Reform. Resilience. Revelry!
Mastering the game!
Ready reckoner: Full year valuations
Company
Name
Biocon
Blue Jet Healthcare
Cipla
Divis Labs
Dr Agarwals Health.
Dr Reddy’ s Labs
Eris Lifescience
Gland Pharma
Glenmark Pharma
Global Health
Granules India
GSK Pharma
IPCA Labs.
Laurus Labs
Laxmi Dental
Lupin
Mankind Pharma
Max Healthcare
Piramal Pharma
Sun Pharma
Torrent Pharma
Zydus Lifesciences
Infrastructure
G R Infraproject
IRB Infra
KNR Constructions
Logistics
Adani Ports
Blue Dart Express
Concor
Delhivery
JSW Infra
Mahindra Logistics
TCI Express
Transport Corp.
VRL Logistics
Media
PVR Inox
Sun TV
Zee Entertainment
Metals
Coal India
Hindalco
Hindustan Zinc
Jindal Stainless
Jindal Steel
JSW Steel
Nalco
NMDC
SAIL
Tata Steel
Vedanta
Oil & Gas
Aegis Logistics
BPCL
Castrol India
GAIL
Gujarat Gas
Gujarat State Petronet
HPCL
Indraprastha Gas
IOC
October 2025
CMP
(INR)
347
662
1,514
5,711
504
1,246
1,623
1,981
1,959
1,306
542
2,695
1,328
872
328
1,982
2,439
1,113
199
1,636
3,563
992
1,231
41
199
1,422
5,715
527
435
317
348
733
1,197
274
1,099
602
114
389
766
481
762
1,064
1,146
215
76
135
168
465
787
340
201
175
435
318
434
209
150
Reco
Buy
Buy
Neutral
Neutral
Buy
Neutral
Neutral
Buy
Buy
Buy
Buy
Neutral
Buy
Buy
Buy
Neutral
Buy
Buy
Buy
Buy
Neutral
Neutral
Buy
Neutral
Neutral
Buy
Buy
Buy
Buy
Buy
Neutral
Neutral
Buy
Buy
Neutral
Neutral
Neutral
Buy
Buy
Neutral
Buy
Buy
Buy
Neutral
Buy
Neutral
Neutral
Neutral
Neutral
Neutral
Buy
Buy
Buy
Neutral
Buy
Buy
Neutral
EPS (INR)
PE (x)
PB (x)
ROE (%)
FY26E FY27E FY28E FY26E FY27E FY28E FY26E FY27E FY28E FY26E FY27E
4.1
8.8
11.6 85.2 39.2 29.8
1.9
1.8
1.7
2.2
4.7
25.3 32.1 38.6 26.2 20.6 17.2
7.4
5.6
4.3
32.8 30.9
61.7 65.7 73.0 24.5 23.0 20.7
3.4
3.0
2.7
13.9 13.0
90.5 120.3 140.2 63.1 47.5 40.7
9.1
8.0
7.1
15.2 18.0
3.7
5.1
7.9 134.8 98.0 64.2
8.0
7.4
6.1
7.8
67.0 63.1 68.5 18.6 19.8 18.2
2.7
2.4
2.1
15.4 12.7
37.7 54.4 62.5 43.1 29.8 26.0
6.8
5.6
4.6
16.8 20.6
55.6 68.4 81.1 35.6 28.9 24.4
3.2
2.9
2.6
9.5
10.6
58.9 77.9 91.1 33.3 25.1 21.5
5.3
4.4
3.7
17.2 19.2
24.2 30.3 36.8 54.1 43.1 35.5
8.9
7.6
6.5
17.7 19.1
23.0 30.7 37.6 23.6 17.6 14.4
3.1
2.7
2.3
14.1 16.3
57.6 67.2 76.4 46.8 40.1 35.3 18.6 14.6 11.5 39.7 36.4
40.9 50.8 60.1 32.5 26.1 22.1
4.3
3.8
3.3
14.0 15.4
12.1 15.3 18.6 71.9 56.9 47.0
9.1
8.0
7.0
13.4 15.0
8.8
12.2 15.0 37.3 27.0 21.8
7.0
5.6
4.4
20.7 23.0
95.1 97.3 99.8 20.8 20.4 19.9
4.1
3.4
2.9
21.9 18.2
44.9 60.9 73.8 54.3 40.0 33.0
6.4
5.7
5.0
12.3 15.0
18.7 24.3 25.6 59.6 45.8 43.4
8.9
7.5
6.4
16.0 17.8
0.9
2.3
5.2 209.9 86.3 38.5
2.9
2.8
2.6
1.5
3.6
51.1 59.5 66.2 32.0 27.5 24.7
4.8
4.2
3.7
15.9 16.3
69.9 84.5 104.1 51.0 42.1 34.2
6.6
5.5
4.6
28.3 28.6
45.1 42.8 47.1 22.0 23.2 21.1
3.6
3.1
2.8
17.5 14.4
18.3 14.0 11.0
1.3
1.2
1.1
6.9
8.3
79.9 101.1 116.5 15.4 12.2 10.6
1.4
1.2
1.1
9.3
10.7
2.2
2.8
3.9
19.2 15.0 10.8
1.2
1.1
1.0
6.4
7.7
8.7
14.4 15.1 23.0 13.9 13.2
1.3
1.2
1.1
6.0
9.2
26.7 22.5 19.4
4.2
3.6
3.1
15.6 16.0
62.7 73.1 82.0 22.7 19.5 17.3
4.2
3.5
3.0
19.9 19.6
134.1 201.1 215.8 42.6 28.4 26.5
7.2
5.9
4.9
18.2 22.8
18.3 22.8 26.4 28.8 23.1 19.9
3.0
2.8
2.6
10.9 12.6
4.8
6.1
8.0
89.7 71.8 54.0
3.3
3.2
3.0
3.8
4.5
7.5
8.9
12.5 42.3 35.7 25.3
6.1
5.3
4.4
15.3 15.8
3.9
17.5 24.0 89.8 20.0 14.5
2.9
2.6
2.2
4.6
13.4
26.1 33.2 36.3 28.1 22.1 20.2
3.4
3.0
2.7
12.5 14.4
61.5 66.9 76.2 19.5 17.9 15.7
3.6
3.1
2.6
19.8 18.2
12.6 14.8 16.5 21.7 18.5 16.6
3.9
3.7
3.4
19.2 20.6
17.1 15.9 14.3
1.4
1.3
1.3
8.3
8.5
26.7 29.9 38.5 41.2 36.7 28.5
1.5
1.4
1.4
3.6
3.9
43.4 44.4 46.3 13.9 13.6 13.0
1.9
1.8
1.6
13.7 12.9
7.1
8.5
10.2 16.2 13.4 11.1
0.9
0.9
0.8
5.8
6.7
13.3 10.8
9.8
2.3
2.0
1.8
17.5 18.8
54.7 59.9 61.6
7.1
6.5
6.3
2.1
1.8
1.6
29.2 27.6
69.2 74.0 80.2 11.1 10.3
9.6
1.5
1.4
1.2
14.8 13.9
29.4 32.0 34.2 16.4 15.0 14.1
9.8
7.0
5.3
73.0 54.3
36.4 44.7 49.2 21.0 17.0 15.5
3.2
2.8
2.4
15.4 16.2
58.8 82.8 93.3 18.1 12.8 11.4
2.0
1.8
1.6
11.9 14.9
44.6 72.4 89.9 25.7 15.8 12.8
3.1
2.6
2.2
12.9 18.0
19.1 19.4 20.1 11.2 11.1 10.7
1.9
1.7
1.5
18.3 16.1
8.6
9.5
10.2
8.9
8.0
7.5
1.9
1.6
1.4
23.4 22.2
5.3
13.4 14.4 25.7 10.1
9.4
0.9
0.9
0.8
3.6
8.8
8.9
13.0 14.8 18.9 12.9 11.3
2.4
2.2
2.0
12.8 17.8
40.2 47.9 55.3 11.6
9.7
8.4
3.7
3.1
2.5
35.0 34.8
15.9 15.8 15.0
1.6
1.5
1.4
10.2
9.4
22.0 24.1 25.5 35.8 32.6 30.8
5.4
4.9
4.4
15.8 15.7
39.0 29.5 31.1
8.7
11.5 10.9
1.5
1.3
1.2
18.7 12.3
9.5
9.6
10.3 21.2 20.9 19.5
8.1
7.5
7.0
39.5 37.1
12.9 14.6 15.4 13.6 12.0 11.3
1.4
1.3
1.2
11.5 12.1
16.3 18.8 21.7 26.6 23.1 20.0
3.3
3.0
2.7
12.7 13.5
12.9 13.6 14.3 24.7 23.4 22.2
1.6
1.5
1.4
6.6
6.6
59.2 44.0 42.8
7.3
9.9
10.1
1.5
1.3
1.2
22.3 14.1
10.9 12.8 13.8 19.2 16.3 15.1
2.9
2.6
2.4
15.6 16.7
12.2
9.7
9.7
12.3 15.4 15.4
1.0
1.0
0.9
8.6
6.4
FY28E
5.9
28.2
12.8
18.5
10.9
12.3
19.5
11.3
18.8
19.8
17.0
32.7
15.9
15.9
22.6
15.8
16.1
16.0
7.7
15.9
29.2
14.0
9.6
11.0
9.9
8.9
16.1
18.7
20.3
13.6
5.7
19.0
16.2
14.1
17.7
21.5
8.9
4.9
12.4
7.6
18.1
0.0
13.3
42.7
15.3
14.7
18.8
14.7
20.5
8.8
18.5
33.0
9.2
15.0
11.8
37.0
11.8
14.2
6.7
12.3
16.3
6.0
43
 Motilal Oswal Financial Services
Reform. Resilience. Revelry!
Mastering the game!
Ready reckoner: Full year valuations
Company
Name
Mahanagar Gas
Oil India
ONGC
Petronet LNG
Reliance Inds.
Real Estate
Anant Raj
Brigade Enterpr.
DLF
Godrej Properties
Kolte Patil Dev.
Lodha Developers
Mahindra Lifespace
Oberoi Realty
Phoenix Mills
Prestige Estates
SignatureGlobal
Sobha
Sri Lotus Developers
Sunteck Realty
Retail
Aditya Birla Fashion
Aditya Birla Lifestyle
Avenue Supermarts
Barbeque Nation
Bata India
Campus Activewear
Devyani Intl.
Go Fashion
Jubilant Foodworks
Kalyan Jewellers
Metro Brands
P N Gadgil Jewellers
Raymond Lifestyle
Relaxo Footwear
Restaurant Brands
Sapphire Foods
Senco Gold
Shoppers Stop
Titan Company
Trent
Vedant Fashions
Vishal Mega Mart
V-Mart Retail
Westlife Foodworld
Staffing
Quess Corp
SIS
Team Lease Serv.
Updater Services
Technology
Coforge
Cyient
HCL Technologies
Hexaware Tech.
Infosys
KPIT Technologies
L&T Technology
LTIMindtree
MphasiS
Persistent Systems
Tata Elxsi
October 2025
CMP
(INR)
1,277
412
243
275
1,369
699
896
722
2,031
431
1,140
361
1,595
1,564
1,543
1,045
1,517
191
438
86
134
4,449
234
1,188
271
171
685
619
465
1,248
607
1,181
446
78
297
345
521
3,406
4,834
691
149
725
681
255
350
1,753
252
1,601
1,149
1,389
676
1,446
1,155
4,185
5,124
2,691
4,955
5,227
EPS (INR)
FY26E FY27E FY28E FY26E
Buy 107.6 112.0 119.5 11.9
Neutral 32.7 32.0 28.4 12.6
Neutral 31.0 32.0 32.6
7.8
Buy
24.3 30.9 26.3 11.3
Buy
57.6 63.2 69.8 23.8
32.9
Buy
14.7 13.0 31.9 47.7
Buy
37.6 53.7 77.5 23.8
Buy
16.7 17.3 18.1 43.3
Buy
82.3 80.0 126.4 24.7
Buy
41.6 38.6 78.6 10.4
Buy
36.6 38.8 38.7 31.2
Neutral 2.7
12.8 15.1 135.2
Neutral 78.8 99.7 109.3 20.3
Buy
49.7 62.1 83.6 31.5
Buy
27.5 32.1 35.7 56.1
Buy
55.7 125.3 184.8 18.8
Buy
33.7 50.6 72.4 45.0
Buy
6.1
12.0 15.8 31.5
Buy
9.4
8.4
15.8 46.6
80.2
Neutral -5.0
-5.0
-4.0 -17.3
Neutral 2.0
2.3
2.6
66.9
Buy
44.4 54.0 65.1 100.3
Neutral -8.1
-7.6
-7.1
-29
Neutral 21.1 24.5 29.1 56.4
Buy
4.8
6.2
7.8
56.9
Buy
0.3
1.4
2.3 563.5
Buy
16.2 21.2 24.4 42.3
Neutral 5.8
8.2
10.8 107.0
Buy
11.1 13.6 16.2 41.9
Buy
15.6 18.8 22.2 80.0
Buy
23.8 29.0 35.4 25.5
Buy
36.5 55.7 67.6 32.4
Sell
8.3
9.4
10.6 53.5
Buy
-2.4
-0.6
0.4
-32.8
Buy
-0.4
2.7
3.6 -737.7
Neutral 17.2 18.4 22.7 20.1
Neutral 1.6
2.1
2.4
326
Buy
55.1 65.5 77.7 61.8
Buy
49.7 57.8 64.6
97
Neutral 17.1 18.7 20.8
40
Buy
1.8
2.3
2.8
83
Buy
13.7 22.5 33.1
53
Neutral 1.1
4.2
7.6 614.9
14.0
Neutral 15.2 17.5 19.8 16.8
Buy
31.5 37.3 42.6 11.1
Buy
93.9 111.6 130.3 18.7
Buy
20.3 22.9 24.5 12.4
22.5
Buy
47.2 60.4 74.6 33.9
Sell
63.7 76.7 95.1 18.0
Buy
65.9 72.8 76.0 21.1
Buy
23.9 27.8 32.0 28.2
Neutral 68.7 72.5 76.8 21.0
Buy
29.8 37.2 45.6 38.7
Neutral 129.8 155.4 177.5 32.2
Buy 176.7 199.5 222.0 29.0
Neutral 100.3 112.0 126.1 26.8
Buy 115.8 140.9 171.0 42.8
Sell 111.3 140.0 160.9 47.0
Reco
PE (x)
FY27E
11.4
12.9
7.6
8.9
21.7
27.7
53.9
16.7
41.8
25.4
11.2
29.3
28.1
16.0
25.2
48.1
8.3
30.0
15.9
52.1
64.2
-17.4
58.8
82.4
-31
48.5
44.0
120.1
32.2
75.7
34.1
66.4
20.9
21.2
47.4
-121.6
109.7
18.8
245
52.0
84
37
65
32
161.7
12.0
14.5
9.4
15.7
11.0
20.8
26.5
15.0
19.1
24.3
19.9
31.1
26.9
25.7
24.0
35.2
37.3
PB (x)
ROE (%)
FY28E FY26E FY27E FY28E FY26E FY27E
10.7
1.9
1.8
1.6
17.1 16.1
14.5
1.4
1.3
1.2
11.3 10.2
7.5
0.8
0.8
0.7
10.9 10.5
10.5
1.9
1.7
1.5
17.8 20.1
19.6
2.0
1.9
1.7
8.9
9.0
22.1
3.9
3.4
3.0
11.9 12.5
21.9
5.2
4.7
3.9
10.8
8.8
11.6
3.4
2.8
2.3
15.1 18.4
40.0
2.8
2.6
2.4
9.3
9.0
16.1
3.1
2.8
2.4
13.4 11.5
5.5
2.4
2.0
1.4
30.2 19.1
29.4
4.9
4.2
3.8
16.7 15.4
23.9
2.3
2.1
2.0
2.2
7.8
14.6
3.2
2.7
2.3
16.9 18.2
18.7
4.6
3.9
3.3
15.8 16.8
43.2
3.8
3.5
3.2
6.9
7.5
5.7
9.7
4.5
2.5
70.0 73.6
20.9
3.3
3.0
2.6
7.6
10.5
12.1
4.8
3.7
2.8
20.5 26.0
27.6
1.9
1.8
1.7
4.1
3.6
52.8 11.4 10.1
8.8
14.3 15.6
-21.4
1.4
1.6
1.7
-9.4 -10.3
52.5 10.8
9.1
7.8
17.5 16.8
68.4 11.9 10.4
9.0
12.6 13.5
-33.0
2.8
3.0
3.3
-9.5
-9.9
40.8
9.0
8.2
7.5
16.5 17.6
34.6
9.5
8.1
6.7
16.7 18.3
73.3 31.4 37.9 39.9
4.2
28.6
28.1
4.8
4.3
3.8
10.8 12.6
57.2 19.7 19.3 17.7 18.4 25.5
28.7
8.5
7.3
6.4
21.9 23.1
56.1 16.7 14.3 12.3 23.0 23.8
17.1
4.4
3.6
3.0
18.8 19.0
17.5
0.7
0.7
0.7
5.0
7.2
42.0
4.9
4.6
4.2
9.5
10.0
204.2 6.0
6.3
6.1
-16.8 -5.1
81.7
6.9
6.5
6.0
-0.9
6.1
15.2
2.5
2.3
2.0
13.4 12.8
219.9 12.2 11.4 10.7
5.1
6.3
43.9 20.1 15.8 12.6 36.8 34.1
74.8 22.8 18.1 14.7 28.3 25.8
33.3
8.6
7.7
6.8
20.7 20.1
52.3
9.5
8.3
7.1
12.2 13.6
21.9
6.3
5.2
4.2
12.6 17.7
89.8 16.6 15.1 12.9
2.8
9.8
10.6
2.3
2.0
1.8
16.1 16.8
12.9
3.1
3.5
4.1
22.3 29.6
8.2
0.8
0.7
0.6
17.3 17.2
13.5
2.8
2.4
2.1
14.9 15.2
10.3
1.5
1.3
1.2
13.0 12.9
19.5
6.5
6.3
6.1
29.0 30.4
21.5
7.5
6.5
5.7
17.4 21.2
12.1
2.3
2.1
2.0
12.0 13.7
18.3
5.5
5.6
5.7
25.8 28.9
21.1
6.7
5.9
5.2
25.8 26.3
18.8
6.2
6.2
6.2
29.7 31.3
25.3
9.0
7.5
6.3
25.4 26.5
23.6
6.4
5.5
4.8
21.1 22.0
23.1
5.9
5.2
4.6
21.6 21.5
21.3
4.9
4.6
4.2
19.1 19.8
29.0 10.4
8.8
7.4
26.3 27.3
32.5 10.1
9.1
8.2
22.8 25.7
FY28E
15.6
8.5
10.0
15.3
9.2
13.6
17.8
21.8
8.7
15.8
30.2
13.5
8.6
16.9
19.1
7.8
56.8
13.4
26.3
6.5
16.6
-9.2
16.0
14.1
-10.1
19.1
19.3
53.0
13.0
31.0
23.9
24.2
19.1
8.1
10.4
3.1
7.6
14.0
6.6
32.1
23.2
19.9
14.7
21.4
15.5
16.9
38.6
16.6
15.2
12.2
31.2
23.4
16.0
30.7
26.6
33.1
27.3
21.8
21.1
20.5
28.0
26.6
44
 Motilal Oswal Financial Services
Reform. Resilience. Revelry!
Mastering the game!
Ready reckoner: Full year valuations
Company
Name
Tata Technologies
TCS
Tech Mahindra
Wipro
Zensar Tech
Telecom
Bharti Airtel
Bharti Hexacom
Indus Towers
Tata Comm
Vodafone Idea
Utilities
ACME Solar
Indian Energy Exch.
Inox Wind
JSW Energy
NTPC
Power Grid Corp.
Suzlon Energy
Tata Power
Others
APL Apollo Tubes
Astral
Cello World
Coromandel International
Dreamfolks Services
EPL
Eternal
Godrej Agrovet
Gravita India
Indiamart Inter.
Indian Hotels
Info Edge
Interglobe Aviation
Kajaria Ceramics
Lemon Tree Hotel
MTAR Tech
One 97 Comm.
Prince Pipes
Safari Inds.
SBI Cards
Supreme Inds.
Swiggy
Time Technoplast
UPL
Va Tech Wabag
VIP Inds.
CMP
(INR)
690
2,914
1,416
241
769
1,867
1,653
352
1,611
9
288
141
142
537
340
281
55
391
1,732
1,377
574
2,251
102
214
329
696
1,560
2,400
723
1,339
5,609
1,190
166
1,899
1,149
325
2,182
875
4,190
418
222
661
1,432
416
EPS (INR)
PE (x)
PB (x)
ROE (%)
FY26E FY27E FY28E FY26E FY27E FY28E FY26E FY27E FY28E FY26E FY27E
Sell
17.2 19.9 22.4 40.2 34.7 30.8
7.2
6.7
6.3
18.6 20.0
Buy 141.8 150.2 156.4 20.6 19.4 18.6 10.7 10.3
9.9
53.1 54.0
Buy
60.7 77.5 86.8 23.3 18.3 16.3
4.5
4.3
4.1
19.4 24.0
Sell
12.5 12.9 13.8 19.3 18.7 17.5
3.0
2.9
2.9
15.7 15.9
Neutral 32.1 34.3 36.9 24.0 22.4 20.8
4.0
3.7
3.4
17.4 17.2
123
56
32.8 11.8 10.4
9.7
9.6
18.7
Buy
48.9 65.3 86.1 38.2 28.6 21.7
7.9
6.1
5.2
23.0 26.2
Neutral 38.0 54.8 71.9 43.5 30.2 23.0 11.3
9.1
7.4
28.7 33.4
Neutral 26.3 30.1 30.3 13.4 11.7 11.6
2.4
2.3
2.3
19.3 19.8
Neutral 44.9 63.9 77.0 35.9 25.2 20.9 12.8
9.7
7.4
38.7 43.6
Sell
-2.5
-2.4
-2.0
-3.5
-3.5
-4.2
-0.5
-0.3
-0.3
NM
NM
18
16
13.8
2.5
2.2
2.0
13.5 14.3
Buy
9.0
10.7 24.5 32.0 27.0 11.8
3.5
3.1
2.4
11.4 12.1
Neutral 5.2
5.4
5.7
27.0 26.3 24.7
9.8
8.5
7.5
39.2 34.7
Buy
3.9
6.6
7.4
36.6 21.5 19.1
4.3
3.6
3.0
12.5 18.1
Buy
12.6 17.0 25.8 42.5 31.6 20.8
3.2
2.9
2.6
7.8
9.7
Neutral 24.8 28.2 31.6 13.7 12.1 10.8
1.7
1.6
1.4
13.0 13.6
Buy
18.7 19.8 20.8 15.0 14.2 13.5
2.6
2.4
2.3
18.1 17.8
Buy
1.3
2.3
2.4
43.5 24.5 23.0
9.6
6.9
5.3
24.9 32.9
Buy
13.4 17.5 20.3 29.2 22.3 19.2
3.2
2.8
2.5
11.4 13.5
56.0 36.9 27.9
6.3
5.5
4.7
11.3 14.9
Buy
41.6 55.8 65.8 41.7 31.0 26.3
9.2
7.3
5.8
24.5 26.3
Buy
21.2 28.6 34.3 65.1 48.1 40.2
6.8
5.9
5.1
14.8 17.6
Buy
16.3 22.1 25.2 35.1 26.0 22.8
4.9
4.3
3.6
14.4 17.8
Buy
75.6 97.3 110.1 29.8 23.1 20.4
5.1
4.3
3.6
18.6 20.3
Buy
14.6 17.7
7.0
5.8
1.4
1.1
23.4 22.5
Buy
13.8 16.7 19.4 15.5 12.8 11.0
2.6
2.3
2.0
17.6 18.9
Buy
1.3
4.5
10.0 262.8 73.8 32.8
9.4
8.3
6.6
3.6
12.0
Buy
27.1 35.2 39.6 25.7 19.8 17.6
7.6
6.0
4.8
25.1 33.7
Buy
55.2 72.9 90.9 28.2 21.4 17.2
4.7
3.8
3.1
18.0 19.7
Buy
84.6 93.2 70.4 28.4 25.7 34.1
5.5
4.8
4.8
21.1 19.9
Buy
13.1 15.9 17.7 55.1 45.3 40.9
8.0
6.8
5.9
15.5 16.2
Neutral 16.2 19.3 20.3 82.7 69.3 65.9
3.0
3.0
2.9
3.7
4.3
Buy 222.1 246.4 276.2 25.2 22.8 20.3 12.4
8.2
5.9
64.2 43.4
Buy
31.4 37.0 43.6 38.0 32.2 27.3
6.2
5.5
4.9
16.4 17.2
Buy
3.5
4.4
4.9
48.1 38.2
34
9.2
7.4
6.1
21.1 21.4
Buy
33.2 54.7 72.4 57.2 34.7
26
7.0
5.8
4.8
13.1 18.4
Neutral 9.8
19.0 26.6 117.2 60.4
43
4.9
4.8
4.6
4.2
8.1
Buy
8.0
13.9 19.5 40.7 23.5 16.6
0.9
0.8
0.7
5.5
8.9
Buy
42.7 50.0 59.1 51.0 43.6 36.9
9.3
7.8
6.6
20.0 19.5
Neutral 28.1 39.6 47.9 31.2 22.1 18.3
5.1
4.2
3.5
17.8 21.0
Buy
82.0 110.2 132.4 51.1 38.0 31.6
8.5
7.4
6.3
17.5 20.7
Buy -17.6 -8.0
-0.3 -23.8 -52.1 -1,506 13.6 16.0 15.7 -46.6 -28.2
Buy
10.6 13.1 16.0 20.9 16.9
14
3.0
2.6
2.3
15.5 16.7
Neutral 38.4 57.1 64.0 17.2 11.6
10
1.1
1.0
0.9
9.8
13.5
Buy
61.3 73.1 87.8 23.4 19.6 16.3
3.6
3.1
2.6
15.3 15.7
Buy
2.4
9.3
13.4 174.2 44.9 31.0
9.1
7.5
6.0
5.4
18.3
Reco
FY28E
21.2
54.0
25.9
16.7
17.0
29.6
28.3
35.5
19.7
40
NM
14.6
23.2
32.3
17.1
13.3
13.9
17.3
26.1
14.0
16.8
24.6
18.1
17.1
19.3
19.1
22.6
30.1
20.1
14.1
15.5
4.5
33.9
18.0
19.8
20.0
11.0
11.5
19.4
20.9
21.4
-1.1
17.7
13.6
16.2
21.6
October 2025
45
 Motilal Oswal Financial Services
Sectors & Companies
BSE Sensex: 83,433
Nifty 50: 25,461
July 2025
Reform. Resilience. Revelry!
Mastering the game!
Sector and Companies Preview Compendium
Automobiles
Capital Goods
Infrastructure
Logistics
Cement
Chemicals-Specialty
Consumer
Consumer Durables
EMS
Financials
Banks
Financials
NBFC: Lending
Financials
NBFC: Non Lending
Healthcare
Metals
Oil & Gas
Plastic Pipes
Real Estate
Retail
Technology
Telecom
Utilities
Others
Note:
In our quarterly performance tables, our four-quarter numbers may not always add up to the
full-year numbers. This is because of differences in classification of account heads in the company’s
quarterly and annual results or because of differences in the way we classify account heads as opposed
to the company.
All stock prices and indices as on 1 October 2025, unless otherwise stated.
October 2025
46
 Motilal Oswal Financial Services
September 2025 Results Preview | Sector: Automobiles
Automobiles
Company
Amara Raja Energy Mobility
Ashok Leyland
Apollo Tyres
Bajaj Auto
Balkrishna Industries
Bharat Forge
BOSCH
Ceat
CIE Automotive
Craftsman Automation
Eicher Motors
Endurance Technologies
Escorts
Exide Industries
Happy Forgings
Hero MotoCorp
Hyundai Motor
Mahindra & Mahindra
Maruti Suzuki
Samvardhana Motherson
Motherson Wiring
MRF
Sona BLW Precision Ltd
Tata Motors
TVS Motor Company
Tube Investments
CVs and 2Ws see demand revival in Q2
OEMs likely to outperform ancillaries
After a weak print in 1Q, auto OEMs in our coverage universe delivered 12.9% YoY
volume growth in 2QFY26. Among the listed companies, 2W/CV OEMs posted volume
growth of 15%/10% in 2Q. Aggregate PV growth for the four listed OEMs stood at just
3% YoY.
For our OEM coverage universe (excl. TTMT), revenue is likely to grow 13% YoY on the
back of healthy volume growth. Similarly, excl. TTMT, EBITDA/PAT for our coverage
universe is expected to grow by 11%/14% YoY.
For auto ancillaries under our coverage, we expect ~9% growth in revenue but a much
slower 3% growth in both EBITDA/PAT in 2Q.
TVS (+49%), EIM (+31%), Escorts (+22%) and HMCL (+20%) are expected to outperform
OE peers in 2Q. In auto ancillaries, outperformers include APTY (+23%), Craftsman
(+40%) and ENDU (+21%).
Overall earnings estimate cuts have been moderate in 2Q.
Our top OEM picks are MSIL and MM. Top auto ancillary picks are ENDU and Happy
Forgings.
Demand has picked up well in CVs and 2Ws in 2Q, PVs remain weak
After a subdued show in 1Q, auto OEMs in our coverage universe posted a much
better 12.9% YoY volume growth in 2QFY26. Both 2Ws and CVs posted a smart
revival in volumes even as PV demand remained subdued. Among the listed players,
2W/CV OEMs posted 15%/10% growth in 2Q volumes. On the other hand, aggregate
PV growth for the four listed OEMs stood at just 3% YoY. In 2Ws, except for BJAUT
(+6%), other three listed players saw healthy double-digit growth
RE (+43%), TVS
(23%) and HMCL (+11%). In PVs, TTMT outperformed peers with 11% YoY growth.
MM UV growth was slower at 7% as it intentionally reduced dispatches to dealers
given the lack of clarity on cess compensation. Also, while MSIL saw 2% YoY growth,
HMIL volumes declined 1% YoY in 2Q. Discounts have increased QoQ in 2Q in PVs, as
per our channel checks. In CVs, TTMT was the key growth driver with 13% growth,
while AL (+8%) and VECV (+5%) saw single-digit growth. The tractor segment posted
the highest growth in the auto sector, as the two listed companies delivered a
robust 31% YoY growth in 2Q.
Auto OEMs to see healthy earnings growth compared to auto ancillaries
On the back of a healthy recovery in volumes, auto OEM companies under our
coverage are expected to deliver 11%/14% growth in EBITDA/PAT (excl. TTMT).
Aggregate EBITDA margin for our coverage universe is estimated to rise marginally
by 20bp YoY to 13.2%. In 2Q, major margin gains are expected for TVSL (+130bp
YoY), TTMT CV (+190bp), VECV (+160bp), and Escorts (+330bp). On the other hand,
MSIL (-150bp YoY) and TTMT PV (-120bp) are expected to see margin contraction.
For auto ancillaries, we expect our coverage universe to post ~9% growth in revenue
and a much slower 3% growth in both EBITDA/PAT in 2Q.
Research analyst - Aniket Mhatre
(Aniket.Mhatre@MotilalOswal.com)
October 2025
47
 Motilal Oswal Financial Services
September 2025 Results Preview | Sector: Automobiles
Estimated hits and misses in 2QFY26
We expect our auto OEM coverage universe (excl. TTMT) to post 15% YoY earnings
growth. It is important to highlight that excl. TTMT, all other listed OEMs are
expected to post positive earnings growth. TVSL (+49%), EIM (+31%), Escorts (+22%)
and HMCL (+20%) are expected to outperform their OEM peers in 2Q. TTMT is the
only OEM that is expected to post earnings decline in 2Q. Meanwhile, MSIL (8%),
HMIL (8%), BJAUT (+9%) and AL (+7%) are expected to post single-digit growth.
Our ancillary coverage universe should deliver modest 3% YoY earnings growth in
PAT in 2Q. Key earnings growth drivers include APTY (+23%), Craftsman (+40%) and
Endurance (+21%). Major laggards are expected to be Sona (-11%), Amara (-14%),
BHFC (-13%) and SAMIL (-15%).
Overall earnings estimate cuts have been moderate in this quarter.
Festive season starts off on an optimistic note
The GST Council has provided a much-needed booster shot to the auto sector by
reducing the tax rates on the majority of auto segments. These timely rate cuts,
coupled with other sectoral tailwinds like normal monsoon boosting rural
sentiment, a ~100bp reduction in interest rates in CY25 and income tax benefits, are
expected to revive demand for the auto sector from this festive season. The ongoing
festive season has started off on a strong note across segments, with most OEMs
reporting a strong revival in demand on the back of GST rate cuts and positive rural
sentiment. Notably, entry-level vehicle demand has recovered from the lows, albeit
with high discounts. Demand is likely to remain strong after the festive season, with
the marriage season starting in Nov’25. Once demand is restored, we expect
discounts to gradually trend lower. On the back of a pickup in demand and a much
better earnings growth, we expect the sector to get re-rated. Our top picks in auto
OEMs are Maruti Suzuki (new launches + exports ramp-up to drive 17% earnings
growth) and M&M (new launches + positive rural sentiments to drive 21% earnings
growth). In the auto ancillary space, we prefer ENDU and HAPPYFORG for their
strong order backlog and ability to outperform core segments.
October 2025
48
 Motilal Oswal Financial Services
September 2025 Results Preview | Sector: Automobiles
Exhibit 1: Summary of 2QFY26 earnings estimates
Sector
Amara Raja Energy
Apollo Tyres
Ashok Leyland
Bajaj Auto
Balkrishna Inds
Bharat Forge
Bosch
CEAT
CIE Automotive
Craftsman Auto
Eicher Motors
Endurance Tech.
Escorts Kubota
Exide Inds.
Happy Forgings
Hero Motocorp
Hyundai Motor
Mahindra & Mahindra
Maruti Suzuki
Samvardhana Motherson
Motherson Wiring
MRF
Sona BLW Precis.
Tata Motors
Tube Investments
TVS Motor
Automobiles
CMP
(INR)
993
468
141
8619
2304
1219
38338
3488
413
6725
7005
2812
3637
395
925
5430
2537
3463
15971
106
46
148630
414
718
3082
3457
RECO
Neutral
Buy
Buy
Neutral
Neutral
Neutral
Neutral
Buy
Buy
Neutral
Sell
Buy
Neutral
Neutral
Buy
Buy
Buy
Buy
Buy
Buy
Buy
Sell
Neutral
Neutral
Buy
Neutral
SALES (INR M)
EBITDA (INR M)
NET PROFIT (INR M)
Var
Var
Var
Var
Var
Var
Sep-25
Sep-25
Sep-25
% YoY % QoQ
% YoY % QoQ
% YoY % QoQ
33,553
7.0
0.2
4,026
-8.6
4.1
2,065
-14.2
6.4
69,968
8.7
6.6
9,581
9.1
10.4
3,709
23.2
31.9
97,232
10.9
11.4
11,473
12.8
18.3
7,430
7.2
25.1
1,46,728 11.8
16.6
29,351
10.7
18.3
24,148
9.0
15.2
25,517
3.5
-7.5
6,226
0.7
-5.1
3,672
5.0
28.0
20,949
-6.8
-0.5
5,237
-16.3
-8.4
3,041
-13.4
-10.2
48,777
11.0
1.9
6,439
14.9
0.7
5,629
12.5
-16.0
36,350
10.0
3.0
4,289
18.4
10.6
1,415
16.1
23.2
23,233
8.8
-1.9
3,278
-0.8
-2.6
1,962
0.8
-3.3
18,319
50.9
2.7
2,766
43.5
4.4
863
39.9
14.0
60,781
42.6
20.6
15,545
42.9
29.2
14,422
31.1
19.7
34,702
19.1
4.6
4,651
21.7
5
2,460
21.2
8.7
27,588
21.8
11.1
3,752
61.2
15.5
3,703
22.3
17.4
44,380
4.0
-1.6
5,414
12.0
-1.2
3,268
9.7
2.0
3,792
5.0
7.2
1,092
3.6
8.0
719
7.8
9.4
1,18,735 13.5
24.0
18,031
18.9
30.5
14,432
19.9
28.2
1,73,749
0.7
5.9
23,385
6.0
7.0
14,844
7.9
8.4
3,29,211 19.5
-3.4
46,154
16.9
-5.5
42,940
11.8
24.5
4,01,139
7.8
4.4
39,229
-11.2
-1.8
33,086
7.8
-10.9
2,98,356
7.3
-1.2
23,415
-4.3
-4.8
6,340
-15.1
2.1
26,047
12.0
4.4
2,708
8.5
10.9
1,627
7.0
13.7
75,716
12.0
0.1
10,752
10.5
3.9
5,016
10.1
3.6
8,883
-4.0
10.9
2,194
-13.9
13.3
1,368
-11.5
9.6
9,25,667
-8.8
-11.3
77,577
-33.9
-20.2
22,929
-31.4
-42.2
21,342
3.4
6.4
2,600
5.7
5.1
1,786
6.4
6.2
1,18,886 28.8
17.9
15,455
43.1
22.4
9,844
48.6
26.4
31,72,572 4.2
-1.0
3,75,383
-3.9
-0.7
2,32,801
5.0
1.5
Exhibit 2: EBITDA margin expected to marginally improve
Aggregate (excl. JLR)
Exhibit 3: Trends in segment-wise EBITDA margins (%)
2QFY25
3QFY25
4QFY25
1QFY26
2QFY26
2W
Source: MOFSL
Cars
CV
Source: MOFSL
October 2025
49
 Motilal Oswal Financial Services
September 2025 Results Preview | Sector: Automobiles
Exhibit 4: Our auto OEM coverage universe (excl. JLR) expected to witness 15% YoY earnings growth
Volumes ('000 units)
2Q
2Q
YoY
1Q
FY26
FY25 (%) FY26
Bajaj Auto
1,294
1,222
6
1,111
Hero MotoCorp
1,691
1,520 11 1,367
TVS Motor
1,507
1,228 23 1,277
Maruti Suzuki
551
542
2
528
Hyundai
191
192
-1
180
M&M
350
301
16
361
TTMT India PV
144
131
11
125
TTMT India CV
97
86
13
88
TTMT (JLR) in GBP
66
87
-24
87
TTMT Consol
Ashok Leyland
49
46
8
44
Eicher(Consol)
Eicher - RE
326
228
43
266
Eicher - VECV
22
21
5
22
Escorts
34
26
30
31
Aggregate
6,256
5541 12.9 5,399
QoQ
(%)
16
24
18
4
6
-3
16
10
-24
2Q
FY26
20.0
15.2
13.0
9.8
13.5
14.0
4.9
12.6
7.4
8.4
11 11.8
25.6
23 26.7
1
8.7
11 13.6
15.9 13.0
EBITDA Margins (%)
2Q YoY 1Q QoQ
FY25 (bp) FY26 (bp)
20.2 -20 19.7 30
14.5 70 14.4 80
11.7 130 12.5 50
11.9 -210 10.4 -60
12.8 70 13.3 10
14.3 -30 14.3 -30
6.2 -120 4.0 100
10.7 190 12.1 50
11.7 -430 9.3 -190
11.6 -320 9.3
-90
11.6 20 11.1 70
25.5 10 23.9 170
26.3 50 25.1 160
7.1 160 9.0
-30
10.3 330 13.1 50
13.0
0
13.2 -20
2Q
FY26
24,148
14,432
9,844
33,086
14,844
42,940
45
19,796
47
22,929
7,430
14,422
13,251
2,947
3,703
162,296
Adj PAT (INR M)
2Q
YoY
1Q
FY25
(%)
FY26
22,160
9
20,960
12,035
20
11,257
6,626
49
7,786
30,692
8
37,117
13,755
8
13,692
38,409
12
34,498
2,290
-98
-1,290
13,140
51
16,560
283
-84
246
33,438
-31
39,671
6,933
7
5,937
11,003
31
12,052
10,099
31
13,065
2,090
41
2,890
3,027
22
3,726
150,418 7.9 170,760
QoQ
(%)
15
28
26
-11
8
24
-103
20
-81
-42
25
20
1
2
-1
-5.0
Source: JLR in GBP m, MOFSL
Exhibit 5: Relative performance
three months (%)
120
112
104
96
88
Nifty Index
MOFSL Automobiles Index
Exhibit 6: Relative performance
one year (%)
110
100
90
80
70
Nifty Index
MOFSL Automobiles Index
Source: Bloomberg, MOFSL
October 2025
50
 Motilal Oswal Financial Services
September 2025 Results Preview | Sector: Automobiles
Exhibit 7: Our revised estimates
Amara Raja Energy
Ashok Leyland
Apollo Tyres
Balkrishna Inds
Bajaj Auto
Bharat Forge
Bosch
CEAT
CIE Automotive
Craftsman Auto
Eicher Motors
Endurance Tech.
Escorts Kubota
Exide Inds.
Happy Forgings
Hero MotoCorp
Hyundai Motor
Mahindra & Mahindra
Maruti Suzuki
Samvardhana Motherson
Motherson Wiring
MRF
Sona BLW Precis.
Tata Motors
Tube Investments
TVS Motor
Rev
45.4
6.0
24.0
83.6
329.0
24.2
824.3
156.8
21.7
156.2
192.1
72.0
119.5
15.3
30.2
258.3
71.8
120.7
490.2
3.2
1.0
5100.4
8.8
41.9
41.6
76.1
FY26E
Old
45.5
6.0
23.2
90.2
326.0
25.9
814.0
169.3
21.4
156.2
188.8
72.4
111
14.5
30.2
251.2
67.9
119.5
495.1
3.3
1.0
4,891.9
8.5
45.8
41.6
75.1
Chg (%)
-0.3
0.5
3.5
-7.3
0.9
-6.6
1.3
-7.4
1.6
0.0
1.8
-0.5
7.4
5.8
-0.1
2.8
5.8
1.0
-1.0
-4.1
-1.8
4.3
4.0
-8.5
0.0
1.4
Rev
54.7
7.2
29.1
103.5
362.1
33.0
976.1
207.8
22.9
229.2
213.0
84.4
128.6
16.7
37.5
283.1
89.5
143.7
607.4
4.7
1.3
5918.4
10.4
54.5
47.1
91.3
FY27E
Old
55.8
7.2
28.7
111.4
366.0
33.1
958.0
229.8
22.6
237.6
208.5
83.8
122.7
15.8
38.3
273.4
89.5
136.7
598.0
4.6
1.3
5,522.0
10.1
51.9
47.1
91.3
Chg (%)
-2.0
0.9
1.5
-7.1
-1.1
-0.4
1.9
-9.6
1.2
-3.6
2.2
0.7
4.8
5.9
-2.1
3.6
0.0
5.1
1.6
1.6
0.2
7.2
2.9
5.1
0.0
0.0
Source: MOFSL
Exhibit 8: Comparative valuations
Company
Name
Automobiles
Amara Raja Energy
Apollo Tyres
Ashok Leyland
Bajaj Auto
Balkrishna Inds
Bharat Forge
Bosch
CEAT
CIE Automotive
Craftsman Auto
Eicher Motors
Endurance Tech.
Escorts Kubota
Exide Inds.
Happy Forgings
Hero Motocorp
Hyundai Motor
Mahindra & Mahindra
Maruti Suzuki
Motherson Wiring
MRF
Samvardhana Motherson
Sona BLW Precis.
Tata Motors
Tube Investments
TVS Motor
EPS (INR)
PE (x)
PB (x)
ROE (%)
FY26E FY27E FY28E FY26E FY27E FY28E FY26E FY27E FY28E FY26E FY27E
29.6 24.4 20.6
4.7
4.2
3.6
16.0 17.1
993
Neutral 45.4 54.7 60.7 21.9 18.2 16.4
2.3
2.1
1.9
12.0 12.8
468
Buy
24.0 29.1 32.1 19.5 16.1 14.6
1.5
1.4
1.3
10.0 11.4
141
Buy
6.0
7.2
8.5
23
20
16.7
6.3
5.5
4.7
28.8 30.0
8,619 Neutral 329.0 362.1 396.5 26.2 23.8 21.7
6.9
6.4
5.9
27.4 27.9
2,304 Neutral 83.6 103.5 111.7 27.6 22.3 20.6
3.8
3.3
2.9
14.6 16.0
1,219 Neutral 24.2 33.0 40.9 50.4 37.0 29.8
5.8
5.3
4.7
12.0 14.9
38,338 Neutral 824.3 976.1 1,113.4 46.5 39.3 34.4
7.3
6.7
6.0
16.6 17.9
3,488
Buy 156.8 207.8 248.3 22.2 16.8 14.0
2.9
2.6
2.3
13.7 16.2
413
Buy
21.7 22.9 23.8 19.0 18.1 17.3
2.2
2.0
1.8
11.9 11.5
6,725 Neutral 156.2 229.2 303.4 43.0 29.3 22.2
5.0
4.3
3.7
12.3 15.8
7,005
Sell 192.1 213.0 241.2 36.5 32.9 29.0
7.8
6.8
5.9
23.0 22.1
2,812
Buy
72.0 84.4 99.5 39.0 33.3 28.3
6.1
5.3
4.6
16.5 16.9
3,637 Neutral 119.5 128.6 134.4 30.4 28.3 27.1
3.9
3.5
3.2
13.4 13.0
395
Neutral 15.3 16.7 17.7 25.8 23.6 22.3
2.2
2.0
1.9
8.4
8.5
925
Buy
30.2 37.5 49.6 30.6 24.7 18.7
4.2
3.6
3.1
14.4 15.7
5,430
Buy 258.3 283.1 311.5 21.0 19.2 17.4
5.1
4.7
4.3
25.1 25.3
2,537
Buy
71.8 89.5 109.1 35.3 28.3 23.3 10.1
8.0
6.4
31.7 31.5
3,463
Buy 120.7 143.7 163.0 28.7 24.1 21.2
5.7
4.8
4.1
21.5 21.6
15,971
Buy 490.2 607.4 714.2 32.6 26.3 22.4
4.8
4.2
3.7
14.6 16.0
46
Buy
1.0
1.3
1.6
46.1 34.1 28.6 15.3 12.3 10.0 35.8 40.0
1,48,630
Sell 5,100.4 5,918.4 6,658.0 29.1 25.1 22.3
3.1
2.8
2.5
11.1 11.6
106
Buy
3.2
4.7
5.7
33.5 22.7 18.7
3.0
2.8
2.5
9.4
12.8
414
Neutral 8.8
10.4 11.5 46.8 39.8 36.0
4.4
4.1
3.8
9.5
10.6
718
Neutral 41.9 54.5 74.7 17.1 13.2
9.6
2.0
1.8
1.5
12.6 14.5
3,082
Buy
41.6 47.1 52.1 74.0 65.4 59.2 10.1
8.9
7.9
14.5 14.4
3,457 Neutral 76.1 91.3 106.4 45.4 37.8 32.5 12.6
9.9
7.9
31.6 29.3
CMP
(INR)
Reco
FY28E
17.6
12.8
11.6
30.2
28.3
15.2
16.7
18.5
17.1
11.0
17.9
21.8
17.4
12.3
8.4
18.0
25.7
30.6
20.7
16.4
38.5
11.7
14.1
11.0
17.2
14.1
27.0
October 2025
51
 Motilal Oswal Financial Services
September 2025 Results Preview | Sector: Automobiles
The tables below provide a snapshot of actual and estimated numbers for companies under the MOFSL coverage
universe. Highlighted columns indicate the quarter/financial year under review.
Amara Raja Energy Mobility
CMP: INR993 | TP: INR1,039 (+5%)
We expect battery demand to largely remain stable QoQ
both in OE and replacement segments, and hence expect
Amara to post 7% YoY growth in revenue (flat QoQ).
Neutral
EPS CHANGE (%): FY26E|FY27E: -|-2
Lead prices are largely stable QoQ. However, elevated
power costs are likely to keep margins under pressure for at
least 2Q.
EBITDA margins to improve 50bp QoQ (down 210bp YoY) to
12%.
FY26E
2QE
3QE
33,553
34,488
7.0
9.0
33553
34488
29,527
30,280
0.0
0.0
69.5
69.0
6.0
5.8
12.5
13.0
4,026
4,208
12.0
12.2
1,298
1,320
110
115
135
140
2,753
2,913
0
0
2,753
2,913
688
743
25.0
25.5
2,065
2,170
2,065
2,170
-14.2
-5.6
FY25
4QE
33,733
13.4
33733
29,601
0.0
69.0
5.9
12.9
4,132
12.2
1,330
122
145
2,826
0
2,826
697
24.7
2,129
2,129
27.6
124,049
10.2
124,049
107,758
0.0
67.8
6.0
13.1
16,291
13.1
4,921
422
933
11,881
0
11,881
3,353
28.2
8,528
8,528
-5.9
(INR M)
FY26E
135,274
9.0
135,274
119,041
0.0
69.5
5.9
12.6
16,233
12.0
5,241
450
560
11,102
0
11,102
2,798
25.2
8,304
8,304
-2.6
Quarterly Performance
Y/E March (INR m)
Net Sales
YoY Change (%)
Gross operating income
Total Expenditure
Excise (% of sales)
RM Cost (% of sales)
Staff Cost (% of sales)
Other Exp (% of sales)
EBITDA
Margins (%)
Depreciation
Interest
Other Income
PBT before EO expense
Extra-Ord expense
PBT after EO
Tax
Tax Rate (%)
Reported PAT
Adj PAT
YoY Change (%)
1Q
31,312
13.0
31312
27,008
0.0
68.9
5.9
11.5
4,304
13.7
1,183
90
256
3,287
0
3,287
841
25.6
2,446
2,446
23.1
FY25
2Q
3Q
31,358 31,640
11.6
9.8
31358
31640
26,952 27,482
0.0
0.0
67.6
66.9
6.1
6.0
12.2
13.9
4,407
4,158
14.1
13.1
1,220
1,233
131
107
185
293
3,240
3,111
0
-1,111
3,240
4,222
833
1,103
25.7
26.1
2,407
3,118
2,407
2,298
6.3
-9.1
4Q
29,739
6.3
29739
26,316
0.0
67.7
6.1
14.7
3,422
11.5
1,284
95
200
2,244
0
2,244
576
25.7
1,668
1,668
-26.8
1Q
33,499
7.0
33499
29,633
0.0
70.5
5.9
12.0
3,867
11.5
1,292
104
139
2,610
0
2,610
670
25.7
1,940
1,940
-20.7
Ashok Leyland
Buy
CMP: INR141 | TP: INR166 (+18%)
EPS CHANGE (%): FY26E|FY27E: 1|1
After a subdued 1Q, CV volumes saw a healthy pickup in 2Q,
Input cost to largely remain stable QoQ, unlike fears of an
up 7.7% YoY. While MHCV sales grew 9%, LCV sales rose
increase. Staff cost may rise QoQ due to annual increments.
5.5%. Export mix has sharply improved, up 45% YoY.
Led by improved mix and volumes, EBITDA margin to rise
70bp QoQ (+20bp YoY) to 11.8%. PAT to grow 7% YoY.
Quarterly Performance (S/A)
1Q
43,893
6.2
1,959
-1.1
85,985
5.0
72.2
6.4
10.9
9,109
10.6
591
223
1,727
7,014
25.1
5,256
-8.9
FY25
2Q
3Q
45,624
46,404
-8.5
-1.4
1,922
2,043
-0.6
3.7
87,688
94,787
-9.0
2.2
71.2
71.5
6.8
6.4
10.4
9.4
10,173
12,114
11.6
12.8
607
501
973
247
1,754
1,923
9,958
9,938
22.7
23.3
6,933
7,617
20.2
31.2
4Q
59,176
5.1
2,012
0.6
1,19,067
5.7
70.6
5.5
8.9
17,910
15.0
471
1,059
1,789
16,573
24.8
12,562
32.4
1Q
44,238
0.8
1,972
0.7
87,245
1.5
70.6
7.0
11.2
9,696
11.1
419
529
1,828
7,977
25.6
5,937
13.0
FY26E
2QE
3QE
49,116
50,116
7.7
8.0
1,980
2,022
3.0
-1.0
97,232 101,346
10.9
6.9
70.8
71.0
6.9
6.5
10.5
9.6
11,473
13,074
11.8
12.9
350
310
700
300
1,850
1,880
9,973
11,184
25.5
24.0
7,430
8,500
7.2
11.6
FY25
4QE
63,561
7.4
2,038
1.3
129,553
8.8
72.4
4.5
8.2
19,290
14.9
249
1,012
1,832
18,221
25.1
13,650
8.7
195,097
0.3
1,986
0.7
387,527
1.0
71.3
6.2
9.8
49,306
12.7
2,169
2,503
7,193
43,483
24.0
32,355
20.6
(INR M)
FY26E
207,032
6.4
2,006
1.7
415,376
8.3
71.3
6.1
9.7
53,533
12.9
1,327
2,540
7,390
47,356
25.0
35,517
9.8
Total Volumes (nos)
Growth %
Realizations (INR '000)
Change (%)
Net operating revenues
Change (%)
RM/sales %
Staff/sales %
Other exp/sales %
EBITDA
EBITDA Margins (%)
Interest
Other Income
Depreciation
PBT after EO
Effective Tax Rate (%)
Adj PAT
Change (%)
October 2025
52
 Motilal Oswal Financial Services
September 2025 Results Preview | Sector: Automobiles
Apollo Tyres
CMP: INR468 | TP: INR551 (+18%)
While demand was healthy in Jul, it turned weak in Aug and
then there were purchase delays in Sep in replacement given
the GST deadline. OE demand was stable. We expect
standalone revenue growth of 6% YoY (flat QoQ).
Input costs are down about 2% QoQ, which is likely to aid
margins. However, INR depreciation towards 2Q end may
offset some of these gains.
Consolidated - Quarterly performance
Y/E March
Net Revenues
YoY Change (%)
EBITDA
Margins (%)
Depreciation
Interest
Other Income
PBT before EO expense
Extra-Ord expense
PBT
Tax Rate (%)
MI & P/L of Asso. Cos.
Reported PAT
Adj PAT
YoY Change (%)
Margins (%)
1Q
63,349
1.4
9,093
14.4
3,695
1,070
308
4,636
404
4,232
28.6
0
3,020
3,313
-18.4
5.2
FY25
2Q
64,370
2.5
8,779
13.6
3,759
1,197
217
4,040
52
3,988
25.4
-1
2,975
3,012
-37.6
4.7
3Q
69,280
5.0
9,470
13.7
3,759
1,105
81
4,686
42
4,644
27.4
-2
3,372
3,403
-32.9
4.9
Buy
EPS CHANGE (%): FY26E|FY27E: 4|2
We expect India margins to improve 30bp QoQ (+180bp YoY
over low base) due to lower input costs.
Demand in Europe, although weak, is likely to be stable QoQ.
We expect Europe margins to improve 70bp QoQ (-330bp
YoY) to 11.5%.
4Q
64,236
2.6
8,374
13.0
3,771
1,094
275
3,785
1,188
2,596
29.0
-3
1,846
2,708
-41.8
4.2
1Q
65,608
3.6
8,677
13.2
3,776
1,006
189
4,085
3,702
383
66.5
-1
129
2,812
-15.1
4.3
FY26E
2QE
3QE
69,968 76,614
8.7
10.6
9,581 11,605
13.7
15.1
3,850
3,910
950
880
230
120
5,011
6,935
0
0
5,011
6,935
26.0
26.0
-1
1
3,709
5,131
3,709
5,131
23.2
50.8
5.3
6.7
FY25
4QE
72,102
12.2
10,286
14.3
4,188
1,061
255
5,293
0
5,293
31.4
1
3,632
3,632
34.2
5.0
261,234
2.9
35,715
13.7
14,984
4,466
881
17,146
1,687
15,460
27.5
-7
11,213
12,436
-33.2
4.8
(INR M)
FY26E
284,291
12.0
40,150
14.1
15,723
3,896
794
21,324
3,702
17,622
28.5
0
12,601
15,249
22.6
5.4
Bajaj Auto
Neutral
CMP: INR8,619 | TP: INR9,197 (7%)
EPS CHANGE (%): FY26E|27E: 1|-1
Total volumes grew ~6% YoY, supported by ~24% growth in
Hence, despite weak offtake, we expect BJAUT margins to
exports even as domestic volumes declined ~5% YoY. While
improve by 30bp QoQ to 20%, led by improved mix and
2W sales grew 3% YoY, 3W sales were up ~20% YoY. Thus,
currency tailwinds toward 2Q end. Overall, we expect BJAUT
product mix for BJAUT is favorable for 2Q.
to post 9% earnings growth YoY.
Quarterly Performance
1Q
1,102
7.3
1,08,234
7.9
1,19,280
15.7
24,154
20.2
3,209
207
937
26,219
24.2
19,884
19.4
FY25
2Q
3Q
1,222
1,224
15.9
2.0
1,07,470 1,04,591
5.1
3.7
1,31,275 1,28,069
21.8
5.7
26,522
25,807
20.2
20.2
3,845
3,347
159
143
956
997
27,139
28,015
26.1
24.7
22,160
21,087
20.7
3.3
4Q
1,103
3.2
1,10,142
2.5
1,21,480
5.8
24,505
20.2
3,808
168
1,111
27,033
24.2
20,492
5.8
1Q
1,111
0.8
113,247
4.6
125,845
5.5
24,818
19.7
4,308
141
1,109
27,875
24.8
20,960
5.4
FY26E
2QE
3QE
1,294
1,271
5.9
3.8
113,381 112,958
5.5
8.0
146,728 143,625
11.8
12.1
29,351
28,717
20.0
20.0
4,000
3,800
130
140
1,120
1,130
32,101
31,247
24.8
24.8
24,148
23,506
9.0
11.5
FY25
4QE
1,235
11.9
113,346
2.9
139,944
15.2
28,153
20.1
4,012
139
1,126
30,901
24.7
23,255
13.5
4,651
6.9
107,527
4.7
500,103
11.9
1,00,988
20.2
14,209
677
4,001
108,406
24.8
83,103
11.1
INR m
FY26E
4,912
5.6
113,232
5.3
556,142
11.2
1,11,038
20.0
16,120
550
4,485
122,123
12.5
91,868
10.5
Volumes ('000 units)
Growth YoY (%)
Realization (INR/unit)
Growth YoY (%)
Net Sales
Change (%)
EBITDA
EBITDA Margins (%)
Other Income
Interest
Depreciation
PBT after EO
Effective Tax Rate (%)
Adj. PAT
Change (%)
October 2025
53
 Motilal Oswal Financial Services
September 2025 Results Preview | Sector: Automobiles
Balkrishna Industries
Neutral
CMP: INR2,304 | TP: INR2,379 (+3%)
EPS CHANGE (%): FY26E|FY27E: -7|-7
Demand continued to be weak in most of its overseas
A reduction in input costs is likely to be offset by the weak
markets. India likely to be the sole growth driver. Overall, we demand impact and impact of partial tariff absorption in US.
expect BKT to post 1% YoY growth in tonnage in 2Q.
Margin is likely to improve 60bp QoQ to 24.4%.
Quarterly Earning Model (Standalone)
Y/E March
Volumes (Ton)
YoY Change (%)
Realizations (INR '000/ton)
YoY Change (%)
Net Revenues
YoY Change (%)
EBITDA
Margins (%)
Depreciation
Interest
Forex loss/(gain)
Other Income
PBT before EI
Extra-Ord expense
PBT
Rate (%)
Adj PAT
YoY Change (%)
1Q
83,570
24.3
328.1
4.2
27,415
29.6
7,137
26.0
1,617
143
-60
830
6,267
0
6,267
23.8
4,773
52.7
(INR M)
FY26E
315,232
0.0
345.0
2.5
108,740
2.4
26,411
24.3
7,524
1,145
1,540
471
18,865
0
18,865
24.0
13,807
-15.2
FY25
2Q
3Q
4Q
73,298 76,343 82,062
3.8
4.9
0.0
336.3 336.8 345.8
5.6
5.8
5.2
24,648 25,716 28,376
9.7
11.0
5.2
6,185 6,391 7,035
25.1
24.9
24.8
1,647 1,708 1,760
404
150
490
530 -1,120
580
1,048
240
550
4,653 5,894 4,755
0
0
0
4,653 5,894 4,755
24.9
25.4
23.8
3,496 4,398 3,622
4.3
42.6
-25.8
1Q
80,664
-3.5
342.1
4.3
27,594
0.7
6,560
23.8
1,862
290
1,540
1,042
3,910
0
3,910
26.6
2,869
-39.9
FY26E
2QE
3QE
74,031 77,106
1.0
1.0
344.7
346.9
2.5
3.0
25,517 26,752
3.5
4.0
6,226
6,501
24.4
24.3
1,880
1,885
300
270
0
0
950
200
4,996
4,546
0
0
4,996
4,546
26.5
26.5
3,672
3,341
5.0
-24.0
FY25
4QE
83,431
1.7
346.1
0.1
28,877
1.8
7,124
24.7
1,897
285
0
471
5,413
0
5,413
27.5
3,924
8.3
315,273
7.7
336.7
5.1
106,150
13.2
26,813
25.3
6,735
1,252
-68
2,668
21,562
0
21,562
24.5
16,283
-39.9
Bharat Forge
CMP: INR1,219 | TP: INR1,109 (-9%)
US demand has been tepid for both Class8 and non-auto.
Defense ramp-up is likely to be stable QoQ. Pickup in
domestic business likely to offset weakness in exports.
Revenue to decline 7% YoY in 2Q.
Neutral
EPS CHANGE (%): FY26E|FY27E: -6|-1
US tariffs on CVs and non-auto for India exports stand at 50%
now. This impact is expected to be partially absorbed
between vendors and OEMs.
EBITDA margins to decline 280bp YoY to 25%.
Standalone PAT is expected to decline 13% YoY in 2Q.
(INR m)
1Q
23,381
9.9
6,515
27.9
446
702
1094
1,457
3,708
1014
27.3
2,694
-13.5
3,787
20.2
FY25
2Q
3Q
22,467
20,960
-0.1
-7.4
6,255
6,099
27.8
29.1
348
314
635
573
1083
1104
-135
9
5,019
4,727
1407
1266
28.0
26.8
3,612
3,461
4.4
-8.4
3,510
3,468
0.1
-4.8
4Q
21,630
-7.1
6,167
28.5
481
588
1122
203
4,735
1278
27.0
3,456
-11.3
3,608
-8.8
1Q
21,047
-10.0
5,718
27.2
422
522
1125
0
4,493
1108
24.7
3,385
25.6
3,385
-10.6
FY26E
2QE
3QE
20,949
23,133
-6.8
10.4
5,237
6,038
25.0
26.1
420
455
490
450
1140
1150
0
0
4,027
4,893
987
1199
24.5
24.5
3,041
3,694
-15.8
6.7
3,041
3,694
-13.4
6.5
FY25
4QE
24,029
11.1
6,305
26.2
530
438
1188
0
5,209
1400
26.9
3,809
10.2
3,809
5.6
88,437
-1.4
25,034
28.3
1,589
2,498
4,404
19,721
4,965
25.2
14,756
2.4
13,223
-7.2
FY26E
89,159
0.8
23,299
26.1
1,827
1,900
4,602
0
18,623
4,693
25.2
13,930
5.4
13,930
-3.1
S/A Quarterly
Net operating income
Change (%)
EBITDA
EBITDA Margins (%)
Non-Operating Income
Interest
Depreciation
EO Exp / (Inc)
PBT after EO items
Tax
Eff. Tax Rate (%)
Rep. PAT
Change (%)
Adj. PAT
Change (%)
October 2025
54
 Motilal Oswal Financial Services
September 2025 Results Preview | Sector: Automobiles
Bosch
Neutral
CMP: INR38,338 | TP: INR36,375 (-5%)
EPS CHANGE (%): FY26E|27E: 1|2
We expect 11% YoY revenue growth, driven by aftermarket
Margins to largely remain stable QoQ at 13.2%.
growth in the mobility division and pickup in demand in CV
As a result, we expect Bosch to post 12.5% YoY growth in PAT.
and 2Ws in 2Q.
Quarterly performance (S/A)
Y/E March
Net Sales
YoY Change (%)
RM Cost (% of sales)
Staff Cost (% of sales)
Other Expenses (% of sales)
EBITDA
Margins (%)
Depreciation
Interest
Other Income
PBT before EO expense
Extra-Ord expense
PBT after EO Expense
Tax
Tax Rate (%)
Reported PAT
Adj PAT
YoY Change (%)
E: MOFSL Estimates
1Q
43,168
3.8
64.6
7.8
15.7
5,197
12.0
856
26
1,793
6,108
0
6,108
1,453
23.8
4,655
4,655
13.8
FY25
2Q
3Q
43,943 44,657
6.4
6.2
65.1
61.6
7.8
8.8
14.3
16.5
5,605
5,826
12.8
13.0
900
1,008
22
62
2,089
1,891
6,772
6,647
-485
471
7,257
6,176
1,898
1,594
26.2
25.8
5,359
4,582
5,002
4,929
30.2
4.4
4Q
49,106
16.0
62.4
8.6
15.8
6,469
13.2
992
61
2,369
7,785
0
7,785
2,248
28.9
5,537
5,537
-1.9
1Q
47,886
10.9
62.3
7.1
17.2
6,393
13.4
850
45
2,881
8,379
5,560
13,939
2,785
20.0
11,154
6,705
44.0
FY26E
2QE
3QE
48,777 50,016
11.0
12.0
63.2
63.0
8.4
8.5
15.2
15.3
6,439
6,602
13.2
13.2
900
950
30
42
2,150
2,200
7,659
7,810
0
0
7,659
7,810
2,030
1,953
26.5
25.0
5,629
5,858
5,629
5,858
12.5
18.8
FY25
4QE
51,909
5.7
63.8
8.5
14.4
6,920
13.3
1,013
33
2,262
8,136
0
8,136
2,243
27.6
5,893
5,893
6.4
180,874
8.1
63.4
8.3
15.6
23,097
12.8
3,756
171
8,142
27,312
0
27,312
7,193
26.3
20,119
20,119
11.4
(INR M)
FY26E
198,587
9.8
63.1
8.1
15.5
26,353
13.3
3,713
150
9,493
31,984
0
31,984
9,011
28.2
22,973
22,973
14.2
Ceat
CMP: INR3,488| TP: INR4,105 (+18%)
OE demand was steady in 2Q, though replacement demand
was weak, especially post Aug 15th, in anticipation of GST
rate cuts as retailers refused to take stock at earlier rates.
For exports, some greenshoots appeared in Europe.
However, demand in US remained weak given tariff impact.
We expect CEAT to post 10% revenue growth in 2Q.
Consolidated - Quarterly Earning
Model
Y/E March
Net Sales
YoY Change (%)
RM cost (%)
Employee cost (%)
Other expenses (%)
EBITDA
Margins (%)
Depreciation
Interest
Other Income
PBT before EO expense
Exceptional item
PBT
Tax Rate (%)
MI & Profit of Asso. Cos.
Reported PAT
Adj PAT
YoY Change (%)
1Q
31,928
8.8
60.8
6.1
21.1
3,829
12.0
1,318
619
62
1,954
-75
2,029
26.6
-53
1,542
1,486
3
FY25
2Q
3Q
33,045 32,999
8.2
11.4
62.6
63.2
6.6
6.5
19.8
20.0
3,623
3,409
11.0
10.3
1,371
1,415
665
751
35
34
1,622
1,278
0
0
1,621
1,278
28.6
28.3
-61
-55
1,219
971
1,219
971
-41
-46
4Q
34,206
14.3
62.5
6.6
19.5
3,881
11.3
1,523
744
45
1,659
370
1,288
27.6
-63
995
1,267
-16
1Q
35,294
10.5
63.2
6.4
19.4
3,877
11.0
1,514
821
47
1,590
33
1,558
26.9
14
1,125
1,149
-23
FY26E
2QE
3QE
36,350 36,629
10.0
11.0
62.0
61.5
6.2
6.1
20.0
20.0
4,289
4,542
11.8
12.4
1,525
1,550
850
880
45
50
1,959
2,162
0
0
1,959
2,162
27.0
26.0
15
-61
1,415
1,660
1,415
1,660
16
71
FY25
4QE
38,115
11.4
60.6
6.1
20.2
5,004
13.1
1,561
910
78
2,612
0
2,612
25.0
-153
2,111
2,111
67
132,179
10.7
62.3
6.5
20.1
14,741
11.2
5,627
2,778
176
6,512
-296
6,808
25.3
-231
5,319
5,101
-26
Buy
EPS CHANGE (%): FY26E|FY27E: -7|-10
Input cost is expected to decline 1-2% QoQ.
EBITDA margin is expected to improve 80bp YoY to 11.8%.
Overall, PAT is likely to grow 16% YoY.
CEAT would integrate Camso in 2Q. We have not considered
Camso in our numbers as we await further clarity.
(INR M)
FY26E
146,388
10.7
61.8
6.2
19.9
17,713
12.1
6,149
3,460
220
8,323
0
8,323
26.0
-185
6,344
6,344
24
October 2025
55
 Motilal Oswal Financial Services
September 2025 Results Preview | Sector: Automobiles
CIE Automotive
CMP: INR413 | TP: INR495 (+20%)
Buy
EPS CHANGE (%): CY25E|26E: 2|1
Overall, consol. revenue is projected to grow 9% YoY.
India business to post 2% YoY growth in revenue due to pick-
EBITDA margin is expected to largely remain stable QoQ at
up in key segments. EU business to post 25% YoY growth
14.1%.
over a very low base of last year.
Quarterly performance (Consol.)
(INR m)
Y/E December
Net Sales
YoY Change (%)
EBITDA
Margins (%)
Depreciation
Interest
Other Income
Share of profit from associates
PBT before EO expense
Tax Rate (%)
Adj. PAT
YoY Change (%)
Revenues
India
Growth (%)
EU
Growth (%)
EBITDA Margins
India
EU
1Q
24,268
-0.5
3,606
14.9
863
220
513
4
3,035
24.3
2,302
4.5
14,275
-1
9,994
0
15.1
14.6
CY24
2Q
3Q
22,927 21,346
-1.2
-6.4
3,600
3,306
15.7
15.5
836
798
211
169
306
243
6
19
2,859
2,581
24.5
25.3
2,164
1,947
1.3
4.3
15,047
5
7,879
-11
15.5
16.1
15,270
-1
6,077
-18
15.6
15.2
4Q
21,100
-5.8
2,993
14.2
809
175
336
-2
2,344
23.6
1,790
1.1
14,430
-3
6,670
-12
14.6
13.2
1Q
22,726
-6.4
3,355
14.8
864
126
361
5
2,725
24.6
2,060
-10.5
14,658
3
8,069
-19
15.7
13.1
CY25
2Q
3QE
23,690 23,233
3.3
8.8
3,368
3,278
14.2
14.1
871
788
16
140
221
242
7
7
2,701
2,592
25.1
24.6
2,030
1,962
-6.2
0.8
15,154
6
8,536
-1
15.7
11.7
15,642
2
7,591
25
15.1
12.1
CY24
4QE
24,155
14.5
3,532
14.6
835
180
289
9
2,806
23.2
2,164
20.9
16,352
13
7,804
17
15.0
13.7
89,641
-3.4
13,506
15.1
3,306
776
1,396
27
10,820
24.4
8,203
2.8
58,309
-1
29,098
-14
15.7
15.0
CY25E
93,806
4.6
13,534
14.4
3,358
456
1,112
28
10,832
24.3
8,223
0.2
61,806
6
31,999
10
15.4
12.6
Craftsman Auto
Neutral
CMP: INR6,725 | TP: INR6,391 (-5%)
EPS CHANGE (%): FY26E|FY27E: -|-4
Standalone revenue likely to grow ~18% YoY, led by steady
Consolidated revenue is likely to grow 51% YoY due to
growth in aluminum segment and recovery in powertrain
integration of Sunbeam and Fornsburg.
segment.
Consolidated margins to largely remain stable QoQ at 15.1%
as bulk of the expected margin improvement came in 1Q.
Quarterly (Consol)
Y/E March
Net operating income
Change (%)
RM/Sales (%)
Staff Cost (% of Sales)
Other Exp. (% of Sales)
EBITDA
EBITDA Margins (%)
Non-Operating Income
Interest
Depreciation
MI/Share of Profit
PBT after EO items
Eff. Tax Rate (%)
Rep. PAT
Change (%)
Adj. PAT
Change (%)
E: MOFSL Estimates
1Q
11,512
10.9
56.3
6.4
20.1
1,973
17.1
48
492
725
61
744
28.5
532
-28.6
532
-28.6
FY25
2Q
3Q
12,140
15,761
3.0
39.5
55.6
52.7
6.9
8.5
21.6
26.2
1,928
1,990
15.9
12.6
64
86
413
583
762
1035
-4
-2
821
313
24.9
58.6
617
129
-34.7
-82.3
617
242
-34.7
-66.9
4Q
17,493
58.3
54.2
8.3
23.6
2,436
13.9
52
679
949
-2
755
11.6
668
7.1
750
20.3
1Q
17,840
55.0
53.9
8.1
23.2
2,649
14.9
50
663
1019
-2
937
25.7
696
30.9
757
42.3
FY26E
2QE
3QE
18,319
18,824
50.9
19.4
53.9
54.0
8.0
8.0
23.0
22.6
2,766
2,899
15.1
15.4
55
58
600
550
1100
1150
0
0
1,121
1,257
23.0
23.0
863
968
39.9
648.5
863
968
39.9
299.3
FY25
4QE
19,395
10.9
54.2
8.1
21.9
3,058
15.8
50
440
1223
0
1,446
22.5
1,120
67.8
1,120
49.5
56,905
27.8
54.5
7.7
23.2
8,327
14.6
251
2166
3470
-10
2,951
23.3
2,263
-25.7
2,263
-25.7
(INR m)
FY26E
74,379
30.7
54.0
8.1
22.6
11,373
15.3
213
2253
4492
0
4,841
23.0
3,728
64.7
3,728
64.7
October 2025
56
 Motilal Oswal Financial Services
September 2025 Results Preview | Sector: Automobiles
Eicher Motors
CMP: INR7,005 | TP: INR5,772 (-18%)
RE has significantly outperformed the industry with 43% YoY
volume growth in 2Q.
On the back of strong volume growth, we expect margins to
improve +160bp QoQ.
Quarterly performance (Consolidated)
INR m
Y/E March
Net Operating income
Growth (%)
EBITDA
EBITDA Margins (%)
PAT
Share of JV Loss/(PAT)/ Min. Int.
Recurring PAT
Growth (%)
Standalone (Royal Enfield)
Royal Enfield ('000 units)
Growth (%)
Net Realn (INR '000/unit)
Change - YoY (%)
Net operating income
Growth (%)
EBITDA
EBITDA Margins (%)
Recurring PAT
Growth (%)
1Q
43,931
10.2
11,654
26.5
9,269
-1,746
11,015
19.9
227
-0.4
186
8.8
42,313
8.5
11,786
27.9
10,880
19.1
FY25
2Q
3Q
42,631 49,731
3.6
19.0
10,877 12,012
25.5
24.2
9,866 10,070
-1,138 -1,635
11,003 11,705
8.3
17.5
228
-0.6
185
7.7
42,054
7.0
11,049
26.3
10,099
7.6
272
19.4
180
1.4
49,081
21.1
12,237
24.9
10,562
15.6
4Q
52,411
23.1
12,577
24.0
11,142
-2,480
13,622
27.3
283
24.2
181
-1.9
51,066
21.8
12,609
24.7
11,251
14.4
1Q
50,418
14.8
12,028
23.9
10,481
-1,571
12,052
9.4
266
17.0
185
-0.9
49,084
16.0
12,313
25.1
13,065
20.1
FY26E
2QE
3QE
60,781 51,979
42.6
4.5
15,545 12,906
25.6
24.8
12,819 10,255
-1,603 -1,867
14,422 12,122
31.1
3.6
326
43.2
185
0.0
60,233
43.2
16,098
26.7
13,251
31.2
278
2.1
185
2.5
51,362
4.6
13,388
26.1
11,290
6.9
FY25
4QE
59,048
12.7
14,780
25.0
10,672
-3,409
14,082
3.4
305
8.0
186
2.7
56,646
10.9
14,908
26.3
11,916
5.9
188,704
14.1
47,120
25.0
40,346
-6,998
47,344
18.3
1,010
10.6
183
3.7
184,515
43.5
47,680
25.8
42,793
14.1
Sell
EPS CHANGE (%): FY26E|FY27E: 2|2
VECV: It has underperformed CV industry and posted 5% YoY
growth. We expect margin to improve 160bp YoY (-30bp
QoQ) to 8.7%.
Overall, we expect consol PAT to grow 31% YoY for EIM.
FY26E
222,227
34.4
55,258
24.9
44,227
-8,451
52,678
31.7
1,010
10.6
185
5.0
217,325
69.0
56,706
26.1
49,522
32.1
Endurance Technologies
CMP: INR2,812 | TP: INR3,311 (+18%)
India business to grow 10% YoY on the back of a steady
revival in OEM demand in 2Q.
India EBITDA margin to improve 50bp YoY to 13%.
Buy
EPS CHANGE (%): FY26E|FY27E: -1|1
Europe revenue to grow 33% YoY on Stoferle acquisition.
Expect EBITDA margin to improve 100bp YoY to 17%.
Consolidated PAT to grow 21% YoY in 2Q.
Consolidated - Quarterly
Y/E March
INR m
Net Sales
YoY Change (%)
EBITDA
Margins (%)
Depreciation
Interest
Other Income
PBT before EO expense
Exceptional Item
PBT after EO
Eff. Tax Rate (%)
Adj. PAT
YoY Change (%)
1Q
28,255
15.3
3,741
13.2
1,288
112
339
2,680
0
2,680
23.9
2,039
24.7
FY25
2Q
3Q
29,127 28,592
14.4
11.6
3,820
3,725
13.1
13.0
1,311
1,364
116
115
265
219
2,658
2,466
0
0
2,658
2,466
23.6
25.2
2,030
1,844
31.3
21.1
4Q
29,635
11.2
4,225
14.3
1,424
125
346
3,022
-122
3,144
22.0
2,359
21.0
1Q
33,189
17.5
4,439
13.4
1,644
135
356
3,016
0
3,016
24.9
2,264
11.0
FY26E
2QE
3QE
34,702 36,783
19.1
28.7
4,651
5,028
13.4
13.7
1,630
1,680
107
98
290
310
3,204
3,560
0
0
3,204
3,560
23.2
22.5
2,460
2,760
21.2
49.7
FY25
4QE
38,343
29.4
5,417
14.1
1,694
126
307
3,905
0
3,905
23.7
2,978
26.3
115,608
12.9
15,511
13.4
5,387
468
1,170
10,825
-122
10,947
23.6
8,270
20.7
FY26E
143,018
23.7
19,535
13.7
6,649
466
1,264
13,684
0
13,684
23.5
10,462
26.5
October 2025
57
 Motilal Oswal Financial Services
September 2025 Results Preview | Sector: Automobiles
ESCORTS
CMP: INR3,637 | TP: INR3,683 (+1.3%)
After a subdued 1% growth in 1Q, Escorts bounced back
strongly in 2Q and posted 30% YoY growth in tractor
volumes, in line with strong pickup in industry demand.
Standalone Quarterly Performance
Y/E March
Net Sales
YoY Change (%)
Total Expenditure
EBITDA
Margins (%)
Depreciation
Interest
Other Income
PBT
Rate (%)
Adj. PAT
YoY Change (%)
Margins (%)
1Q
25,563
9.8
22,394
3,169
12.4
590
101
1,024
3,502
24.0
2,662
-5.9
10.4
Neutral
EPS CHANGE (%): FY26E|FY27E: 7 |5
With strong pickup in volumes, margin to expand 50bp
QoQ (+330bp YoY over low base) to 13.6%.
PAT is likely to grow 22% YoY largely due to strong
tractor growth and resultant margin expansion.
FY26E
2QE
3QE
27,588 31,313
21.8
6.7
23,836 27,023
3,752
4,290
13.6
13.7
620
630
35
40
1,650
1,702
4,747
5,322
22.0
23.0
3,703
4,098
22.3
41.1
13.4
13.1
FY25
4QE
28,391
16.8
24,658
3,733
13.1
643
39
1,742
4,793
22.4
3,720
37.3
13.1
101,870
4.1
90,091
11,778
11.6
2,426
270
4,584
13,395
17.1
11,465
21.6
11.3
(INR M)
FY26E
112,126
14.6
97,101
15,025
13.4
2,484
150
6,650
18,281
24.9
15,820
67.8
14.1
FY25
2Q
3Q
22,649 29,354
-8.1
8.5
20,321 26,001
2,328
3,353
10.3
11.4
610
612
92
31
1,152
1,092
2,778
3,802
-8.9
23.6
3,027
2,905
41.9
7.7
13.4
9.9
4Q
24,303
6.1
21,374
2,929
12.1
615
47
1,316
3,313
24.3
2,710
9.1
11.1
1Q
24,834
-2.9
21,584
3,250
13.1
591
36
1,556
4,939
24.5
3,153
18.5
12.7
Exide Industries
CMP: INR395 | TP: INR404 (+2%)
We expect Exide to post 4% YoY growth in revenue to
INR44.4b.
S/A Quarterly Performance
Y/E March
Net Sales
Growth YoY (%)
RM cost (%)
Employee cost (%)
Other Exp (%)
EBITDA
EBITDA Margin (%)
Change (%)
Non-Operating Income
Interest
Depreciation
PBT after EO Exp
Effective Tax Rate (%)
Adj. PAT
Change (%)
1Q
43,128
5.9
69.3
6.1
13.1
4,943
11.5
14.4
142
87
1,257
3,741
25.3
2,796
15.6
FY25
2Q
42,673
3.9
68.5
6.3
13.9
4,836
11.3
0.1
528
103
1,270
3,991
25.4
2,978
3.8
3Q
38,486
0.2
68.0
6.8
13.5
4,486
11.7
2.0
132
120
1,244
3,253
24.7
2,450
2.0
4Q
41,594
3.7
68.8
6.3
13.7
4,667
11.2
-9.6
161
130
1,268
3,430
25.8
2,546
-10.3
1Q
45,098
4.6
69.2
3.4
12.6
5,482
12.2
10.9
182
91
1,276
4,297
25.4
3,205
14.6
FY26E
2QE
44,380
4.0
69.0
2.9
12.6
5,414
12.2
12.0
398
130
1,290
4,392
25.6
3,268
9.7
Neutral
EPS CHANGE (%): FY26E|FY27E: 6|6
We expect EBITDA margins to largely remain stable QoQ.
Overall, we expect 2Q PAT to grow 10% YoY.
FY25
3QE
45,414
18.0
68.5
9.2
12.8
5,631
12.4
25.5
144
127
1,350
4,298
24.8
3,232
31.9
4QE
45,602
9.6
67.8
13.5
13.0
5,816
12.8
24.6
196
157
1,385
4,470
25.4
3,336
31.0
165,881
3.5
68.7
6.4
13.6
18,931
11.4
1.2
962
439
5,039
14,415
0.0
10,769
2.3
(INR M)
FY26E
180,493
8.8
68.6
6.3
12.8
22,344
12.4
7.6
919
505
5,301
17,457
25.3
13,041
21.1
October 2025
58
 Motilal Oswal Financial Services
September 2025 Results Preview | Sector: Automobiles
Happy Forgings
Buy
CMP: INR925 | TP: INR1147 (+24%)
EPS CHANGE (%): FY26E|27E: -3|-
Key segments in domestic market (CVs and tractors) have
EBITDA margins to marginally improve QoQ to 28.8%.
picked up in 2Q. Expect revenue growth of 7% QoQ/5% YoY.
We expect 8% YoY earnings growth in 2Q.
No material impact of US tariffs as its US exposure is below
3% of revenue, including indirect exports.
Quarterly (Standalone)
Y/E March
Net operating income
Change (%)
RM/Sales (%)
Staff Cost (%)
Other Exp. (%)
EBITDA
EBITDA Margins (%)
Non-Operating Income
Interest
Depreciation
EO Exp
PBT after EO items
Tax
Eff. Tax Rate (%)
Rep. PAT
Change (%)
Adj. PAT
Change (%)
E: MOFSL Estimates
1Q
3,415
3.5
43.5
8.5
19.4
976
28.6
77
14
180
859
220
25.6
639
-0.3
639
-0.3
FY25
2Q
3Q
3,611
3,543
5.3
3.6
41.2
42.0
8.5
9.3
21.2
20.1
1,054
1,015
29.2
28.6
83
66
16
21
197
191
-48
973
868
259
223
26.6
25.7
714
645
29.3
11.4
666
645
20.6
11.4
4Q
3,520
2.5
41.3
9.2
20.4
1,023
29.1
101
24
203
897
219
24.4
678
3.0
678
3.0
1Q
3,538
3.6
42.1
9.1
20.3
1,012
28.6
104
23
206
0
886
230
25.9
657
2.9
657
2.9
FY26E
2QE
3QE
3,792
3,827
5.0
8.0
42.0
42.0
9.0
9.0
20.2
20.2
1,092
1,102
28.8
28.8
108
107
22
23
220
235
0
0
958
951
240
244
25.0
25.7
719
707
0.6
9.5
719
707
7.8
9.5
FY25
4QE
3,999
13.6
41.9
8.9
19.8
1,178
29.5
109
21
239
0
1,027
265
25.8
762
12.4
762
12.4
14,089
3.7
42.0
8.9
20.3
4,067
28.9
376
75
771
3,597
921
25.6
2,676
-68.1
2,676
10.1
(INR M)
FY26E
15,155
7.6
42.0
9.0
20.1
4,383
28.9
428
89
899
0
3,822
979
25.6
2,844
6.3
2,844
6.3
Hero MotoCorp
CMP: INR5,430 | TP: INR6,315 (+16%)
HMCL has made a smart comeback in 2Q, posting 11% YoY
volume growth and strong 24% QoQ growth. Its EV mix has
increased to 2.3% of total volumes from 1.1% YoY. Its
exports mix has also increased to 7.7% from 4.2% YoY.
Quarterly Performance (S/A)
Y/E March
Total Volumes ('000 nos)
Growth YoY (%)
Net Realization
Growth YoY (%)
Net Op Revenues
Growth YoY (%)
Total Cost
RM Cost (% sales)
Staff Cost (% sales)
Other Exp (% sales)
EBITDA
EBITDA Margins (%)
Other Income
Interest
Depreciation
PBT before EO Exp/(Inc)
Effective Tax Rate (%)
Adj. PAT
Growth (%)
1Q
1,535
13.5
66,076
1.9
1,01,437
15.7
86,840
67.7
6.0
11.9
14,598
14.4
2,317
48
1,932
14,935
24.8
11,226
18.7
FY25
2Q
3Q
1,520
1,464
7.3
0.3
68,851 69,755
3.3
4.7
1,04,632 1,02,108
10.8
5.0
89,473 87,343
66.7
65.8
6.2
6.5
12.6
13.3
15,159 14,765
14.5
14.5
2,830
3,175
49
55
1,937
1,969
16,003 15,916
24.8
24.4
12,035 12,028
14.2
12.1
4Q
1,381
-0.9
71,991
5.3
99,387
4.4
85,231
65.5
6.8
13.5
14,156
14.2
2,237
47
1,921
14,425
25.1
10,809
6.4
1Q
1,367
-10.9
70,069
6.0
95,789
-5.6
81,972
66.7
6.5
12.3
13,817
14.4
3,037
56
1,928
14,870
24.3
11,257
0.3
FY26E
2QE
3QE
4QE
1,691
1,520
1,523
11.3
3.8
10.3
70,228 71,499 71,678
2.0
2.5
-0.4
118,735 108,679 109,151
13.5
6.4
9.8
100,704 92,237 92,717
67.2
66.4
66.0
5.6
6.0
6.1
12.0
12.5
12.8
18,031 16,441 16,434
15.2
15.1
15.1
3,100
2,750
2,970
55
40
50
1,950
1,975
1,985
19,126 17,176 17,369
24.5
24.5
24.8
14,432 12,961 13,060
19.9
7.8
20.8
FY25
5,899
4.9
68,945
3.5
406,719
8.6
348,887
66.6
6.4
12.8
57,832
14.2
10,559
199
7,759
60,434
25.1
45,255
10.7
Buy
EPS CHANGE (%): FY26E|FY27E: 3 |4
Given healthy volumes and stable input costs, we
expect margins to improve 70bp YoY to 15.2%.
On the back of healthy volume growth and margin
expansion, PAT is expected to grow 20% YoY in 2Q.
FY26E
6,101
8.5
70,871
6.4
432,353
15.4
367,630
66.6
6.0
12.4
64,723
15.0
11,857
201
7,838
68,541
24.6
51,711
26.5
October 2025
59
 Motilal Oswal Financial Services
September 2025 Results Preview | Sector: Automobiles
Hyundai Motor
CMP: INR2,537 | TP: INR2,979 (+17%)
Hyundai posted 0.5% YoY decline in volumes in 2Q. Exports
were the key growth driver with mix improving to 27% from
22% YoY. Product mix was also favorable as Hyundai sold
more SUVs than cars in 2Q.
Consol Quarterly Performance
Y/E March
Volumes ('000 units)
Change (%)
Realizations (INR/car)
Change (%)
Net operating revenues
Change (%)
RM Cost (% of sales)
Staff Cost (% of sales)
Other Cost (% of sales)
EBITDA
EBITDA Margins (%)
Depreciation
EBIT
EBIT Margins (%)
Interest
Non-Operating Income
PBT
Tax
Effective Tax Rate (%)
Adjusted PAT
Change (%)
1Q
192.1
4.7
9,03,085
-0.4
1,73,442
4.3
71.9
3.2
11.5
23,402
13.5
5,290
18,112
10.4
316
2,238
20,033
5,137
25.6
14,896
12.1
Buy
EPS CHANGE (%): FY26E|FY27E: 6 |0
Amid weak demand, marketing spends to remain high
QoQ. TN incentives expected to flow in from mid-2Q.
We expect EBITDA margin to improve 70bp YoY to
13.5%, led by improved mix.
FY26
2QE
3QE
190.9
197.6
-0.5
6.0
910,055 919,887
1.2
3.0
173,749 181,763
0.7
9.2
71.0
71.5
3.5
3.6
12.0
12.5
23,385
22,525
13.5
12.4
5,400
6,100
17,985
16,425
10.4
9.0
260
240
2,200
2,500
19,925
18,685
5,081
4,765
25.5
25.5
14,844
13,920
7.9
19.9
FY25
(INR m)
FY26E
FY25
2Q
3Q
4Q
191.9
186.4
191.7
-8.5
-2.4
-1.1
8,99,264 8,93,094 9,36,096
1.1
1.1
2.6
1,72,604 1,66,480 1,79,403
-7.5
-1.3
1.5
72.5
73.1
71.2
3.2
3.6
3.4
11.5
12.0
11.3
22,053
18,755
25,327
12.8
11.3
14.1
5,185
5,274
5,304
16,868
13,482
20,023
9.8
8.1
11.2
292
299
365
1,923
2,445
2,096
18,498
15,627
21,754
4,744
4,020
5,611
25.6
25.7
25.8
13,755
11,607
16,143
-15.5
-18.6
-3.7
1Q
180.4
-6.1
909,810
0.7
164,129
-5.4
70.7
3.8
12.2
21,852
13.3
5,281
16,571
10.1
247
2,148
18,472
4,780
25.9
13,692
-8.1
4QE
205.2
762.1
774.1
7.1
1.6
928,386 907,982 917,366
-0.8
1.0
190,484 691,929 710,125
6.2
2.6
71.5
72.2
71.2
3.5
3.3
3.6
11.7
11.5
12.1
25,264 89,538 93,026
13.3
12.9
13.1
6,504 21,053 23,285
18,760 68,485 69,741
9.8
9.9
9.8
273
1,272
1,020
2,782
8,700
9,630
21,269 75,913 78,352
5,354 19,511 19,980
25.2
25.7
25.5
15,915 56,402 58,372
-1.4
-6.9
3.5
Mahindra & Mahindra
CMP: INR3,463 | TP: INR4,091 (+18%)
MM posted strong 13% YoY growth in PVs (incl. PikUp)
and a much stronger 32% YoY growth in tractors.
For auto segment, margins are likely to remain stable
QoQ. It is still unclear as to who will bear the cess impact
and hence this is unlikely to have any bearing on 2Q nos.
Quarterly Performance
Y/E March
1Q
Total Volumes (nos)
315,366
Growth YoY (%)
4.7
Net Realization
857,378
Growth YoY (%)
7.0
Revenue from Operations
270,388
Growth YoY (%)
12.0
RM Cost (% of sales)
73.7
Staff (% of sales)
4.3
Oth. Exp. (% of Sales)
7.0
EBITDA
40,222
EBITDA Margins (%)
14.9
Change (%)
22.4
Other inc. (incl Inc. from Invest)
3,515
Interest
529
Depreciation
9,146
EBIT
31,076
PBT after EO
34,062
Tax
7,936
Effective Tax Rate (%)
23.3
Adj PAT
26,126
Change (%)
23.2
FY25
2Q
3Q
301,457 343,654
-0.5
17.8
914,003 888,633
13.5
2.2
275,533
305,382
12.9
20.3
74.2
74.4
4.2
4.2
7.3
6.7
39,497
44,681
14.3
14.6
26.4
35.6
19,978
6,063
551
614
9,614
10,451
29,884
34,231
49,310
39,679
10,901
10,036
22.1
25.3
38,409
29,643
13.2
19.1
Buy
EPS CHANGE (%): FY26E|FY27E: 1|5
Overall, we expect auto segment margins to decline 90bp
YoY to 8.6%. Tractor segment margins are likely to remain
healthy (+130bp YoY to 18.8%).
Other income is expected to be seasonally high due to
dividend income from subsidiaries.
FY26E
2QE
3QE
349,807 382,069
16.0
11.2
941,122 929,113
3.0
4.6
329,211 354,986
19.5
16.2
75.0
75.0
4.8
5.1
7.1
6.5
46,154
51,683
14.0
14.6
16.9
15.7
20,976
4,100
500
400
10,500
10,900
35,654
40,783
56,131
44,483
13,191
8,656
23.5
19.5
42,940
35,827
11.8
20.9
FY25
FY26E
4Q
319,447
15.3
981,490
8.0
313,534
24.5
74.1
4.0
6.9
46,825
14.9
42.0
493
810
13,058
33,768
33,450
9,079
27.1
24,371
21.9
1Q
360,779
14.4
944,712
10.2
340,832
26.1
74.5
4.5
5.8
48,840
14.3
21.4
6,431
559
9,999
38,841
44,713
10,214
22.0
34,498
32.0
4QE
341,728 1,279,924 1,437,107
7.0
14.0
12.3
999,445 910,083 950,916
1.8
3.1
4.5
341,538
1,164,837 1,366,567
8.9
17.5
17.3
74.8
74.1
75.2
4.1
4.2
3.9
6.0
7.0
6.3
52,013
171,226 198,690
15.2
14.7
14.5
11.1
30.3
16.0
794
30,048
32,301
426
2,505
1,885
13,064
42,268
44,463
38,949
128,958 154,227
39,317
156,501 184,643
7,638
37,952
39,698
19.4
24.3
21.5
31,679
118,550 144,945
30.0
11.4
22.3
October 2025
60
 Motilal Oswal Financial Services
September 2025 Results Preview | Sector: Automobiles
Maruti Suzuki
CMP: INR15,971 | TP: INR18,501 (+16%)
MSIL reported just 2% YoY growth in volumes due to
challenging demand in domestic market for bulk of 2Q.
Exports mix improved 200bp QoQ to 20%.
S/A Quarterly Performance
Y/E March
Volumes ('000 units)
Change (%)
Realizations (INR/car)
Change (%)
Net operating revenues
Change (%)
RM Cost (% of sales)
Staff Cost (% of sales)
Other Cost (% of sales)
EBITDA
EBITDA Margins (%)
Depreciation
EBIT
EBIT Margins (%)
Interest
Non-Operating Income
PBT
Effective Tax Rate (%)
Adjusted PAT
Change (%)
1Q
521.9
4.8
6,80,850
4.9
3,55,314
9.9
70.2
4.4
12.8
45,023
12.7
7,310
37,713
10.6
573
9,751
46,891
22.2
36,499
46.9
Buy
EPS CHANGE (%): FY26E|FY27E: -1|2
EBITDA margin to be under pressure at 9.8% (-210bp YoY) as
benefits from operating leverage are likely to be more than
offset by higher discounts and new launch expenses QoQ.
We expect MSIL to post 8% YoY growth in PAT in 2Q.
FY26
FY25
2QE
3QE
4QE
550.9
605.8
662.7 2,234.3 2,347.2
1.7
7.0
9.6
4.9
10.3
7,28,187 7,07,009 6,90,633 6,79,866 7,12,014
6.0
4.0
2.7
2.7
7.6
4,01,139 4,28,340 4,57,648 15,19,001 16,71,264
7.8
11.3
12.5
7.8
10.0
72.8
72.4
72.6
71.4
72.5
4.3
4.0
3.8
4.0
4.2
13.1
12.2
11.5
12.8
12.4
39,229
48,700
55,389 1,77,852 1,83,270
9.8
11.4
12.1
11.7
11.0
9,400
9,500
9,780
31,593
38,055
29,829
39,200
45,609 1,46,259 1,45,215
7.4
9.2
10.0
9.6
8.7
450
460
458
1,931
1,834
14,155
13,500
13,519
47,504
59,404
43,534
52,240
58,669 1,91,832 2,02,785
24.0
24.0
24.6
27.3
24.0
33,086
39,702
44,212 1,39,552 1,54,116
7.8
12.6
19.1
5.6
10.4
(INR M)
FY26E
FY25
2Q
3Q
4Q
541.6
566.2
604.6
-1.9
13.0
3.5
6,86,969 6,79,817 6,72,700
2.3
2.3
2.8
3,72,028 3,84,921 4,06,738
0.4
15.6
6.4
71.9
71.6
71.9
3.9
4.0
3.9
12.3
12.8
13.8
44,166
44,703
42,647
11.9
11.6
10.5
7,509
8,050
8,724
36,657
36,653
33,923
9.9
9.5
8.3
402
484
472
14,750
9,850
14,466
51,005
46,019
47,917
39.8
23.4
22.6
30,692
35,250
37,111
-17.4
12.6
-4.3
1Q
527.9
1.1
727,722
6.9
384,136
8.1
72.2
4.6
12.8
39,953
10.4
9,375
30,578
8.0
466
18,230
48,342
23.2
37,117
1.7
Samvardhana Motherson Sumi
CMP: INR106| TP: INR123 (+16%)
Execution of healthy order book, integration benefits from
recent acquisitions and currency translation gains should
help offset demand weakness in end markets. Expect 2Q
revenue growth of 7% YoY.
Quarterly performance (Consol.)
Y/E March
Net Sales
YoY Change (%)
EBITDA
Margins (%)
Depreciation
Interest
Other income
PBT before EO expense
Extra-Ord expense
PBT after EO Expense
Tax Rate (%)
Min. Int & Share of profit
Reported PAT
Adj PAT
YoY Change (%)
E: MOFSL Estimates
1Q
2,88,680
28.5
27,753
9.6
10,646
4,445
709
13,371
0
13,371
26.0
-51
9,942
9,942
65.5
Buy
EPS CHANGE (%): FY26E|FY27E: -4|2
On the back of higher input costs and weak demand, we
expect margins to decline 100bp YoY to 7.8%.
As a result, we expect earnings to decline 15% YoY.
(INR M)
FY26E
1,238,003
8.9
105,334
8.5
49,934
16,639
5,633
44,394
1,365
43,029
26.2
-1,359
32,770
33,766
-11.2
FY25
FY26E
1Q
2QE
3QE
4QE
2Q
3Q
4Q
2,78,119 2,76,659 2,93,168 302,120 298,356 314,783 322,744
18.2
7.9
9.1
4.7
7.3
13.8
10.1
24,479 26,858 26,429 24,583 23,415 27,862 29,474
8.8
9.7
9.0
8.1
7.8
8.9
9.1
11,028 11,124 12,137 12,297 12,350 12,500 12,787
5,462
4,661
4,256
4,250
4,100
4,000
4,289
862
1,112
1,164
805
1,250
1,650
1,928
8,852 12,185 11,200
8,841
8,215 13,012 14,326
-1,730
0
1,730
1,365
0
0
0
10,582 12,185
9,470
7,476
8,215 13,012 14,326
33.2
27.7
12.2
30.1
27.0
27.0
22.5
-1,152
26
-672
-300
-343
-414
-302
8,797
8,786
8,775
5,118
6,340
9,913 11,399
7,470
8,790 10,030
6,210
6,340
9,913 11,399
65.7
62.2
9.4
-37.5
-15.1
12.8
13.6
FY25
1,136,626
15.4
105,519
9.3
44,934
18,824
5,577
47,338
0
47,338
23.6
-1,848
38,030
38,030
51.5
October 2025
61
 Motilal Oswal Financial Services
September 2025 Results Preview | Sector: Automobiles
Motherson Wiring India
Buy
CMP: INR46| TP: INR53 (+16%)
EPS CHANGE (%): FY26E|FY27E: -2|-
Revenue likely to grow 12% YoY to INR26b, aided by ramp-
EBITDA margins to gradually improve QoQ as plants ramp-up.
up of new plants.
Expect margins to be down 30bp YoY at 10.4%.
We expect 7% YoY earnings growth for 2Q.
MSUMI: Quarterly performance
Y/E March
Net Sales
YoY Change (%)
RM Cost (% of sales)
Staff Cost (% of sales)
Other Expenses (% of sales)
EBITDA
Margins (%)
Depreciation
Interest
Other Income
PBT before EO expense
PBT after EO Expense
Tax Rate (%)
Reported PAT
Adj PAT
YoY Change (%)
E: MOFSL Estimates
1Q
21,848
16.7
65.1
17.2
6.7
2,388
10.9
399
55
50
1,984
1,984
25
1,489
1,489
20.9
FY25
2Q
3Q
23,256 23,003
10.5
8.8
64.9
64.9
17.3
17.9
7.1
6.8
2,496
2,376
10.7
10.3
444
470
72
66
48
6
2,027
1,846
2,027
1,846
25
24
1,521
1,400
1,521
1,400
-2.4
-16.6
4Q
25,095
12.4
65.7
16.5
7.0
2,712
10.8
476
55
16
2,197
2,197
25
1,649
1,649
-13.8
1Q
24,940
14.2
64.7
19.1
6.4
2,443
9.8
492
63
9
1,896
1,896
25
1,431
1,431
-3.9
FY26E
2QE
3QE
26,047 26,453
12.0
15.0
64.7
64.6
18.5
18.4
6.4
6.4
2,708
2,791
10.4
10.6
515
525
58
55
20
25
2,155
2,236
2,155
2,236
25
25
1,627
1,689
1,627
1,689
7.0
20.6
FY25
4QE
27,878
11.1
64.1
18.3
6.7
3,044
10.9
566
54
24
2,447
2,447
24
1,848
1,848
12.1
93,203
11.9
65.2
17.2
6.9
9,972
10.7
1,789
248
119
8,055
8,055
25
6,060
6,060
-5.1
(INR M)
FY26E
105,319
13.0
64.5
18.6
6.5
10,985
10.4
2,098
230
77
8,734
8,734
25
6,595
6,595
8.8
MRF
CMP: INR1,48,630 | TP: INR125,764 (-15%)
Expect 12% YoY revenue growth, due to a low base and
steady growth in OE demand.
Standalone - Quarterly Earning Model
Y/E March
Net Sales
YoY Change (%)
Total Expenditure
EBITDA
Margins (%)
Depreciation
Interest
Other Income
PBT before EO expense
Extra-Ord expense
PBT
Tax
Rate (%)
Reported PAT
Adj PAT
YoY Change (%)
Margins (%)
1Q
70,778
11.9
59,400
11,378
16.1
3,943
754
827
7,509
0
7,509
1,883
25.1
5,625
5,625
-3.3
7.9
FY25
2Q
3Q
67,604 68,832
11.1
13.8
57,869 60,814
9,734
8,018
14.4
11.6
4,079
4,143
667
711
1,121
966
6,109
4,130
0
0
6,109
4,130
1,555
1,063
25.4
25.7
4,554
3,067
4,554
3,067
-20.4
-39.6
6.7
4.5
Sell
EPS CHANGE (%): FY26E|FY27E: 4 |7
We expect EBITDA margin to improve 50bp QoQ to 14.2%, led
by reduced input costs.
FY26E
2QE
3QE
75,716 76,403
12.0
11.0
64,964 65,096
10,752 11,308
14.2
14.8
4,380
4,470
800
820
1,125
1,050
6,697
7,068
0
0
6,697
7,068
1,681
1,823
25.1
25.8
5,016
5,244
5,016
5,244
10.1
71.0
6.6
6.9
FY25
4QE
76,910
10.8
65,049
11,861
15.4
4,628
570
1,007
7,671
0
7,671
1,956
25.5
5,715
5,715
14.8
7.4
276,652
12.1
237,094
39,559
14.3
16,474
2,914
4,029
24,199
0
24,199
5,974
24.7
18,225
18,225
-14.4
6.6
(INR M)
FY26E
304,632
10.1
260,368
44,264
14.5
17,747
3,011
4,437
27,942
0
27,942
7,125
25.5
20,817
20,817
14.2
6.8
4Q
1Q
69,438 75,603
11.7
6.8
59,011 65,259
10,428 10,343
15.0
13.7
4,310
4,270
782
822
1,115
1,255
6,451
6,507
0
0
6,451
6,507
1,472
1,665
22.8
25.6
4,978
4,842
4,978
4,842
6.1
-13.9
7.2
6.4
October 2025
62
 Motilal Oswal Financial Services
September 2025 Results Preview | Sector: Automobiles
Sona Comstar
Neutral
CMP: INR414| TP: INR447 (8%)
EPS CHANGE (%): FY26E|FY27E: 4|3
Core business (ex tractors) revenue may decline 4% YoY but
We expect the core business to post 50bp margin
pick up QoQ. Revenue decline YoY is largely due to the
improvement QoQ (-290bp YoY).
slowdown in the US market and weak ramp-up at one of its
Overall, we expect the PAT for the core business to decline
key EV customers. We understand that availability of rare
10% YoY to INR1.4b led by continued margin pressure.
earth has been better in 2Q QoQ.
Quarterly Performance(ex tractor)
Y/E March
Net operating revenues
Change (%)
EBITDA
EBITDA Margins (%)
Depreciation
EBIT
EBIT Margins (%)
Interest
Non-Operating Income
PBT
Effective Tax Rate (%)
Adjusted PAT
Change (%)
1Q
8,930
22.0
2,512
28.1
606
1,905
21.3
86
70
1,889
25.0
1,417
24.0
FY25
2Q
9,251
17.0
2,549
27.6
626
1,923
20.8
106
210
1,918
25.1
1,546
20.2
3Q
8,680
11.8
2,342
27.0
666
1,677
19.3
58
468
2,030
25.8
1,564
17.1
4Q
8,494
-4.0
2,160
25.4
646
1,513
17.8
52
522
2,147
23.8
1,473
-0.6
1Q
8,013
-10.3
1,936
24.2
650
1,286
16.1
50
427
1,571
26.4
1,248
-11.9
FY26E
2QE
3QE
8,883
9,515
-4.0
9.6
2,194
2,379
24.7
25.0
680
730
1,514
1,649
17.0
17.3
35
45
350
250
1,829
1,854
25.2
25.2
1,368
1,387
-9.9
-10.6
FY25
4QE
9,833
15.8
2,500
25.4
780
1,720
17.5
52
331
1,999
25.4
1,492
-1.4
35,545
11.6
9,753
27.4
2,544
7,209
20.3
302
1,269
8,173
24.2
6,200
27.3
FY26E
35,254
-0.8
9,009
24.9
2,840
6,169
17.0
182
1,358
7,345
0.3
5,494
-11.4
Tata Motors
Neutral
CMP: INR718 | TP: INR687 (-4%)
EPS CHANGE (%): FY26E|FY27E: -8|5
India PV volumes rose 10.5% YoY. India CV volumes grew
JLR volumes to be impacted by the cyberattack that led to
12% YoY for 2Q.
production shutdown in Sep. While retails unlikely to be hit
India PV margins are likely to pick up QoQ due to improved
materially, wholesale volumes may fall 24% YoY.
volumes partially offset by high discounts. We expect
EBITDA margin is likely to contract ~190bp QoQ to 7.4%.
margins at 4.9% (-130bp YoY). India CV margins to improve
The record date for demerger for PV (India + JLR) business is
50bp QoQ and 190bp YoY to 12.6%.
14th Oct’25.
Quarterly Performance [Consol]
1Q
97.8
74,400
15.8
93.7
1910.1
11.6
138.8
856.8
5.8
1080.5
5.7
155.1
14.4
65.7
15.8
20.9
87.4
36.4
55.6
-1.3
1.3
55.4
46.2
FY25
2Q
3Q
87.3
104.4
74,167 71,686
11.7
14.2
86.0
98.4
2014.9 1896.6
10.7
12.2
130.5
139.8
903.1
902.2
6.2
7.6
1014.5 1135.8
-3.5
2.7
117.4
130.3
11.6
11.5
60.1
54.1
15.7
17.9
20.3
17.3
56.9
77.1
40.8
27.2
33.7
56.2
-1.1
-1.3
0.8
-0.4
33.4
54.7
-13.6
-23.0
4Q
111.4
69,355
15.3
108.2
1991.4
12.2
147.0
870.4
7.8
1195.0
-0.4
166.3
13.9
53.0
15.1
10.8
113.9
25.9
84.4
-0.9
1.1
88.9
15.1
1Q
87.3
75,659
9.3
88.1
1938.8
12.1
124.8
881.6
4.0
1044.1
-3.4
97.2
9.3
53.2
15.2
9.4
54.3
28.7
38.7
-0.8
1.3
39.7
-28.3
FY26E
2QE
3QE
66.3
98.0
75,650 75,271
7.4
8.5
97.2
110.6
1994.7 1972.5
12.6
12.6
144.4
156.6
876.0
902.2
4.9
5.4
925.7 1248.5
-8.8
9.9
77.6
98.1
8.4
7.9
48.0
55.0
13.5
15.0
10.2
13.5
32.9
44.6
30.6
30.6
22.8
31.0
-0.7
-0.8
0.8
0.7
22.9
30.9
-31.4
-43.6
FY25
4QE
109.2
75,458
11.9
113.9
2033.9
12.7
164.2
917.6
5.4
1471.8
23.2
151.2
10.3
58.7
13.3
16.1
89.8
31.7
61.3
-1.2
0.7
60.8
-31.6
400.9
72,240
14.3
386.3
1948.8
11.7
556.1
882.5
6.9
4397.0
0.4
551.3
12.5
232.6
62.4
50.8
334.3
31.4
229.3
-3.2
2.9
232.6
3.4
(INR b)
FY26E
360.7
75,491
9.5
409.9
1987.8
12.5
590.0
895.7
5.0
4690.1
6.7
424.1
9.0
214.9
57.0
49.1
221.5
30.6
153.8
-3.5
3.5
154.3
-33.7
JLR Volumes (incl JV; '000 units)
JLR Realizations (GBP/unit)
JLR EBITDA Margins (%)
India CV Volumes ('000 units)
India CV Realizations (INR '000/unit)
India CV EBITDA Margins (%)
India PV Volumes ('000 units)
India PV Realizations (INR '000/unit)
India PV EBITDA Margins (%)
Net Consol. Op Income
Growth (%)
Consol. EBITDA
EBITDA Margins (%)
Depreciation
Other Income
Interest Expenses
PBT after EO Exp
Tax rate (%)
PAT
Minority Interest
Share in profit of Associate
Adj PAT
Growth (%)
October 2025
63
 Motilal Oswal Financial Services
September 2025 Results Preview | Sector: Automobiles
TVS Motor Company
Neutral
CMP: INR3,457 | TP: INR3,549 (3%)
EPS CHANGE (%): FY26E|FY27E: 1|-
TVS continued to outperform 2W peers with 23% YoY
Led by strong volume growth, we expect EBITDA margin to
growth in 2Q, led by strong growth in scooters (+30%),
expand 50bp QoQ (+130bp YoY) to 13%.
motorcycles (+20%) and 3W (+41%). Exports rose 40% YoY.
We expect TVSL to post 49% YoY growth in earnings in 2Q.
S/A Quarterly Performance
Y/E March (INR m)
Vols ('000 units)
Growth (%)
Realn (INR '000/unit)
Growth (%)
Net Sales
Growth (%)
RM (% of sales)
Emp cost ( % of sales)
Other exp (% of sales)
EBITDA
EBITDA Margin (%)
Interest
Depreciation
Other Income
PBT before EO Exp
EO Exp
PBT after EO Exp
Tax
Tax rate (%)
Adjusted PAT
Growth (%)
1Q
1,087.2
14.1
77.0
1.7
83,756
16.0
71.4
5.7
11.4
9,602
11.5
372
1,763
363
7,829
0
7,829
2,056
26.3
5,773
23.4
FY25
2Q
3Q
1,228.2 1,212.0
14.3
10.1
75.1
75.1
(0.9)
0.2
92,282
90,971
13.3
10.3
71.5
71.6
5.4
5.5
11.4
11.1
10,798
10,815
11.7
11.9
319
338
1,806
1,883
299
-227
8,972
8,367
0
0
8,972
8,367
2,346
2,182
26.1
26.1
6,626
6,185
23.5
4.2
FY26E
2QE
3QE
1,507.0 1,435.4
22.7
18.4
78.9
78.8
5.0
5.0
118,886 113,134
28.8
24.4
71.6
71.4
5.2
5.3
10.2
10.5
15,455
14,481
13.0
12.8
400
390
2,050
2,100
120
80
13,125
12,071
0
0
13,125
12,071
3,177
3,177
25.0
25.0
9,844
9,053
48.6
46.4
FY25
4QE
1,514.5
24.5
79.0
0.6
119,633
25.3
71.2
5.4
10.4
15,575
13.0
378
2,122
77
13,152
0
13,152
3,042
23.9
10,110
18.7
4,744
13.2
76.4
0.8
362,513
14.1
71.1
5.4
11.2
44,540
12.3
1,387
7,446
580
36,288
36,288
9,183
25.3
27,105
30.1
FY26E
5,734
36.8
78.9
4.1
452,463
42.4
71.4
5.4
10.4
58,142
12.9
1,571
8,311
620
48,879
48,879
12,709
26.0
31,934
33.4
4Q
1,216.3
14.2
78.5
2.4
95,504
16.9
69.8
5.2
11.0
13,326
14.0
358
1,994
145
11,120
1,617
12,737
2,599
20.4
8,521
75.5
1Q
1,277.0
17.5
78.9
2.5
100,810
20.4
71.2
5.8
10.5
12,630
12.5
403
2,039
343
10,531
0
10,531
2,745
26.1
7,786
34.9
Tube Investments
CMP: INR3,082 | TP: INR3,716 (+21%)
We expect TI to post steady 3% YoY growth in revenues in
2Q.
While metal formed division is expected to grow by 6% YoY,
mobility/engineering divisions are expected to grow ~1%/5%
YoY. Revenue from other business to grow ~2% YoY.
Quarterly performance (S/A)
Y/E March
Net Sales
YoY Change (%)
EBITDA
Margins (%)
Depreciation
Interest
Other Income
PBT before EO expense
Tax
Tax Rate (%)
Adj PAT
YoY Change (%)
E: MOFSL Estimates
1Q
19,603
10.1
2,400
12.2
386
72
137
2,079
534
25.7
1,545
4.6
FY25
2Q
3Q
20,648 19,102
4.8
0.6
2,460
2,431
11.9
12.7
407
432
69
54
261
175
2,245
2,120
567
512
25.3
24.2
1,678
1,607
-7.5
2.1
4Q
19,573
-0.3
2,280
11.6
463
52
1,502
3,267
664
20.3
2,603
5.0
1Q
20,066
2.4
2,474
12.3
450
37
234
2,221
540
24.3
1,681
8.8
FY26E
2QE
3QE
21,342 20,969
3.4
9.8
2,600
2,589
12.2
12.3
460
470
40
45
250
200
2,350
2,274
565
546
24.0
24.0
1,786
1,728
6.4
7.5
Buy
EPS CHANGE (%): FY26E|FY27E: -|-
We expect EBITDA margin to largely remain stable YoY at
12.2%.
Overall, we expect standalone entity to post 6% YoY growth
in earnings in 2Q.
(INR M)
FY25 FY26E
4QE
22,072 78,925 84,449
12.8
3.7
7.0
2,676 9,606 10,339
12.1
12.2
12.2
478 1,688 1,858
53
247
175
1,543 2,075 2,228
3,688 9,745 10,533
824 2,277 2,475
22.4
23.4
23.5
2,864 7,468 8,058
10.0
1.7
7.9
October 2025
64
 Motilal Oswal Financial Services
September 2025 Results Preview | Sector: Capital Goods
Capital Goods
Company
ABB India
Bharat Dynamics
Bharat Electronics
Cummins India
Hindustan Aeronautics
Hitachi Energy India
Kalpataru Projects International
KEC International
Kirloskar Oil Engines
L&T
Siemens
Siemens Energy
Company
Thermax
ABB India
Triveni
Electronics
Bharat
Turbine
Zen Technologies
Cummins India
Company
Hitachi Energy India
ABB India
Kalpataru Projects International
Bharat Electronics
KEC International
Cummins
Oil Engines
Kirloskar
India
Hindustan Aeronautics
L&T
Hitachi Energy India
Siemens
Kalpataru
Thermax
Projects International
KEC International
Triveni Turbine
Kirloskar Oil Engines
L&T
Siemens
Thermax
Triveni Turbine
Zen Technologies
Activity remains strong in select pockets
During 2QFY26, the capital goods sector witnessed multiple positive developments: 1) the
CEA pipeline with projects worth ~INR333b recommended by the NCT over the past three
months, 2) MoD’s TPCR 2025 outlines 15-year
sectoral needs, targeting annual defense
spending of USD25-30b, and 3) benign commodity prices. In our recent reports, we
highlighted two much-awaited defense orders, i.e.,
additional 97 Tejas Mk1A jets
and
RFP
issuance for the QRSAM.
Although the sector has seen positive developments, a broad-based
revival in government and private capex is yet to be seen. For our coverage companies, we
expect margins to contract ~50bp YoY in 2QFY26 mainly due to lower margin assumptions
for product companies. However, sequentially, we expect a ~40bp expansion in margins. For
2QFY26, we estimate our coverage companies to report revenue growth of 15% YoY, EBITDA
growth of 11% YoY, and PAT growth of 14% YoY. We maintain our view that valuation re-
rating for the sector is contingent upon a broad-based capex revival. We reiterate our
positive stance on LT, Cummins India (KKC), and Siemens Energy in the large-cap space and
Kirloskar Oil Engines (KOEL) and Kalpataru Projects International (KPIL) in the mid- and small-
cap segments. In the defense sector, Bharat Electronics (BHE) remains our top pick.
Ordering momentum stable with large-size order wins
Ordering activity during the quarter remained strong yet selective, with traction seen
across defense, power T&D, renewables, thermal, hydrocarbon, and buildings &
factories segments. During the quarter, notable wins included two ultra-mega projects
for L&T in the thermal and hydrocarbon segments, a significant contract from NPCIL,
and large orders in power T&D, heavy civil, high-speed rail, renewables, and metals &
minerals. HAL secured an INR630b contract for 97 additional LCA Mk-1A aircraft, while
the Indian Army issued a tender to BHE for the QRSAM project valued at INR300b. ABB
was awarded an INR1.7b order from Siemens Gamesa, Chennai, for the supply of 3.X
wind turbine converters. During 2QFY26, BHE booked orders worth ~INR52b, KECI
secured ~INR61.5b, and KPIL acquired ~INR27.2b. Supported by a strong order backlog
and the expected finalization of pending pipeline opportunities, we estimate 15% YoY
growth in execution for our coverage universe in 2QFY26.
Recent developments in the defense sector
The recently announced Technology Perspective and Capability Roadmap (TPCR)
2025 outlines
the Indian Armed Forces’ future technology and capability
requirements over the next 15 years spread across domains like land systems,
aviation, maritime, space, cyber, artificial intelligence, robotics, electronic warfare,
and unmanned systems. Further, the revised Defense Procurement Manual (DPM)
2025 aims to streamline approvals by reducing bureaucratic hurdles, which will help
the armed forces maintain operational readiness with quicker access to equipment,
repairs and ammunitions. The Defence Ministry
is also encouraging private players’
participation in large projects and moving away from nomination-based tendering.
During the quarter, L&T and BHE formed a strategic partnership to participate in the
AMCA program of the Indian Air Force. The ongoing emergency procurement
program and the expected DAC meeting in the coming weeks will be keenly watched
in the near term, and the budgetary allocation for defense will be looked out for in
the medium term.
Research Analyst
October 2025
Teena Virmani
(Teena.Virmani@MotilalOswal.com)
Vatsal Magajwala
(Vatsal.Magajwala@MotilalOswal.com)
| Prerit Jain
(Prerit.Jain@MotilalOswal.com)
65
 Motilal Oswal Financial Services
September 2025 Results Preview | Sector: Capital Goods
Commodity prices remain benign
With commodity prices being broadly benign during the quarter, we expect EPC
companies’ margins to remain flat QoQ, with management guiding for YoY margin
expansion for the full year. Following the uptick seen in FY25, input costs have eased,
creating a supportive backdrop. Notably, prices of aluminum/zinc/copper have eased
2%/1%/4% vs.
Mar’25 levels, while HRC prices have remained stable.
Product-oriented
companies’
margins would be dependent upon the revenue mix.
In defense, the margin
outlook is supported by higher levels of indigenization and localization of critical
components. We expect ~50bp YoY margin contraction in 2QFY26 for our coverage
universe mainly due to a high base of margins for select companies like ABB and Triveni
Turbine last year. Sequentially, we expect margin to expand ~40bp.
Export prospects building up for domestic players
Export performance is gradually improving for companies. Overall, engineering
companies have shown their intent to ramp up exports in FY26 after cautiously
evaluating export markets amid the current geopolitical situation. EPC exports are
gaining from consistent global investments in grid expansion, modernization,
transmission, renewables, and decarbonization projects, and we expect this
trajectory to continue going forward. Defense export prospects have strengthened
following NATO’s announcement to raise defense
spending commitments. We will
be watchful of the current geopolitical scenarios and overall export trajectory of the
companies.
View: Selective stance continues
Our selective stance continues on the sector and we continue to prefer companies
in T&D, renewables and defense sectors. We maintain our view that valuation re-
rating for the sector is contingent upon a broad-based capex revival. Companies that
are growing at a high pace will remain preferred bets over the medium to long term.
Our top picks
We continue to prefer
L&T, KKC, and Siemens Energy
in the large-cap industrial
space and
KOEL and KPIL
in the mid- and small-cap segments.
BHE
continues to
remain our top pick in the defense sector.
October 2025
66
 Motilal Oswal Financial Services
September 2025 Results Preview | Sector: Capital Goods
Exhibit 1: Summary of
quarterly earnings estimates
SALES (INR m)
EBITDA (INR m)
Sector
RECO
Var
Var
Var
Var
Sep-25
Sep-25
% YoY
% QoQ
% YoY
% QoQ
ABB India
5198
Buy
33,412
14.7
5.2
4,778
-11.6
15.4
Bharat Dynamics
1542
Buy
7,095
30.2
186.2
1,419
43.6
LP
Bharat Electronics
407
Buy
52,580
14.7
19.0
14,408
3.8
16.2
Cummins India
3848
Buy
28,779
15.5
-1.0
5,756
19.7
-7.7
Hind.Aeronautics
4803
Buy
67,496
12.9
40.1
18,561
13.2
44.7
Hitachi Energy
18168
Sell
20,931
34.7
41.5
2,512
128.9
62.1
Kalpataru Proj.
1241
Buy
51,718
25.0
2.6
4,448
27.6
3.8
KEC International
854
Neutral 58,575
14.6
16.6
4,276
33.5
22.1
Kirloskar Oil
926
Buy
14,389
20.5
-0.4
1,871
13.4
-1.7
Larsen & Toubro
3670
Buy
7,15,302
16.2
12.3
69,844
9.8
10.6
Siemens
3123 Neutral 47,966
7.6
10.3
6,413
17.7
23.0
Siemens Energy
3400
Buy
20,412
-1.8
14.4
4,290
11.5
26.1
Thermax
3167
Sell
28,863
10.5
34.2
2,763
-0.6
22.7
Triveni Turbine
524
Buy
4,972
-0.8
33.9
1,019
-8.5
38.5
Zen Technologies
1464 Neutral
1,379
-42.9
24.2
483
-39.2
26.9
Capital Goods
11,53,868
15.4
14.2
1,42,840
11.1
17.5
ABB: December ending; siemens energy: September ending; SIEM: March ending
CMP
(INR)
NET PROFIT (INR m)
Var
Var
Sep-25
% YoY
% QoQ
3,949
-10.3
12.2
1,637
33.6
792.1
11,178
2.4
15.3
5,264
16.8
-5.2
17,548
16.6
26.8
1,856
254.9
41.0
1,973
49.1
-1.7
1,706
99.7
36.9
1,199
8.0
-2.3
38,815
14.3
7.3
5,179
-0.9
22.3
4,126
50.8
57.1
1,779
-10.2
17.4
849
-6.7
31.8
398
-38.9
7.3
97,456
14.2
15.8
Exhibit 2:
Comparative valuations
EPS (INR)
PE (x)
PB (x)
ROE (%)
FY26E FY27E FY28E FY26E FY27E FY28E FY26E FY27E FY28E FY26E FY27E FY28E
Capital Goods
39.1
33.2
27.4
7.3
6.3
5.4
18.7
18.9
19.5
ABB India
5,198
Buy
80.0
95.1 111.9 64.9
54.6
46.5
14.2
12.8
11.6
22.8
24.6
26.2
Bharat Dynamics
1,542
Buy
28.2
37.8
52.0
54.6
40.7
29.7
11.7
9.5
7.5
21.5
23.3
25.2
Bharat Electronics
407
Buy
8.2
9.8
11.7
49.5
41.4
34.7
11.9
9.5
7.7
24.0
22.9
22.1
Cummins India
3,848
Buy
83.5
98.4 114.3 46.1
39.1
33.7
13.4
11.8
10.4
30.9
32.1
32.8
Hind.Aeronautics
4,803
Buy
141.2 161.2 197.9 34.0
29.8
24.3
7.7
6.5
5.4
22.6
21.8
22.2
Hitachi Energy
18,168
Sell
177.4 238.4 319.9 102.4 76.2
56.8
15.4
12.8
10.4
15.9
17.6
19.2
Kalpataru Proj.
1,241
Buy
57.0
74.9
87.0
21.8
16.6
14.3
2.6
2.3
2.0
12.8
14.8
15.0
KEC International
854
Neutral 34.9
44.2
53.6
24.5
19.3
15.9
3.7
3.2
2.7
16.2
17.9
18.6
Kirloskar Oil
926
Buy
33.6
40.9
47.6
27.6
22.6
19.4
4.0
3.5
3.1
15.3
16.4
16.8
Larsen & Toubro
3,670
Buy
130.5 155.1 185.0 28.1
23.7
19.8
4.6
4.0
3.5
17.3
18.2
19.1
Siemens
3,123 Neutral 75.8
66.9
77.8
41.2
46.7
40.2
6.2
5.4
4.8
14.9
11.7
11.9
Siemens Energy
3,400
Buy
32.4
41.5
61.4 105.0 81.9
55.4
27.7
20.7
15.1
26.4
25.3
27.2
Thermax
3,167
Sell
68.0
79.8
94.6
46.6
39.7
33.5
6.4
5.7
5.0
14.6
15.2
15.9
Triveni Turbine
524
Buy
11.8
14.0
16.8
44.5
37.4
31.2
11.2
9.2
7.6
27.7
27.1
26.7
Zen Technologies
1,464 Neutral 28.9
45.5
61.1
50.6
32.2
24.0
6.8
5.6
4.5
14.3
19.1
20.9
For ABB India, FY26E/FY27E/FY28E indicate Dec’25/Dec’26/Dec’27 data; For siemens energy, FY26E/FY27E/FY28E indicate Sep’25/Sep’26/Sep’27
data; For SIEM, FY26E indicate 18 months Mar Y/E, and FY27E/FY28E indicate 12 months Mar Y/E
Company Name
CMP
(INR)
Reco
Exhibit 3:
Relative performance
three months (%)
Nifty Index
102
99
96
93
90
MOFSL Capital Goods Index
Exhibit 4:
Relative performance
one year (%)
Nifty Index
110
100
90
80
70
MOFSL Capital Goods Index
Source: Bloomberg, MOFSL
October 2025
67
 Motilal Oswal Financial Services
September 2025 Results Preview | Sector: Capital Goods
Exhibit 5:
EBITDA margin snapshot for EPC companies under our coverage
Aggregate EPC EBITDA margin (%)
10.7
10.4
10.3
9.7
10.9
10.5
10.0
10.6
10.2
9.8
9.9
9.4
9.6
9.5
Source: Company, MOFSL
Exhibit 6:
Gross margin snapshot for product companies under our coverage
Aggregate product gross margin (%)
50.4
48.2
44.1
42.6
44.8
43.3
44.8
43.8
48.2
45.9
45.0
42.6
43.4
42.9
Source: Company, MOFSL
Exhibit 7:
EBITDA margin snapshot for product companies under our coverage
Aggregate product EBITDA margin (%)
27.0
20.4
17.4
12.9
15.8
17.9
14.6
17.8
16.9
25.9
20.1
19.6
18.6
19.6
Source: Company, MOFSL
October 2025
68
 Motilal Oswal Financial Services
September 2025 Results Preview | Sector: Capital Goods
Input prices have been broadly benign YTD
Exhibit 8:
Primary rebar price trend (INR/ton)
Primary rebar (INR/ton)
77,000
69,000
61,000
53,000
45,000
3,000
2,500
Exhibit 9:
Aluminum price trend (USD/ton)
4,000
3,500
Aluminum (USD/ton)
2,000
Source: Bloomberg, MOFSL
Exhibit 10:
Copper price trend (USD/ton)
Copper (USD/ton)
10,500
9,500
8,500
7,500
6,500
Exhibit 11:
Zinc price trend (USD/ton)
Zinc (USD/ton)
4,800
4,100
3,400
2,700
2,000
Source: Bloomberg, MOFSL
October 2025
69
 Motilal Oswal Financial Services
September 2025 Results Preview | Sector: Capital Goods
The tables below provide a snapshot of actual and estimated numbers for companies under the MOFSL coverage
universe. Highlighted columns indicate the quarter/financial year under review.
ABB India
CMP: INR5,198 | TP: INR6,000 (+15%)
Expect revenue to grow 15% YoY, driven by strong
execution of base orders in Electrification/Motion, aided by
tailwinds in data centers, renewables and railways.
Key monitorables include order inflow improvement,
margin improvement, export outlook, and localization
levels.
Standalone - Quarterly Snapshot
Y/E December
Net Sales
YoY Change (%)
Total Expenditure
EBITDA
Margins (%)
Depreciation
Interest
Other Income
PBT before EO expense
PBT
Tax
Rate (%)
Reported PAT
Adj PAT
YoY Change (%)
Margins (%)
1Q
30,804
27.8
25,152
5,652
18.3
314
38
871
6,171
6,171
1,575
25.5
4,596
4,596
87.4
14.9
CY24
2Q
3Q
28,309 29,122
12.8
5.2
22,884 23,719
5,425
5,402
19.2
18.6
310
328
45
30
868
929
5,938
5,973
5,938
5,973
1,511
1,568
25.5
26.3
4,426
4,405
4,426
4,405
49.6
21.7
15.6
15.1
4Q
33,649
22.0
27,076
6,573
19.5
337
51
866
7,051
7,051
1,732
24.6
5,319
5,319
54.1
15.8
1Q
31,596
2.6
25,773
5,823
18.4
338
47
923
6,361
6,361
1,620
25.5
4,741
4,741
3.2
15.0
CY25E
2Q
3QE
31,754 33,412
12.2
14.7
27,614 28,634
4,141
4,778
13.0
14.3
355
336
42
36
998
874
4,741
5,279
4,741
5,279
1,220
1,330
25.7
25.2
3,521
3,949
3,521
3,949
-20.5
-10.3
11.1
11.8
CY24
Buy
EPS CHANGE (%): CY25|CY26: -|-
We expect margins to contract by ~430bp YoY due to QCO
compliance forcing higher-cost imports, along with forex
volatility and pricing pressure in motors.
We will watch out for incremental inflows from
transmission, railways, data centers, transportation, F&B,
and private capex to support order inflow growth.
(INR m)
CY25E
4QE
37,971 1,21,883 1,34,733
12.8
16.7
10.5
32,194
98,831 1,14,214
5,777
23,052
20,519
15.2
18.9
15.2
336
1,289
1,365
20
165
145
874
3,534
3,668
6,295
25,133
22,677
6,295
25,133
22,677
1,544
6,387
5,715
24.5
25.4
25.2
4,752
18,746
16,962
4,752
18,746
16,962
-10.7
50.2
-9.5
12.5
15.4
12.6
Bharat Dynamics
CMP: INR1,542 | TP: INR1,900 (+23%)
We expect revenue to grow 30% YoY, driven by the healthy
execution of the opening order book.
Key monitorables include emergency procurement orders
for MPATGM, VSHORAD, ALWT, and other missile
systems.
Standalone - Quarterly Snapshot
Income Statement
Y/E March
Net revenue
Change (%)
Expenses
EBITDA
As of % Sales
Depreciation
Interest
Other Income
PBT
Tax
Effective Tax Rate (%)
Extra-ordinary Items
Reported PAT
Adj PAT
Change (%)
As of % Sales
1Q
1,912
-35.8
2,435
-523
-27.4
157
12
804
112
40
35.8
0
72
72
-82.7
3.8
FY25
2Q
5,448
-11.5
4,459
988
18.1
177
7
860
1,665
439
26.4
0
1,225
1,225
-16.7
22.5
3Q
8,321
38.3
7,053
1,269
15.2
177
7
844
1,929
458
23.7
0
1,471
1,471
9.0
17.7
4Q
17,770
108.0
14,780
2,990
16.8
197
7
996
3,782
1,054
27.9
0
2,728
2,728
-5.5
15.4
1Q
2,479
29.7
2,933
-454
-18.3
177
7
869
231
48
20.7
0
183
183
154.3
7.4
FY26
2QE
3QE
7,095 11,443
30.2
37.5
5,676
8,583
1,419
2,861
20.0
25.0
187
196
8
8
989
1,036
2,212
3,692
575
960
26.0
26.0
0
0
1,637
2,732
1,637
2,732
33.6
85.7
23.1
23.9
FY25
4QE
24,756
39.3
17,699
7,057
28.5
216
10
1,139
7,971
2,168
27.2
0
5,802
5,802
112.7
23.4
33,451
41.2
28,727
4,724
14.1
707
33
3,504
7,488
1,991
26.6
0
5,496
5,496
-10.3
16.4
Buy
EPS CHANGE (%): FY26|FY27: -|-
We expect margins to expand 190bp YoY as execution
scales up.
The execution of orders, finalization of tender for QRSAM
from BHE to BDL should drive margin improvement going
forward.
(INR m)
FY26E
45,773
36.8
34,890
10,883
23.8
776
33
4,033
14,106
3,751
26.6
0
10,355
10,355
88.4
22.6
October 2025
70
 Motilal Oswal Financial Services
September 2025 Results Preview | Sector: Capital Goods
Bharat Electronics
CMP: INR407 | TP: INR490 (+21%)
We expect revenue growth of 15% YoY, led by the healthy
execution of the order book of INR749b.
Key monitorables include update on orders for sub-
systems and 97 LCA MK1A aircraft, execution of orders for
LRSAM and EW projects, incremental share of exports,
and working capital cycle.
Standalone Quarterly Performance
Y/E March
Net Sales
Change (%)
EBITDA
Change (%)
As of % Sales
Depreciation
Interest
Other Income
PBT
Tax
Effective Tax Rate (%)
Reported PAT
Change (%)
Adj PAT
Change (%)
1Q
41,988
19.6
9,367
41.0
22.3
997
12
2,015
10,373
2,612
25.2
7,761
46.2
7,761
46.2
FY25
2Q
3Q
45,834
57,561
14.8
39.1
13,885
16,533
38.2
57.5
30.3
28.7
1,032
1,029
13
13
1,668
2,051
14,509
17,542
3,596
4,381
24.8
25.0
10,913
13,161
34.3
47.3
10,913
13,161
34.3
47.3
4Q
91,197
6.9
27,890
22.3
30.6
1,298
58
1,942
28,476
7,428
26.1
21,048
18.0
21,048
18.0
1Q
44,168
5.2
12,399
32.4
28.1
1,129
14
1,636
12,892
3,201
24.8
9,691
24.9
9,691
24.9
FY26E
2QE
3QE
4QE
52,580
66,417 1,13,572
14.7
15.4
24.5
14,408
18,530
32,048
3.8
12.1
14.9
27.4
27.9
28.2
1,212
1,242
1,386
13
13
55
1,803
2,213
2,545
14,987
19,489
33,152
3,809
4,953
8,500
25.4
25.4
25.6
11,178
14,536
24,652
2.4
10.5
17.1
11,178
14,536
24,652
2.4
10.5
17.1
FY25
2,36,580
17.3
67,676
35.4
28.6
4,356
96
7,676
70,900
18,017
25.4
52,883
31.5
52,883
31.5
Buy
EPS CHANGE (%): FY26|FY27: -|-
We expect margins to contract 290bp YoY to 27.4% on a
high base.
The status of EoI for AMCA, finalization of emergency
procurement-related orders, execution of the huge
backlog, and further indigenization of modules and
subsystems will remain key areas of focus.
(INR m)
FY26E
2,76,738
17.0
77,386
14.3
28.0
4,968
96
8,198
80,520
20,462
25.4
60,058
13.6
60,058
13.6
Cummins India
CMP: INR3,848 | TP: INR4,500 (+17%)
We expect revenue to grow 16% YoY, driven by a broad-
based improvement across all segments.
Key monitorables include demand outlook across
segments, the pricing environment in Powergen, and the
export trajectory.
Standalone - Quarterly Earnings Model
Y/E March
Net Sales
YoY Change (%)
Total Expenditure
EBITDA
Margins (%)
Depreciation
Interest
Other Income
PBT before EO expense
Extra-Ord expense
PBT
Tax
Rate (%)
Reported PAT
Adj PAT
YoY Change (%)
Margins (%)
1Q
23,042
4.3
18,369
4,673
20.3
439
48
1,322
5,509
5,509
1,311
23.8
4,198
4,198
33.0
18.2
FY25
2Q
3Q
24,923 30,860
31.2
21.8
20,113 24,860
4,810
6,000
19.3
19.4
452
481
26
27
1,611
1,209
5,944
6,702
5,944
1,438
24.2
4,506
4,506
37.2
18.1
6,702
1,562
23.3
5,140
5,140
12.7
16.7
4Q
24,569
6.1
19,372
5,197
21.2
457
52
2,119
6,807
6,807
1,593
23.4
5,214
5,214
-7.2
21.2
1Q
29,068
26.2
22,833
6,235
21.4
479
27
1,529
7,258
-442
7,700
1,807
23.5
5,893
5,555
32.3
19.1
FY26E
2QE
3QE
28,779 31,903
15.5
3.4
23,023 25,714
5,756
6,189
20.0
19.4
483
507
42
46
1,695
1,857
6,926
7,493
-
-
6,926
7,493
1,662
1,873
24.0
25.0
5,264
5,619
5,264
5,619
16.8
9.3
18.3
17.6
FY25
Buy
EPS CHANGE (%): FY26|FY27: -|-
We expect EBITDA margin to expand ~70bp YoY, broadly
in line with overall management commentary on margins.
We expect the powergen segment to benefit from volume
recovery and prices to remain stable. We also expect
exports to grow 10% YoY.
(INR m)
FY26E
4QE
31,125 1,03,394 1,20,875
26.7
15.4
16.9
25,482
82,714 97,052
5,644
20,680 23,824
18.1
20.0
19.7
507
1,829
1,976
51
151
166
2,043
6,261
7,124
7,128
24,961 28,805
-
-
-442
7,128
24,961 29,246
1,585
5,904
6,927
22.2
23.7
23.7
5,543
19,058 22,319
5,544
19,058 21,982
6.3
14.7
15.3
17.8
18.4
18.2
October 2025
71
 Motilal Oswal Financial Services
September 2025 Results Preview | Sector: Capital Goods
Hindustan Aeronautics
CMP: INR4,803 | TP: INR5,800 (+21%)
We expect revenue growth of 13% YoY, driven by a
healthy execution of the opening order book.
Key monitorables include the working capital cycle, and
the status of Tejas Mk1a deliveries, MoU with GE and
related orders for Su-30 avionics upgrade project.
Consolidated - Quarterly Snapshot
Income Statement
Y/E March
Net Sales
Change (%)
Expenses
EBITDA
As of % Sales
Depreciation
Interest
Other Income
PBT pre EO items
Extra-ordinary Items
PBT
Tax
Effective Tax Rate (%)
MI & P/L Share of JV
Reported PAT
Adj PAT
Margin (%)
Change (%)
1Q
43.5
11.0
33.6
9.9
22.8
1.5
0.0
7.4
15.8
-
15.8
1.5
9.3
0.1
14.4
14.4
33.1
76.5
FY25
2Q
59.8
6.0
43.4
16.4
27.4
1.8
0.0
5.4
20.0
0.1
20.1
5.1
25.5
0.1
15.1
15.0
25.2
21.7
3Q
69.6
14.8
52.7
16.8
24.2
2.8
0.0
6.3
20.4
-
20.4
6.0
29.6
0.1
14.4
14.4
20.7
14.1
4Q
137.0
(7.2)
84.0
52.9
38.6
7.4
0.1
6.5
52.0
-
52.0
12.4
23.9
0.2
39.8
39.8
29.0
(7.7)
1Q
48.2
10.8
35.4
12.8
26.6
1.9
0.0
7.5
18.4
-
18.4
4.7
25.5
0.1
13.8
13.8
28.7
(3.7)
FY26E
2QE
67.5
12.9
48.9
18.6
27.5
2.8
0.0
7.6
23.3
-
23.3
5.9
25.3
0.1
17.5
17.5
26.0
16.6
FY25
3QE
78.7
13.2
59.1
19.7
25.0
3.1
0.0
7.7
24.3
-
24.3
6.1
25.3
0.1
18.2
18.2
23.2
26.7
4QE
180.5
31.8
119.8
60.7
33.6
7.7
0.1
6.7
59.7
-
59.7
15.1
25.2
0.1
44.8
44.8
24.8
12.7
309.8
3.9
213.7
96.1
31.0
13.4
0.1
25.6
108.2
0.1
108.3
25.0
23.1
0.4
83.6
83.6
27.0
38.4
Buy
EPS CHANGE (%): FY26|FY27: -|-
We expect EBITDA margin to expand ~10bp YoY even on a
high base, aided by increased indigenization and easing of
supply chain issues.
The execution of a huge order backlog, any major
provisions, incremental inflows, and margin will be the key
focus areas.
(INR b)
FY26E
375.0
21.0
263.2
111.8
29.8
15.4
0.1
29.4
125.8
-
125.8
31.8
25.3
0.5
94.4
94.4
25.2
13.0
Hitachi Energy India
CMP: INR18,168 | TP: INR16,500 (-9%)
We expect revenue growth of 35% YoY, led by healthy
execution of the opening order book of INR291b.
Key monitorables include further ramp-up in margins,
progress on HVDC project execution, and STATCOM order
finalization.
Standalone - Quarterly Snapshot
Y/E March
Net Sales
Change (%)
EBITDA
Change (%)
As % of Sales
Depreciation
Interest
Other Income
PBT
Tax
Effective Tax Rate (%)
Extra-ordinary Items
Reported PAT
Change (%)
Adj PAT
Change (%)
As % of Sales
1Q
13,272
27.6
479
42.3
3.6
221
109
1
150
46
30.8
104
332.4
104
332.4
2.5
FY25
2Q
3Q
15,537 16,203
26.5
27.2
1,097
1,669
68.0
145.5
7.1
10.3
228
230
164
120
1
2
706
1,322
183
467
25.9
35.3
519
523
1,374
111.4
498.1
523
855
111.4
272.1
0.7
1.7
4Q
18,837
11.1
2,713
49.1
14.4
235
60
182
2,600
628
24.1
(134)
1,839
61.8
1,973
73.5
0.4
1Q
14,789
11.4
1,549
223.4
10.5
250
40
509
1,769
453
25.6
1,316
1,163.0
1,316
1,163.0
7.9
FY26E
2QE
3QE
20,931 21,827
34.7
34.7
2,512
2,837
128.9
70.0
12.0
13.0
282
282
113
116
450
300
2,567
2,740
711
759
27.7
27.7
1,856
254.9
1,856
254.9
1.2
1,981
44.2
1,981
131.8
0.6
4QE
28,466
51.1
4,252
56.8
14.9
313
184
117
3,872
1,111
28.7
2,761
50.2
2,761
40.0
0.1
Sell
EPS CHANGE (%): FY26|FY27: -|-
We expect EBITDA margin to expand ~490bp YoY, aided by
operating leverage gains and improved order book mix.
The execution of product and export orders is expected to
support revenue and margin in the near term.
(INR m)
FY25 FY26E
63,849
21.9
5,958
70.7
9.3
914
452
186
4,778
1,324
27.7
386
3,840
110.9
3,454
110.9
0.2
86,012
34.7
11,150
87.1
13.0
1,126
452
1,376
10,948
3,034
27.7
7,914
129.1
7,914
129.1
0.2
October 2025
72
 Motilal Oswal Financial Services
September 2025 Results Preview | Sector: Capital Goods
Kalpataru Projects International
CMP: INR1,241 | TP: INR1,450 (+17%)
We expect revenue growth of 25% YoY on strong
execution across segments such as T&D, B&F, and O&G,
barring the water and railway segment, which is still slow.
Key monitorables include execution ramp-up, margin
trajectory, customer collections, and outlook on the
urban infra and railways division.
Standalone - Quarterly Snapshot
Y/E March
Net Sales
YoY Change (%)
Total Expenditure
EBITDA
Margins (%)
Depreciation
Interest
Other Income
PBT before EO expense
Extra-Ord expense
PBT
Tax
Rate (%)
Reported PAT
Adj PAT
YoY Change (%)
Margins (%)
1Q
37,219
2.8
34,085
3,135
8.4
929
861
295
1,640
-
1,640
474
28.9
1,166
1,166
-7.4
3.1
FY25E
2Q
3Q
41,361 48,257
7.6
16.4
37,877 44,239
3,485
4,019
8.4
8.3
914
956
998
1,071
264
185
1,836
2,177
-
-
1,836
2,177
513
604
27.9
27.7
1,323
1,574
1,323
1,574
17.1
9.3
3.2
3.3
4Q
62,042
20.5
56,810
5,232
8.4
949
877
235
3,641
330
3,311
894
27.0
2,416
2,657
51.8
4.3
1Q
50,397
35.4
46,114
4,284
8.5
936
840
234
2,742
-
2,742
734
26.8
2,008
2,008
72.1
4.0
FY26E
2QE
3QE
51,718 57,210
25.0
18.6
47,271 52,062
4,448
5,149
8.6
9.0
1,085
1,112
897
942
264
315
2,730
3,410
-
-
2,730
3,410
757
946
27.7
27.7
1,973
2,464
1,973
2,464
49.1
56.6
3.8
4.3
FY25
Buy
EPS CHANGE (%): FY26|FY27: -|-
We expect EBITDA margin of 8.6% (+20bp YoY/+10bp QoQ)
and gradual improvement through the remainder of FY26.
We will monitor the working capital cycle closely. The
payment status of water projects will also remain a focus
area.
(INR m)
FY26E
4QE
69,516 1,88,879 2,28,842
12.0
12.7
21.2
63,024 1,73,009 2,08,470
6,491 15,870 20,372
9.3
8.4
8.9
1,314
3,749
4,447
942
3,807
3,622
346
979
1,159
4,581
9,294 13,462
-
330
-
4,581
8,964 13,462
1,297
2,485
3,734
28.3
27.7
27.7
3,284
6,479
9,729
3,284
6,718
9,729
23.6
20.3
44.8
4.7
3.6
4.3
KEC International
CMP: INR854 | TP: INR950 (+11%)
We expect 15% YoY revenue growth, driven by a strong
opening order book of INR344b.
Key monitorables include the order pipeline in both T&D
and civil, execution ramp-up, and margin improvement.
Consolidated - Quarterly Snapshot
Y/E March - INR m
Net Sales
YoY Change (%)
Total Expenditure
EBITDA
Margins (%)
Depreciation
Interest
Other Income
PBT before EO expense
Extra-Ord expense
PBT
Tax
Rate (%)
Reported PAT
Adj PAT
YoY Change (%)
Margins (%)
1Q
45,119
6.3
42,415
2,704
6.0
465
1,550
431
1,120
1,120
245
21.8
876
876
106.9
1.9
FY25
2Q
3Q
51,133 53,494
13.7
6.8
47,931 49,749
3,202
3,745
6.3
7.0
453
453
1,681
1,702
66
9
1,135
1,598
1,135
281
24.7
854
854
53.1
1.7
1,598
303
18.9
1,296
1,296
33.7
2.4
4Q
68,721
11.5
63,333
5,388
7.8
465
1,703
202
3,422
3,422
740
21.6
2,682
2,682
76.7
3.9
1Q
50,229
11.3
46,728
3,501
7.0
459
1,511
54
1,585
1,585
339
21.4
1,246
1,246
42.3
2.5
FY26E
2QE
3QE
58,575 63,668
14.6
19.0
54,299 58,448
4,276
5,221
7.3
8.2
508
521
1,676
1,634
124
127
2,216
3,193
2,216
510
23.0
1,706
1,706
99.7
2.9
3,193
817
25.6
2,375
2,375
83.3
3.7
Neutral
EPS CHANGE (%): FY26|FY27: -|-
We expect EBITDA margin to expand 100bp YoY (bridging
toward 8-8.5% in FY26), supported by T&D inflows and
civil stabilization.
We will monitor the payment cycle, debt levels, and NWC
improvement.
FY25
(INR M)
FY26E
4QE
82,202 2,18,467 2,54,674
19.6
9.7
16.6
74,614 2,03,428 2,34,088
7,588 15,039 20,586
9.2
6.9
8.1
596
1,837
2,084
1,716
6,636
6,538
204
709
509
5,480
7,275 12,473
5,480
1,527
27.9
3,953
3,953
47.4
4.8
7,275
1,568
21.5
5,707
5,707
64.6
2.6
12,473
3,193
25.6
9,280
9,280
62.6
3.6
October 2025
73
 Motilal Oswal Financial Services
September 2025 Results Preview | Sector: Capital Goods
Kirloskar Oil Engines
CMP: INR926 | TP: INR1,230 (+33%)
We expect revenue growth of 20% YoY, driven by healthy
growth across segments.
Key monitorables include outlook on genset demand,
pricing environment, and export ramp-up.
Standalone - Quarterly Snapshot
Y/E March
Net Sales
YoY Change (%)
Total Expenditure
EBITDA
Margins (%)
Depreciation
Interest
Other Income
PBT before EO expense
Extra-Ord expense
PBT
Tax
Rate (%)
Reported PAT
Adj PAT
YoY Change (%)
Margins (%)
1Q
13,429
6.2
11,452
1,977
14.7
247
27
108
1,810
1,810
462
25.5
1,347
1,347
30.5
10.0
FY25
2Q
3Q
11,944 11,636
12.8
2.5
10,294 10,466
1,650
1,170
13.8
10.1
266
320
26
31
118
68
1,476
887
1,476
365
24.7
1,111
1,111
89.6
9.3
887
236
26.7
650
650
(20.9)
5.6
4Q
14,125
1.5
12,384
1,741
12.3
337
37
52
1,419
(209)
1,628
416
25.6
1,211
1,056
(10.2)
7.5
1Q
14,447
7.6
12,545
1,902
13.2
340
32
123
1,653
-
1,653
425
25.7
1,228
1,228
(8.8)
8.5
FY26E
2QE
3QE
14,389 13,943
20.5
19.8
12,518 12,102
1,871
1,840
13.0
13.2
335
343
22
22
96
98
1,610
1,573
-
-
1,610
1,573
410
401
25.5
25.5
1,199
1,172
1,199
1,172
8.0
80.2
8.3
8.4
FY25
4QE
15,639
10.7
13,658
1,981
12.7
355
13
76
1,689
-
1,689
429
25.4
1,260
1,260
19.4
8.1
51,133
5.4
44,596
6,537
12.8
1,170
121
344
5,590
(209)
5,799
1,480
25.5
4,319
4,164
15.1
8.1
Buy
EPS CHANGE (%): FY26|FY27: -|-
We expect EBITDA margin to contract 80bp YoY on a high
base of last year due to provision reversal.
Ramp-up of the US and Middle East businesses, B2C
business, scale-up of distribution business, and Arka
Fincap performance will be closely observed.
(INR m)
FY26E
58,417
14.2
50,823
7,594
13.0
1,373
90
393
6,525
-
6,525
1,665
25.5
4,859
4,859
16.7
8.3
Larsen & Toubro
CMP: INR3,670 | TP: INR4,300 (+17%)
We expect consolidated revenue growth of 16% YoY, led
by 19% YoY revenue growth for Core E&C.
Key monitorables include a ramp-up in domestic ordering,
conversion of prospect pipeline in international markets,
margin performance, and working capital cycle.
Consolidated - Quarterly Earning Model
Y/E March - INR b
Net Sales
YoY Change (%)
Total Expenditure
EBITDA
Margins (%)
Depreciation
Interest
Other Income
PBT before EO expense
Extra-Ord expense
PBT
Tax
Rate (%)
MI & P/L of Asso. Cos.
Reported PAT
Adj PAT
YoY Change (%)
Margins (%)
1Q
551
15.1
495
56
10.2
10
9
9
47
-
47
12
26.4
7
28
28
11.7
5.1
FY25
2Q
3Q
616
647
20.6
17.3
552
584
64
63
10.3
9.7
10
10
9
8
11
10
56
53
-
-
56
53
14
13
26.0
25.0
7
6
34
34
34
34
5.4
14.0
5.5
5.2
4Q
744
10.9
662
82
11.0
11
7
11
75
-5
80
19
23.5
6
55
51
18.8
6.9
1Q
637
15.5
574
63
9.9
10
8
14
59
-
59
15
26.2
7
36
36
29.8
5.7
FY26E
2QE
715
16.2
645
70
9.8
11
9
11
62
-
62
16
26.2
7
39
39
14.3
5.4
FY25
3QE
743
14.8
664
79
10.6
11
9
11
70
-
70
18
26.2
7
44
44
31.9
6.0
4QE
873
17.4
774
99
11.3
11
9
11
90
-
90
24
26.0
7
60
60
17.0
6.9
2,557
15.7
2,293
264
10.3
41
33
41
231
-5
236
59
25.0
27
150
147
13.0
5.7
Buy
EPS CHANGE (%): FY26|FY27: -|-
We expect EBITDA margin to be flat YoY at 7.6% for Core
E&C, but down 50bp YoY at consolidated level.
The company received two ultra-mega orders in the
quarter for its energy and hydrocarbon businesses.
We will also look out for execution ramp-up in Saudi
projects, and trends in the GCC order pipeline.
FY26E
2,968
16.1
2,657
311
10.5
42
34
47
281
-
281
73
26.1
28
179
179
22.2
6.0
October 2025
74
 Motilal Oswal Financial Services
September 2025 Results Preview | Sector: Capital Goods
Siemens
CMP: INR3,123 | TP: INR3,300 (+6%)
We expect revenue to grow 8% YoY, led by improved
traction in the smart infra and digital segments.
Key monitorables include the demand trajectory of the
digital industries segment, private capex pipeline, margin
trajectory, and execution of the locomotive order.
Consolidated
Quarterly Snapshot
Income Statement
Y/E March
Net Sales
Change (%)
Expenses
EBITDA
As of % Sales
Depreciation
Interest
Other Income
PBT pre EO items
Extra-ordinary Items
PBT
Tax
Effective Tax Rate (%)
Reported PAT
Adj PAT
Margin (%)
Change (%)
Neutral
EPS CHANGE (%): 18M26E|12M2027E: -1|-
We expect EBITDA margin to expand ~120bp, on account
of improvement in mobility, digital and low-voltage
motors segment.
Demand outlook from both the government and private
sectors and export outlook are to be keenly monitored.
(INR m)
12M24 18M26E
12FY24 (Y/E Sep)
18FY26E (Y/E Mar)
1Q
2Q
3Q
4Q
1Q
2Q
3Q
4QE
5QE
6QE
37,095 41,524 37,626 44,572 35,872 42,590 43,468 47,966 44,364 48,414 1,60,817 2,62,674
-3.3
2.6
15.5
7.6
23.7
13.7
63.3
32,565 35,155 32,773 39,122 31,863 37,915 38,254 41,553 38,904 42,001 1,39,615 2,30,489
4,530 6,369 4,853 5,450 4,009 4,675 5,214 6,413 5,460 6,413 21,202 32,185
12.2
15.3
12.9
12.2
11.2
11.0
12.0
13.4
12.3
13.2
13.2
12.3
605
629
697
625
689
686
711
744
698
716
2,556
4,244
28
212
46
154
34
23
49
34
33
34
440
207
1,618 3,253 1,569 2,331 1,723 1,515 1,241 1,192 1,310 1,342
8,771
8,322
5,515 8,781 5,679 7,002 5,009 5,481 5,695 6,827 6,038 7,005 26,977 36,055
0
0
0
0
0
0
0
0
0
0
0
0
5,515 8,781 5,679 7,002 5,009 5,481 5,695 6,827 6,038 7,005 26,977 36,055
1,399 2,289 1,309 1,776 1,288 1,402 1,461 1,648 1,522 1,765
6,773
9,086
25.4
26.1
23.0
25.4
25.7
25.6
25.7
24.1
25.2
25.2
25.1
25.2
4,116 6,492 4,370 5,226 3,721 4,079 4,234 5,179 4,517 5,240 20,204 26,969
4,116 6,492 4,370 5,226 3,721 4,079 4,234 5,179 4,517 5,240 20,204 26,969
11.1
15.6
11.6
11.7
10.4
9.6
9.7
10.8
10.2
10.8
12.6
10.3
NA
NA
NA
NA
-9.6
-37.2
-3.1
-0.9
21.4
28.5
33.5
Siemens Energy
CMP: INR3,400 | TP: INR3,800 (+12%)
We expect revenue to decline 2% YoY on a high base.
Key monitorables include the status of capacity expansion,
HVDC orders and margin trajectory.
T&D sector ordering and execution ramp-up on
commissioning of additional capacities will be in focus.
Consolidated - Quarterly Snapshot
Income Statement
Y/E September
Net Sales
Change (%)
Expenses
EBITDA
As of % Sales
Depreciation
Interest
Other Income
PBT pre EO items
Extra-ordinary Items
PBT
Tax
Effective Tax Rate (%)
Reported PAT
Adj PAT
Margin (%)
Change (%)
FY24
2Q(2M)
11,966
9,271
2,695
22.5
103
150
2
2,444
0
2,444
639
26.1
1,805
1,805
15.1
NA
3Q
14,842
12,708
2,134
14.4
160
13
0
1,961
0
1,961
503
25.7
1,458
1,458
9.8
NA
4Q
20,788
16,939
3,849
18.5
191
21
20
3,657
0
3,657
920
25.2
2,737
2,737
13.2
NA
1Q
15,169
NA
11,816
3,353
22.1
207
44
16
3,118
0
3,118
801
25.7
2,317
2,317
15.3
NA
FY25E
2Q
3Q
18,795
17,846
NA
20.2
15,210
14,443
3,585
3,403
19.1
19.1
243
266
33
142
144
525
3,453
3,520
0
0
3,453
3,520
992
893
28.7
25.4
2,461
2,627
2,461
2,627
13.1
14.7
NA
80.2
4QE
20,412
-1.8
16,122
4,290
21.0
223
141
1,399
5,325
0
5,325
1,199
22.5
4,126
4,126
20.2
50.8
Buy
EPS CHANGE (%): FY25E|FY26E: +3|+4
We expect EBITDA margin to expand ~250bp YoY, with
sequential improvement expected in power transmission
and generation on better pricing.
TP was increased to INR3,800 to factor in better
execution.
(INR m)
FY25E
72,222
17.3
57,591
14,631
20.3
939
360
2,084
15,416
0
15,416
3,885
25.2
11,531
11,531
16.0
65.3
October 2025
75
 Motilal Oswal Financial Services
September 2025 Results Preview | Sector: Capital Goods
Thermax
CMP: INR3,167 | TP: INR3,450 (+9%)
We expect revenue to grow 11% YoY, driven by growth
across all segments.
Key monitorables include the finalization of the inquiry
pipeline, revival of base ordering, margin outlook, and
performance of the industrial infra and chemicals
segments.
Consolidated - Quarterly Snapshot
Y/E March
Net Sales
YoY Change (%)
Total Expenditure
EBITDA
Margins (%)
Depreciation
Interest
Other Income
PBT before EO expense
Extra-Ord expense
PBT
Tax
Rate (%)
Reported PAT
Adj PAT
YoY Change (%)
Margins (%)
1Q
21,844
13.0
20,433
1,412
6.5
360
275
841
1,617
1,617
519
32.1
1,094
1,094
17.4
5.0
FY25
2Q
3Q
26,116 25,078
13.4
7.9
23,336 23,188
2,780
1,890
10.6
7.5
421
351
294
287
598
315
2,663
1,568
2,663
683
25.6
1,980
1,980
24.9
7.6
1,568
425
27.1
1,137
1,137
-19.0
4.5
4Q
1Q
30,849 21,502
11.6
-1.6
27,853 19,251
2,997 2,251
9.7
10.5
453
489
313
302
769
656
3,000 2,117
3,000
951
31.7
2,056
2,056
5.3
6.7
2,117
600
28.4
1,515
1,515
38.4
7.0
FY26E
2QE
3QE
28,863 27,830
10.5
11.0
26,100 25,159
2,763
2,671
9.6
9.6
491
467
340
358
538
566
2,470
2,413
2,470
692
28.0
1,779
1,779
-10.2
6.2
2,413
676
28.0
1,737
1,737
52.7
6.2
FY25
Sell
EPS CHANGE (%): FY26|FY27: -|-
We expect EBITDA margin to contract 100bp YoY, while
sequentially it is expected to contract 90bp as 1QFY26 was
aided by government incentives.
The performance of key subsidiaries (FEPL, TOESL) needs
to be monitored closely.
(INR m)
FY26E
4QE
36,990 1,03,887 1,15,184
19.9
11.4
10.9
32,947 94,809 1,03,457
4,043
9,078 11,728
10.9
8.7
10.2
467
1,585
1,913
395
1,168
1,395
446
2,522
2,207
3,627
8,847 10,627
0
3,627
8,847 10,627
1,008
2,578
2,976
27.8
29.1
28.0
2,621
6,268
7,651
2,621
6,268
7,651
27.5
6.7
20.5
7.1
6.0
6.6
Triveni Turbine
CMP: INR524 | TP: INR620 (+18%)
Revenue is likely to grow on improved execution (vs. weak
trends in 1QFY26), while delayed decision-making on
international geographies may reflect in low order inflows.
Domestic segment inflows are expected to grow QoQ.
Key monitorables include a ramp-up in domestic and
international inflows, conversion of inquiry pipeline and
recovery of execution in 2H.
Consolidated - Quarterly Snapshot Mode
Y/E March
Net Sales
YoY Change (%)
Total Expenditure
EBITDA
Margins (%)
Depreciation
Interest
Other Income
PBT before EO expense
PBT
Tax
Rate (%)
MI & P/L of Asso. Cos.
Reported PAT
Adj PAT
YoY Change (%)
Margins (%)
1Q
4,633
23.1
3,677
956
20.6
62
10
194
1,078
1,078
274
25.4
0
804
804
31.8
17.4
FY25
2Q
5,011
29.2
3,897
1,114
22.2
61
8
196
1,241
1,241
331
26.7
0
910
910
41.4
18.2
3Q
5,034
16.6
3,941
1,093
21.7
65
4
221
1,245
1,245
320
25.7
1
926
926
35.0
18.4
4Q
5,380
17.5
4,176
1,204
22.4
75
7
199
1,321
1,321
375
28.4
0
946
946
25.9
17.6
1Q
3,713
-19.9
2,977
736
19.8
77
8
222
873
873
228
26.1
-1
644
644
-19.9
17.3
FY26E
2QE
4,972
-0.8
3,953
1,019
20.5
74
8
219
1,157
1,157
308
26.6
0
849
849
-6.7
17.1
FY25
3QE
5,709
13.4
4,442
1,267
22.2
76
8
230
1,414
1,414
376
26.6
0
1,038
1,038
12.1
18.2
4QE
6,750
25.5
5,237
1,513
22.4
77
8
230
1,657
1,657
445
26.9
1
1,213
1,213
28.2
18.0
20,058
21.3
15,691
4,367
21.8
263
29
810
4,885
4,885
1,300
26.6
1
3,586
3,586
33.3
17.9
Buy
EPS CHANGE (%): FY26|FY27: -|-
We expect margins to decline YoY by 170bp, driven by
revenue mix.
Domestic ordering from the government and private
sectors, updates on API turbines, and export order
recovery will be the key areas to monitor.
(INR m)
FY26E
21,144
5.4
16,609
4,535
21.5
305
32
902
5,101
5,101
1,357
26.6
0
3,744
3,744
4.4
17.7
October 2025
76
 Motilal Oswal Financial Services
September 2025 Results Preview | Sector: Capital Goods
Zen Technologies
CMP: INR1,464 | TP: INR1,550 (+6%)
We expect revenue to decline 43% YoY as decision delays
on overall ordering weigh on execution performance.
Key monitorables include order inflows for both training
simulators and anti-drones in domestic and export
markets, execution of equipment orders, and working
capital cycle.
Standalone - Quarterly Earning Model
Y/E March
Net Sales
YoY Change (%)
Total Expenditure
EBITDA
Margins (%)
Depreciation
Interest
Other Income
PBT
Tax
Rate (%)
Reported PAT
Adj PAT
YoY Change (%)
Margins (%)
1Q
2,540
91.7
1,508
1,032
40.6
22
10
30
1,030
288
28.0
742
742
57.4
29.2
FY25
2Q
2,417
277.4
1,623
794
32.9
23
21
84
835
182
21.8
652
652
276.1
27.0
3Q
1,415
44.3
1,048
367
26.0
26
27
220
534
147
27.6
386
386
21.9
27.3
4Q
2,935
116.3
1,991
944
32.2
29
36
244
1,122
273
24.3
849
849
177.3
28.9
1Q
1,111
(56.3)
730
380
34.3
31
14
199
535
164
30.6
371
371
(50.0)
33.4
FY26E
2QE
3QE
1,379
1,866
(42.9)
31.8
896
1,166
483
700
35.0
37.5
32
32
25
26
135
185
561
826
163
212
29.0
25.6
398
615
398
615
(38.9)
59.2
28.9
33.0
Neutral
EPS CHANGE (%): FY26|FY27: -3|-3
We expect EBITDA margin to expand 210bp YoY/70bp
QoQ, in line with broader guidance of the company.
Emergency procurement, progress of acquired companies
and updates on utilization of QIP proceeds will be in focus.
TP was decreased to INR1,550 to factor in lower other
income in our estimates.
FY25
4QE
3,756
28.0
2,318
1,439
38.3
35
39
221
1,586
360
22.7
1,226
1,226
44.3
32.6
9,307
116.3
6,169
3,137
33.7
101
94
578
3,520
890
25.3
2,630
2,630
107.3
28.3
(INR m)
FY26E
8,112
(12.8)
5,110
3,001
37.0
130
104
740
3,508
898
25.6
2,610
2,610
(0.7)
32.2
October 2025
77
 Motilal Oswal Financial Services
September 2025 Results Preview | Sector: Cement
Cement
Company
ACC
Ambuja Cements
Birla Corporation
Dalmia Bharat
Grasim Industries
India Cements
JSW Cement
JK Cement
JK Lakshmi Cement
The Ramco Cements
Shree Cement
UltraTech Cement
Near-term weakness persists; the long-term outlook positive
Demand subdued amid seasonality impact; pricing largely stable
We estimate our cement coverage universe (ex-JSWC, as the 2QFY25 numbers
are not available) to post 17%/52%/60% YoY growth in revenue/EBITDA/PAT,
albeit on a low base. Aggregate cement volume is estimated to grow ~11% YoY
to 92mt, aided by inorganic growth. However, on a like-for-like basis, volume
growth stood at ~5% YoY in 2QFY26. Blended realization is estimated to improve
~5% YoY (down ~2% QoQ) to INR5,446/t, led by pricing gains in Apr-May’25,
which partially declined in Jun-Jul’25.
We estimate EBITDA/t to rise ~40% YoY
(down ~20% QoQ) to INR867. Average EBITDA margin (ex-GRASIM) is estimated
to expand 4.0pp YoY (contract 3.6pp QoQ) to ~16%.
Cement price, after witnessing a marginal correction in Jun-Jul’25, largely
remains stable in Aug-Sep’25,
despite
the intense monsoon in the country.
While post-GST rate cut (from 28% to 18%) implementation (effective from 22
nd
Sep’25), cement players have passed on the full benefits to customers.
Consequently, all-India average cement prices (WSP) declined by INR27 per 50-
kg bag at exit-Sep’25.
Now, cement dealers anticipate no material changes in
pricing in the near term. Secondly, cement volume was subdued during the
quarter due to heavy rains across major parts of the country from mid-Aug’25
and planned maintenance shutdown of plants. However, we estimate a mid-
single-digit
volume growth YoY, led by strong volume in Jul’25 and
a volume
push by exit-Sep’25
to achieve targets. On
expanded capacity, average grinding
capacity utilization is estimated at ~70% vs. ~71%/78% in 2QFY25/1QFY26.
GRASIM’s revenue is estimated to increase
by ~21% YoY. VSF volume is
estimated to decline ~2% YoY, while realization is likely to increase ~4%.
Chemical volume is likely to increase ~6% YoY, while realization is likely to
decline ~5%. Revenue from high-growth businesses (Opus and Birla Pivot) is
likely to increase marginally by ~1% QoQ to INR24.7b. Overall EBITDA is
estimated to dip ~2% YoY to INR3.2b, and OPM is likely to contract 80bp YoY to
3.5%. It is estimated to report a PAT of INR7.8b vs. INR7.6b in 2QFY25.
Stable opex/t YoY, average OPM is estimated to improve 4pp YoY to ~16%
Cement volume growth for our coverage companies is estimated at ~11% YoY in
2QFY26, aided by inorganic growth. However, volume growth on a like-for-like
basis stood at ~5% YoY. We estimate volume growth of ~17% YoY for UTCEM
(including ICEM and Kesoram cement volume). However, on a like-for-like basis,
UTCEM’s volume growth is estimated at ~4%
YoY.
ACEM’s volume is estimated
to grow ~15% YoY (including Penna Cement and Orient Cement volumes). While
on a like-for-like basis, its volume is likely to grow ~2% YoY. Volume growth is
estimated at ~14% YoY for JKCE (on a low base), followed by ~10% for ACC/JKLC
(each), and in the range of ~2-6% for DALBHARA/SRCM/BCORP. Volume is likely
to be flat YoY for ICEM, while it is estimated to decline ~4% YoY for TRCL.
Average opex/t for our coverage universe is estimated to remain flat YoY (up
~2% QoQ), as the impact of higher other expenses/t was offset by lower variable
cost/t. The average imported petcoke (US) price was up ~6%/3% YoY/QoQ in
Sanjeev Kumar Singh - Research analyst
(Sanjeev.Singh@MotilalOswal.com)
Mudit Agarwal - Research analyst
(Mudit.Agarwal@MotilalOswal.com)
January 2023
78
 Motilal Oswal Financial Services
September 2025 Results Preview | Sector: Cement
2QFY26, while the average imported coal (South Africa) price was up ~1% YoY
(down ~18% QoQ). The impact of fuel prices comes with a lag; hence, benign
fuel prices in 1HCY25 are likely to benefit, with a lower variable cost in 2QFY26.
Further, we estimate average freight cost/t to remain flat YoY (down ~1% QoQ).
We estimate an EBITDA/t of INR1,198 for SRCM (the highest within our coverage
universe), followed by INR980 for DALBHARA, INR951 for UTCEM, and INR934
for JKCE. EBITDA/t is estimated to be ~INR550-850 for the remaining players
(ACC/ACEM/BCORP/JKLC/TRCL), except for ICEM, which stands at INR283/t.
We estimate JKLC to report EBITDA growth of ~125% YoY, albeit on a low base,
followed by SRCM/JKCE/DALBHARA/UTCEM at ~63%/62%/54%/52%. ACEM and
ACC are expected to report an EBITDA growth of ~41% and 40% YoY,
respectively. BCORP to post ~31% YoY and TRCL to record ~11% YoY EBITDA
growth. ICEM is estimated to report an EBITDA of INR655m compared to the
operating loss of INR1.6b in 2QFY25.
Sector outlook and recommendations
The cement sector witnessed subdued demand growth in 2QFY26 amid the
seasonality impact. However, the GST rate cut on cement is sentimentally
positive and is likely to boost cement demand and industry capacity utilization in
the long term. Also, cost volatility appears to be behind us as fuel prices remain
benign and industry players continue to optimize logistics, increase green power
and AFR usage, and invest in efficiency improvement, aiding margins.
Given the capacity addition by large players, we estimate the
industry’s capacity
to
grow ~9% YoY (adding 55-60mtpa) in FY26, while demand growth is likely to be ~6-
7% YoY during the year. However, we estimate the
industry’s capacity CAGR
at ~5%
over FY26-28 to be lower than the demand CAGR of ~7% during the same period.
Given lower demand growth during the quarter and adverse operating leverage,
we cut our EBITDA estimates (aggregate) for our cement coverage companies by
~5%/3% for FY26/FY27. We prefer UTCEM in the large-cap space, while JKCE and
DALBHARA are our preferred picks in the mid-cap space.
Exhibit 1:
Summary of our 2QFY26 estimates
CMP
Companies
(INR)
ACC
1,829
Ambuja Cements
571
Birla Corporation
1,212
Dalmia Bharat
2,232
Grasim Industries
2,792
India Cements
391
J K Cements
6,306
JK Lakshmi Cem.
869
Shree Cement
29,262
The Ramco Cements 992
Ultratech Cement
12,119
Cement
Rating
Neutral
Buy
Buy
Buy
Buy
Sell
Buy
Buy
Neutral
Neutral
Buy
Sales (INR m)
Sep-25
YoY (%) QoQ (%)
53,915
17.0
(11.1)
88,601
20.1
(13.9)
21,354
9.4
(13.0)
34,678
12.3
(4.6)
92,210
21.0
(0.0)
10,670
5.0
4.1
29,402
14.8
(12.3)
14,057
13.9
(19.3)
42,395
13.8
(14.3)
21,174
3.9
2.3
1,84,766
18.2
(13.2)
5,93,223
16.6
(10.2)
EBITDA (INR m)
Sep-25
YoY (%) QoQ (%)
5,989
39.5
(22.5)
13,710
40.8
(30.1)
2,330
31.5
(32.8)
6,700
54.4
(24.1)
3,200
(1.6)
(16.8)
655
N/A
N/A
4,596
61.8
(33.2)
2,007
124.8
(35.5)
9,648
62.8
(21.5)
3,464
11.0
(12.9)
30,629
51.8
(30.6)
82,927
51.6
(27.7)
PAT (INR m)
Sep-25
YoY (%) QoQ (%)
3,122
33.5
(18.8)
4,137
(9.5)
(43.6)
379
(250.3)
(68.3)
2,125
286.3
(43.0)
7,770
N/A
N/A
(257)
N/A
N/A
1,646
358.2
(49.2)
661
(572.3)
(56.0)
2,155
131.4
(65.2)
479
87.2
(44.3)
12,812
56.2
(43.2)
35,028
59.7
(28.7)
October 2025
79
 Motilal Oswal Financial Services
September 2025 Results Preview | Sector: Cement
Exhibit 2:
Comparative
valuations
Company
Name
Cement
ACC
Ambuja Cements
Birla Corporation
Dalmia Bharat
Grasim Industries
India Cements
J K Cements
JK Lakshmi Cem.
JSW Cement
Ramco Cements
Shree Cement
Ultratech Cement
Chemicals
CMP
(INR)
1,829
571
1,212
2,232
2,792
391
6,306
869
139
992
29,262
12,119
Reco
Neutral
Buy
Buy
Buy
Buy
Sell
Buy
Buy
Neutral
Neutral
Neutral
Buy
EPS (INR)
PE (x)
PB (x)
ROE (%)
FY26E FY27E FY28E FY26E FY27E FY28E FY26E FY27E FY28E FY26E FY27E
42.3 32.7 27.1
3.4
3.2
3.0
8.1
9.8
89.9 117.2 135.6 20.3 15.6 13.5
1.7
1.6
1.4
8.9
10.6
10.2 14.5 17.4 56.1 39.4 32.7
2.5
2.4
2.3
4.6
6.3
67.9 84.8 95.9 17.9 14.3 12.6
1.3
1.2
1.1
7.2
8.4
70.4 68.6 83.0 31.7 32.5 26.9
2.3
2.1
2.0
7.4
6.8
85.1 105.5 127.4 32.8 26.5 21.9
3.3
3.2
3.1
-4.1
-1.1
-1.4
3.8
11.4 -275.4 103.7 34.4
1.3
1.2
1.2
-0.5
1.2
155.8 193.5 219.5 40.5 32.6 28.7
6.8
5.8
4.9
18.2 19.2
43.2 52.4 53.4 20.1 16.6 16.3
2.6
2.3
2.0
13.8 14.8
2.3
2.9
3.6
60.1 47.3 38.9
3.1
2.8
2.6
7.4
6.2
15.8 24.7 34.3 63.0 40.2 28.9
3.0
2.8
2.6
4.9
7.3
448.7 551.1 683.9 65.2 53.1 42.8
4.7
4.4
4.1
7.4
8.6
264.2 354.0 427.8 45.9 34.2 28.3
4.7
4.3
3.9
10.6 13.2
36.7 28.7 25.4
3.9
3.5
3.1
10.5 12.1
FY28E
11.0
11.1
7.1
8.8
7.7
1.5
3.6
18.5
13.3
7.0
9.4
9.9
14.5
12.3
Exhibit 3:
Relative performance
three months (%)
Nifty Index
104
101
98
MOFSL Cement Index
Exhibit 4:
Relative performance
one year (%)
108
100
92
84
Nifty Index
MOFSL Cement Index
95
Source: Bloomberg, MOFSL
Exhibit 5:
Estimate ~11% YoY growth in aggregate sales volume for our coverage universe, aided by inorganic growth
Aggregate Vol (mt)
16
8
14
2
9
9
10
16
YoY change (%)
13
7
13
3
10
11
8
11
6
66
71
82
77
71
78
90
90
81
84
102
95
83
92
112
103
92
Source: MOFSL, Company, E: MOFSL estimate
Exhibit 6:
Pan-India average cement price (WSP) declined in exit-Sep’25
due to
the GST rate cut pass-through
2QFY25
1QFY26
2QFY26
North
Central
East
West
South
Average
Source: MOFSL, Industry; Note
GST rate cut was effective from 22
nd
Sep’25, the rate cut is not likely to impact cement companies top-line
as revenue shown is net of GST
October 2025
80
 Motilal Oswal Financial Services
September 2025 Results Preview | Sector: Cement
Exhibit 7:
Expect realization to improve ~5% YoY
Realization (INR/t)
Exhibit 8:
Expect EBITDA/t to increase 40% YoY
Average EBITDA (INR/t)
Source: MOFSL; E: MOFSL estimate
Source: Company, MOFSL; E: MOFSL estimate
Exhibit 9:
Average South African coal price declined ~18%
YoY but increased ~1% QoQ in 2QFY26
South African coal
Exhibit 10:
Average US petcoke price increased ~3% YoY and
6% QoQ in 2QFY26
USA Petcoke
Source: Bloomberg, MOFSL
Source: Company, Industry
Exhibit 11:
Key operating parameters
Companies
ACC
Ambuja Cements (Consol.)
Birla Corporation
Dalmia Bharat
India Cements
JK Cement
JK Lakshmi Cement
The Ramco Cements
Shree Cement
UltraTech Cement
Sector aggregate/avg.
Volume (mt)
2QFY26E
YoY (%)
QoQ (%)
10.2
10.0
(10.7)
16.2
13.7
(12.0)
4.2
5.0
(12.8)
6.8
2.0
(2.4)
2.3
0.4
6.0
4.9
13.5
(12.3)
2.7
10.1
(18.0)
4.3
(3.7)
5.0
8.1
6.0
(10.0)
32.4
16.5
(11.9)
92.2
10.8
(10.2)
Realization (INR/t)
2QFY26E YoY (INR) QoQ (INR)
5,270
315
(27)
5,472
291
(120)
5,123
204
(12)
5,074
467
(120)
4,618
201
(83)
5,974
68
(2)
5,154
171
(80)
4,897
358
(130)
5,263
359
(265)
5,696
80
(81)
5,434
240
(105)
EBITDA (INR/t)
2QFY26E YoY (INR) QoQ (INR)
585
124
(90)
847
163
(219)
559
113
(166)
980
333
(281)
283
995
(93)
934
279
(292)
736
375
(200)
801
106
(165)
1,198
418
(175)
951
226
(247)
865
247
(215)
Exhibit 12:
Valuation summary
Company Name
Cement
UltraTech Cement
Ambuja Cements (Consol.)
Shree Cement
JK Cement
Dalmia Bharat
ACC
The Ramco Cements
JSW Cement
India Cements
JK Lakshmi
Birla Corporation
M-cap
(USD b)
39.4
15.8
11.9
5.5
4.7
3.9
2.6
2.2
1.4
1.2
1.1
CMP
INR
12,119
571
29,262
6,306
2,232
1,829
992
139
391
869
1,212
Rating
Buy
Buy
Neutral
Buy
Buy
Neutral
Neutral
Neutral
Sell
Buy
Buy
EV/EBITDA (X)
FY26E FY27E FY28E
22.5
21.4
20.0
19.5
12.6
9.8
16.2
15.9
38.2
10.2
7.8
18.0
16.6
17.2
16.4
11.5
7.4
13.5
14.3
24.4
9.2
6.3
15.5
14.0
14.6
14.9
10.2
6.1
11.3
12.1
15.9
8.4
6.4
EV/t (USD)
FY26E FY27E FY28E
202
150
160
177
96
76
118
105
97
78
59
187
143
149
179
89
73
102
94
101
75
56
182
139
138
150
81
68
100
82
104
69
58
Net debt/EBITDA (x)
FY26E FY27E FY28E
1.0
0.1
(1.1)
1.7
0.7
(0.9)
2.5
3.6
4.0
1.9
1.8
0.6
(0.0)
(1.2)
1.6
0.9
(1.1)
2.1
3.4
2.5
2.2
2.0
0.2
(0.2)
(1.3)
1.4
0.9
(1.3)
1.6
3.0
1.4
2.1
2.1
October 2025
81
 Motilal Oswal Financial Services
September 2025 Results Preview | Sector: Cement
The tables below provide a snapshot of actual and estimated numbers for companies under the MOFSL coverage
universe. Highlighted columns indicate the quarter/financial year under review.
ACC
CMP: INR1,829 | TP: INR2,000 (+9%)
Sales volume is expected to grow ~10% YoY, whereas
blended realization is expected to increase ~5% YoY.
EBITDA/t is expected at INR585 vs. INR462/INR675 in
2QFY25/1QFY26.
Standalone quarterly performance
Y/E March
Net Sales
Change (YoY %)
EBITDA
Margin (%)
Change (YoY %)
Depreciation
Interest
Other Income
PBT before EO Item
EO Income/(Expense)
PBT after EO Item
Tax
Rate (%)
Reported PAT
Adjusted PAT
Margins (%)
Change (YoY %)
1Q
52.0
(0.0)
6.8
13.0
(11.9)
2.2
0.3
0.7
4.9
0.0
4.9
1.3
25.6
3.7
3.7
7.0
(21.1)
FY25
2Q
46.1
3.9
4.3
9.3
(21.7)
2.3
0.3
1.5
3.2
0.0
3.2
0.8
26.5
2.3
2.3
5.1
(39.1)
3Q
52.6
6.9
4.7
9.0
(47.7)
2.5
0.3
1.1
3.1
11.7
14.8
3.9
26.2
10.9
2.3
4.3
(57.3)
4Q
60.6
12.2
8.0
13.2
(4.4)
2.5
0.1
0.6
6.0
2.6
8.6
1.2
14.4
7.4
5.1
8.5
4.5
1Q
60.7
16.7
7.7
12.7
14.1
2.4
0.3
0.7
5.7
0.0
5.7
1.9
33.0
3.8
3.8
6.3
5.0
FY26E
2QE
53.9
17.0
6.0
11.1
39.5
2.5
0.3
0.8
4.1
0.0
4.1
0.9
23.0
3.1
3.1
5.8
33.5
Neutral
EPS CHANGE (%): FY26|27|28: -1.5|+0.9|-2.8
Variable cost/t is likely to increase ~4% YoY, and opex/t to
increase ~4%. OPM is likely to expand 1.8pp YoY to ~11%.
Adj. PAT is likely to jump 33% YoY to INR3.1b.
(INR b)
FY25
3QE
61.2
16.3
7.5
12.2
57.9
2.5
0.3
0.9
5.6
0.0
5.6
1.2
22.0
4.3
4.3
7.1
92.9
4QE
66.8
10.3
9.2
13.8
15.4
2.5
0.3
1.0
7.4
0.0
7.4
1.9
24.9
5.6
5.6
8.4
9.0
210.3
(5.3)
22.9
10.9
140.5
9.6
1.1
4.0
16.2
14.3
30.5
7.2
23.6
23.3
13.4
6.4
35.3
FY26E
242.6
15.3
30.4
12.5
33.0
9.8
1.2
3.4
22.8
0.0
22.8
5.9
25.9
16.9
16.9
7.0
26.3
Ambuja Cements
CMP: INR571 | TP: INR730 (+28%)
Consolidated volume is expected to increase ~14% YoY. On
a like-for-like basis, its volume is likely to grow ~2% YoY
Consolidated EBITDA/t is expected to be INR847 vs.
INR684/INR1,066 in 2QFY25/1QFY26.
Consolidated quarterly performance
Y/E December/March
Net Sales
Change (YoY %)
EBITDA
1Q
83.9
-3.7
12.8
-23.2
15.3
4.8
0.7
3.5
10.9
0.0
0.0
10.9
3.1
0.0
28.4
7.8
1.4
6.4
(29.3)
FY25
2Q
3Q
73.8
85.0
-0.6
4.6
9.7
8.9
-25.2
-48.9
13.2
10.4
5.5
6.6
0.7
0.7
3.7
2.4
7.3
4.0
0.0
0.0
-0.2
19.4
7.1
23.4
2.4
5.2
0.1
-8.1
34.5
-12.2
4.7
26.2
0.2
5.0
4.6
4.1
(42.4)
(49.7)
4Q
99.8
12.2
18.7
9.9
18.7
7.9
0.1
2.7
13.4
0.0
4.4
17.8
4.6
0.4
27.9
12.8
3.3
4.5
(16.1)
1Q
102.9
22.6
19.6
53.2
19.1
8.6
0.7
2.6
12.9
0.0
0.4
13.3
3.9
-0.3
27.2
9.7
1.8
7.3
14.7
FY26E
2QE
88.6
20.1
13.7
40.8
15.5
8.7
0.8
2.7
6.9
0.0
0.0
7.0
1.7
0.0
23.9
5.3
1.2
4.1
(9.5)
FY25
3QE
97.6
14.8
16.8
89.6
17.2
8.7
0.8
2.8
10.1
0.0
0.0
10.1
2.4
0.0
23.9
7.7
2.2
5.5
33.4
4QE
108.8
9.0
20.7
11.0
19.1
8.4
0.8
2.9
14.5
0.0
0.0
14.5
3.8
0.0
25.9
10.8
2.7
8.1
80.2
342.5
10.0
50.1
73.0
14.6
24.8
2.2
12.4
35.6
0.1
23.5
59.2
15.3
-7.6
25.9
51.5
9.9
19.6
(30.6)
Buy
EPS CHANGE (%): FY26|27|28: -5.3|-3.0|-2.8
We estimate variable cost/t to decline~2% YoY. Opex/t is
expected to increase ~3% YoY.
Depreciation is likely to increase ~57% YoY. Adjusted PAT
(after MI) is estimated to decline 9% YoY.
(INR b)
FY26E
397.9
16.2
70.8
41.5
17.8
34.4
3.0
10.9
44.4
0.1
0.4
44.9
11.7
-0.3
25.5
33.5
7.9
25.0
28.0
Change (YoY %)
Margin (%)
Depreciation
Interest
Other Income
PBT before JV profit/(loss)
Share of JV Profit
Extraordinary Inc./(Exp.)
PBT after EO Exp./(Inc.)
Tax
Prior Period Tax Adj. and Reversal
Rate (%)
Reported Profit
Minority Interest
Adj. Pat after MI
Change (YoY %)
October 2025
82
 Motilal Oswal Financial Services
September 2025 Results Preview | Sector: Cement
Birla Corporation
CMP: INR1,212 | TP: INR1,600 (+32%)
Volume is expected to grow ~5% YoY. Blended realization
is expected to increase ~3% YoY.
EBITDA/t is estimated at INR559 vs. INR446/INR725 in
2QFY25/1QFY26.
Consolidated quarterly performance
Y/E March
FY25
2Q
19.5
(14.6)
17.8
1.8
9.1
-38.7
1.5
0.9
0.2
-0.4
-
-0.4
-0.1
29.4
-0.3
-0.3
-1.3
N/A
3Q
22.6
(2.4)
20.1
2.5
11.0
-34.5
1.4
0.8
0.2
0.4
-
0.4
0.1
24.6
0.3
0.3
1.4
(71.4)
4Q
28.1
6.0
22.8
5.3
19.0
13.0
1.4
0.7
0.5
3.7
0.4
3.3
0.7
21.8
2.6
2.9
10.2
52.2
1Q
24.5
12.0
21.1
3.5
14.1
34.3
1.3
0.7
0.3
1.8
-
1.8
0.6
32.6
1.2
1.2
4.9
266.6
1Q
Net Sales
21.9
Change (YoY %)
(9.1)
Total Expenditure
19.3
EBITDA
2.6
Margin (%)
11.8
Change (YoY %)
-13.3
Depreciation
1.5
Interest
0.9
Other Income
0.2
Profit before Tax
0.4
EO (Income)/Expense
-
Profit before Tax after EO
0.4
Tax
0.1
Rate (%)
25.9
Reported PAT
0.3
Adj. PAT
0.3
Margins (%)
1.5
Change (YoY %)
(45.4)
FY26E
2QE
21.4
9.4
19.0
2.3
10.9
31.5
1.4
0.7
0.2
0.5
-
0.5
0.1
25.0
0.4
0.4
1.8
N/A
FY25
3QE
24.4
8.2
21.3
3.1
12.7
25.5
1.5
0.7
0.3
1.1
-
1.1
0.3
25.0
0.9
0.9
3.5
174.7
4QE
29.4
4.6
23.9
5.5
18.8
3.9
1.6
0.7
0.3
3.5
-
3.5
0.8
21.2
2.8
2.8
9.5
(2.4)
92.1
(4.6)
80.0
12.2
13.2
-15.3
5.7
3.3
1.0
4.2
0.4
3.8
0.8
21.9
3.0
3.3
3.5
(21.8)
Buy
EPS CHANGE (%): FY26|27|28: -7.7|-0.8|-3.3
Variable cost/t is estimated to inch up 1% YoY, and opex/t
is estimated to increase 2%/4% YoY/QoQ.
EBITDA is estimated to increase ~31% YoY to INR2.3b,
while Adj. PAT is estimated to be INR379m v/s net loss of
INR252m in 2QFY25
(INR b)
FY26E
99.7
8.2
85.3
14.5
14.5
18.7
5.7
2.8
1.1
7.0
-
7.0
1.7
25.0
5.2
5.2
5.2
60.7
Dalmia Bharat
CMP: INR2,232| TP: INR2,660 (+19%)
Sales volume is estimated to increase ~2% YoY. Realization
is expected to increase ~10% YoY (down 2% QoQ).
EBITDA/t is estimated at INR980 vs. INR648/ INR1,261 in
2QFY25/1QFY26.
Consolidated quarterly performance
Y/E March
Net Sales
Change (YoY %)
Total Expenditure
EBITDA
Margins (%)
Change (YoY %)
Depreciation
Interest
Other Income
PBT before EO
Expense
Extra-Ord. Expense
PBT after EO Expense
Tax
Prior Period Tax Adj.
Rate (%)
Reported PAT
Minority + Associate
PAT Adj. for EO Items
Change (YoY %)
1Q
36.2
-0.3
29.5
6.7
18.5
8.4
3.2
1.0
0.5
3.1
1.1
1.9
0.5
0.0
16.0
1.5
0.0
2.3
82.9
FY25
2Q
30.9
-2.0
26.5
4.3
14.1
-26.3
3.4
1.0
0.7
0.7
0.0
0.7
0.2
0.1
20.5
0.5
0.0
0.6
-53.8
3Q
31.8
-11.7
26.7
5.1
16.1
-34.4
3.6
1.0
0.4
0.8
0.0
0.8
0.2
0.0
22.9
0.7
0.1
0.6
-78.1
4Q
40.9
-5.0
33.0
7.9
19.4
21.3
3.1
1.1
0.9
4.7
0.0
4.7
0.3
-0.8
22.9
4.4
0.0
3.6
40.7
1Q
36.4
0.4
27.5
8.8
24.3
32.0
3.2
1.1
0.5
5.0
-0.2
5.2
1.2
0.0
24.5
4.0
0.0
3.7
65.8
FY26E
2QE
34.7
12.3
28.0
6.7
19.3
54.4
3.2
1.1
0.6
2.9
0.0
2.9
0.7
0.0
25.6
2.2
0.0
2.1
286.3
FY25
3QE
35.5
11.6
28.4
7.1
20.0
39.0
3.5
1.2
0.7
3.1
0.0
3.1
0.8
0.0
25.6
2.3
0.0
2.3
287.4
4QE
46.8
14.5
36.1
10.7
22.9
35.2
3.6
1.2
0.9
6.8
0.0
6.8
1.8
0.0
25.9
5.1
0.1
5.0
40.8
139.8
-4.8
115.7
24.1
17.2
-8.8
13.3
4.0
2.5
9.3
1.1
8.2
1.2
-0.7
5.6
7.0
0.2
7.0
-9.0
Buy
EPS CHANGE (%): FY26|27|28: -3.8|-1.4|-0.5
Variable cost/t is estimated to increase ~8% YoY. Opex/t is
estimated to increase ~3% YoY.
Adj. PAT is estimated to jump ~286% YoY (on a low base).
(INR b)
FY26E
153.4
9.7
120.0
33.4
21.7
38.6
13.6
4.5
2.7
17.9
-0.2
18.0
4.5
0.0
25.2
13.5
0.2
13.2
89.2
October 2025
83
 Motilal Oswal Financial Services
September 2025 Results Preview | Sector: Cement
Grasim Industries
CMP: INR2,792 | TP: INR3,540(+27%)
Revenue for VSF/Chemical segments is expected to
increase 3%/1% YoY.
EBITDA for the VSF segment is likely to decline ~27% YoY,
and OPM is expected to decline 3.5pp YoY to ~9%.
The Chemical
segment’s EBITDA is expected to
increase
6% YoY, and OPM is likely to improve 70bp YoY to ~14%.
Standalone quarterly performance
Y/E March)
Net Sales
Change (YoY %)
EBITDA
Change (YoY %)
Margin (%)
Depreciation
Interest
Other Income
PBT before EO Items
Extraordinary Inc./(Exp.)
PBT after EO Items
Tax
Rate (%)
Reported PAT
Prior period tax Adj.
Adj. PAT
Margins
Change (YoY %)
1Q
68.9
10.5
3.3
(51.7)
4.7
3.5
1.4
0.9
-0.7
-
-0.7
-0.2
25.8
-0.5
-
-0.5
-0.8
(114.7)
FY25
2Q
3Q
76.2
81.2
18.3
26.9
3.3
2.7
(45.2)
(48.2)
4.3
3.3
4.1
4.2
1.6
1.8
12.9
1.0
10.5
-2.3
(0.5)
-
10.0
-2.3
2.8
-0.6
28.0
26.8
7.2
-1.7
-
-
7.6
-1.7
9.9
-2.1
(4.7)
(171.4)
4Q
89.3
31.9
2.2
(58.1)
2.5
5.0
2.0
2.3
-2.5
(1.1)
-3.7
-0.8
21.8
-2.9
-
-2.1
-2.4
(191.6)
1Q
92.2
33.8
3.8
(50.7)
4.2
4.8
2.1
1.4
-1.6
-
-1.6
-0.4
24.4
-1.2
-
-1.2
-1.3
N/A
FY26E
2QE
92.2
21.0
3.2
18.3
3.5
4.9
2.1
14.0
10.2
-
10.2
2.5
24.0
7.8
-
7.8
8.4
2.6
FY25
3QE
93.8
15.5
4.2
(1.6)
4.5
4.9
2.1
1.2
-1.7
-
-1.7
-0.4
24.0
-1.3
-
-1.3
-1.3
N/A
4QE
97.1
8.7
4.8
56.0
4.9
5.2
2.1
2.5
0.0
-
0.0
0.0
22.3
0.0
-
0.0
0.0
N/A
315.6
22.1
11.4
(50.7)
3.6
16.8
6.8
17.2
5.0
(1.6)
3.3
1.2
36.2
2.1
-
3.3
1.0
(79.8)
Buy
EPS CHANGE (%): FY26|27|28: -10.5|-6.3|-6.0
Standalone revenue is estimated to increase ~21% YoY.
EBITDA is expected to decline ~2% YoY to INR3.2b. OPM is
estimated to contract 80bp YoY to 3.5%.
Interest and depreciation are estimated to rise ~20% and
29% YoY, respectively. Adj. PAT is estimated to grow ~3%
YoY to INR7.8b.
(INR b)
FY26E
375.3
18.9
16.0
18.3
4.3
19.7
8.3
19.1
7.0
-
7.0
1.7
23.9
5.4
-
5.4
1.4
64.0
India Cements
CMP: INR391 | TP: INR320 (-18%)
Volume is expected to be flat YoY, and blended realization
is estimated to increase ~5% YoY.
EBITDA/t is estimated at INR283 vs. the operating loss/t of
INR712 in 2QFY25.
Standalone quarterly performance
Y/E March
Net Sales
Change (YoY %)
EBITDA
Change (YoY %)
Margin (%)
Depreciation
Interest
Other Income
PBT before EO Expense
Extra-Ord. Expense
PBT
Tax
Rate (%)
Reported PAT
Tax
Adj. PAT
Change (YoY %)
Margin (%)
1Q
9.7
(30.3)
(0.3)
N/A
(3.2)
0.6
0.8
0.1
(1.6)
(2.4)
0.8
0.0
1.7
0.8
-
(1.6)
N/A
(16.4)
FY25
2Q
10.2
(16.8)
(1.6)
N/A
(16.1)
0.5
0.7
0.1
(2.8)
(0.1)
(2.7)
(0.3)
12.6
(2.4)
-
(2.5)
N/A
(24.2)
3Q
9.0
(16.5)
(1.9)
N/A
(20.9)
0.6
0.7
0.1
(3.1)
1.9
(5.0)
(0.7)
13.7
(4.3)
-
(2.6)
N/A
(29.3)
4Q
12.0
(3.9)
0.0
N/A
0.0
0.7
0.5
0.2
(1.0)
0.0
(1.0)
(0.3)
25.2
(0.8)
-
(0.7)
N/A
(6.2)
1Q
10.2
5.5
0.8
N/A
8.0
0.7
0.3
0.1
(0.2)
-
(0.2)
(0.0)
15.3
(0.1)
-
(0.1)
N/A
(1.3)
FY26E
2QE
10.7
5.0
0.7
N/A
6.1
0.8
0.3
0.1
(0.3)
-
(0.3)
(0.1)
18.0
(0.3)
-
(0.3)
N/A
(2.4)
FY25
3QE
10.0
10.8
0.4
N/A
3.9
0.8
0.3
0.1
(0.6)
-
(0.6)
(0.1)
18.0
(0.5)
-
(0.5)
N/A
(4.7)
4QE
13.6
13.7
1.5
N/A
10.8
0.8
0.4
0.2
0.5
-
0.5
0.1
17.1
0.4
-
0.4
N/A
3.1
40.9
(17.3)
(3.8)
N/A
(9.4)
2.4
2.8
0.5
(8.5)
(0.5)
(7.9)
(1.3)
16.0
(6.7)
-
(7.4)
N/A
(18.2)
Sell
EPS CHANGE (%): FY26|27|28: --|--|--
Variable cost/t is estimated to decline 14% YoY. Total
opex/t is likely to decline 15% YoY.
ICEM is estimated to report a net loss of INR257m vs. a net
loss of INR2.5b/INR138m in 2QFY25/1QFY26.
(INR b)
FY26E
44.5
8.9
3.3
N/A
7.5
3.0
1.3
0.5
(0.5)
-
(0.5)
(0.1)
18.0
(0.4)
-
(0.4)
N/A
(1.0)
October 2025
84
 Motilal Oswal Financial Services
September 2025 Results Preview | Sector: Cement
JSW Cement
CMP: INR139 | TP: INR150 (+8%)
Sales volume is expected to decline 12% QoQ. Realization
is estimated to decline ~2% QoQ.
EBITDA/t is estimated at INR657 vs. INR975 in 1QFY26.
Neutral
EPS CHANGE (%): FY26|27|28: - |- |-
We expect opex/t to increase ~6% QoQ. Variable cost/t is
expected to decline ~1% QoQ.
Depreciation and interest costs are expected to increase
3% and 5% QoQ, respectively. Adj. PAT is estimated to be
INR402m vs. a net loss of INR1.1b in 1QFY26.
FY26
2QE
13.5
11.5
1.9
14.2
0.8
1.1
0.3
0.3
-
0.3
0.1
-
22.0
0.3
-0.2
-0.1
0.4
FY25
3QE
15.1
12.4
2.7
17.6
0.8
1.3
0.3
0.8
-
0.8
0.2
-
22.0
0.7
0.2
-0.1
0.4
4QE
24.1
19.1
4.9
20.5
0.9
1.5
0.3
2.8
-
2.8
0.6
-
19.8
2.2
0.5
-0.2
1.7
58.1
49.5
8.6
14.8
3.1
5.9
1.0
0.5
-
0.5
1.2
-
0.0
-0.7
1.0
-0.5
-0.1
(INR b)
FY26E
68.2
55.5
12.7
18.7
3.3
4.9
1.1
5.6
14.7
-9.1
1.5
-
0.0
-10.5
1.0
-0.5
3.7
Quarterly performance
Y/E March
Net Sales
Total Expenditure
EBITDA
Margins (%)
Depreciation
Interest
Other Income
PBT before EO Expense
Extra-Ord loss/ (income)
PBT after EO Expense
Tax
Prior period tax adjustment
Rate (%)
Reported PAT (pre minority)
Share of loss/(profit) from JV
Minority
PAT Adj for EO items and post MI
1Q
14.5
12.1
2.3
16.1
0.7
1.4
0.2
0.4
-
0.4
0.3
-
80.4
0.1
0.3
-0.1
-0.2
FY25
4Q
17.1
14.6
2.5
14.6
0.8
1.2
0.2
0.7
-
0.7
0.6
-
86.4
0.1
-0.1
-0.2
0.3
1Q
15.6
12.4
3.2
20.7
0.8
1.0
0.2
1.6
14.7
-13.0
0.6
-
-5.0
-13.7
-0.0
-0.1
1.1
JK Cement
CMP: INR6,306 | TP: INR7,500 (+19%)
JKCE’s volume
is estimated to grow ~14% YoY. Blended
realization is estimated to increase 1% YoY.
EBITDA/t is estimated at INR934 vs. INR655/INR1,226 in
2QFY25/1QFY26.
Consolidated quarterly performance
Y/E March
Net Sales
Change (YoY %)
Total Expenditure
EBITDA
Change (YoY %)
Margin (%)
Depreciation
Interest
Other Income
PBT before EO Expense
Extra-Ord. Expense
PBT
Tax
Profit from Associate and MI
Tax-Rate (%)
Reported PAT
Adj. PAT
Change (YoY %)
Margin (%)
1Q
28.1
1.6
23.2
4.9
19.2
17.3
1.5
1.1
0.4
2.7
-
2.7
0.9
(0.0)
32.3
1.9
1.9
49.3
FY25
2Q
3Q
25.6
29.3
(7.0)
(0.2)
22.8
24.4
2.8
4.9
-39.2
-21.3
11.1
16.8
1.5
1.5
1.2
1.1
0.4
0.4
0.5
2.8
(1.0)
-
1.6
2.8
0.2
0.9
0.1
(0.0)
12.2
32.1
1.3
1.9
0.4
1.9
(80.0)
(33.3)
4Q
35.8
15.3
28.2
7.6
36.6
21.4
1.6
1.1
0.5
5.4
-
5.4
1.7
0.0
32.5
3.6
3.6
69.1
1Q
33.5
19.4
26.6
6.9
41.4
20.5
1.5
1.1
0.6
4.9
-
4.9
1.6
(0.0)
33.7
3.2
3.2
75.0
FY26E
2QE
29.4
14.8
24.8
4.6
61.8
15.6
1.5
1.1
0.3
2.3
-
2.3
0.6
-
28.0
1.6
1.6
358.2
3QE
32.2
9.8
25.9
6.3
27.7
19.5
1.6
1.1
0.3
4.0
-
4.0
1.1
-
29.0
2.8
2.8
48.6
4QE
40.9
14.2
32.1
8.8
14.4
21.4
1.9
1.4
0.6
6.0
-
6.0
1.7
-
27.9
4.3
4.3
20.1
Buy
EPS CHANGE (%): FY26|27|28: -4.9|-5.8|-7.1
Variable cost/t is expected to decline 6% YoY. Opex/t is
estimated to decline ~4% YoY.
EBITDA is estimated to increase ~62% YoY, while Adj. PAT
is estimated to surge ~358% YoY on a low base
(INR b)
FY25 FY26E
118.8
2.8
98.5
20.3
-1.6
17.1
6.0
4.6
1.7
11.4
(1.0)
12.4
3.7
0.1
29.8
8.6
7.7
(3.7)
136.0
14.5
109.5
26.5
30.8
19.5
6.4
4.7
1.8
17.2
-
17.2
5.1
(0.0)
29.8
12.0
12.0
56.0
6.6
1.4
6.5
10.1
9.7
5.6
8.7
10.6
6.5
8.9
October 2025
85
 Motilal Oswal Financial Services
September 2025 Results Preview | Sector: Cement
JK Lakshmi
CMP: INR869 | TP: INR1,150 (+32%)
Sales volume is expected to increase 10% YoY. Realization
is estimated to rise ~3% YoY.
EBITDA/t is estimated at INR736 vs. INR360/INR936 in
2QFY25/1QFY26.
Consolidated quarterly performance
Y/E March
Net Sales
Change (YoY %)
EBITDA
Change (YoY %)
Margin (%)
Depreciation
Interest
Other Income
PBT before EO Expense
Extra-Ord. Exp. (Inc.)
PBT
Tax
Prior Period Tax Adj.
Rate (%)
Reported PAT
Minority Interest
Adj. PAT
Change (YoY %)
Margin (%)
1Q
15.6
(9.6)
2.2
13.3
14.2
0.7
0.5
0.1
1.2
0.4
0.8
0.3
-
32.3
0.5
(0.0)
0.9
17.7
FY25
2Q
12.3
(21.6)
0.9
(58.9)
7.2
0.7
0.4
0.1
(0.2)
-
(0.2)
(0.1)
-
46.2
(0.1)
0.0
(0.1)
(115.1)
3Q
15.0
(12.1)
2.0
(33.2)
13.5
0.8
0.5
0.1
0.9
-
0.9
0.3
-
29.7
0.6
0.0
0.6
N/A
4Q
19.0
6.6
3.5
4.4
18.5
0.8
0.4
0.2
2.5
-
2.5
0.8
-
31.7
1.7
(0.1)
1.8
11.9
1Q
17.4
11.3
3.1
39.9
17.9
0.8
0.5
0.2
2.0
-
2.0
0.5
-
26.5
1.5
(0.0)
1.5
62.6
FY26E
2QE
14.1
13.9
2.0
124.8
14.3
0.8
0.5
0.1
0.9
-
0.9
0.2
-
22.5
0.7
0.0
0.7
N/A
FY25
3QE
16.4
9.4
2.8
37.6
17.0
0.8
0.5
0.1
1.6
-
1.6
0.4
-
22.5
1.2
0.0
1.2
104.2
4QE
19.7
3.6
3.7
5.6
18.9
0.8
0.5
0.1
2.5
-
2.5
0.7
-
30.4
1.7
(0.0)
1.7
(2.7)
61.9
(8.8)
8.6
(17.8)
14.0
3.0
1.8
0.5
4.3
0.4
3.9
1.2
-
30.7
2.7
(0.0)
3.1
(32.7)
Buy
EPS CHANGE (%): FY26|27|28: -2.4|-2.1|-0.6
We expect opex/t to decline ~4% YoY. Variable cost/t is
expected to decline ~9% YoY.
Depreciation and interest costs are expected to increase
~2% and 18% YoY, respectively. Adj. PAT is estimated to be
INR661m vs. a net loss of INR140m in 2QFY25.
(INR b)
FY26E
67.5
9.0
11.6
34.2
17.2
3.2
2.1
0.6
6.9
-
6.9
1.8
-
26.5
5.1
0.0
5.1
62.2
5.9
-1.1
4.0
9.3
8.6
4.7
7.4
8.7
5.1
7.5
The Ramco Cements
CMP: INR992| TP: INR1,050 (+6%)
Volume is expected to decline ~4% YoY, and realization is
expected to increase 8% YoY.
EBITDA/t is estimated at INR801 vs. INR695/INR966 in
2QFY25/1QFY26.
Standalone quarterly performance
Y/E March
1Q
Net Sales
20.9
Change (YoY %)
(6.8)
Total Expenditure
17.7
EBITDA
3.2
Change (YoY %)
(6.5)
Margin (%)
15.3
Depreciation
1.7
Interest
1.1
Other Income
0.1
PBT before EO Expense
0.5
Extra-Ord Exp./(Inc.)
-
PBT
0.5
Tax
0.1
Prior Year Tax Adj.
-
Rate (%)
26.3
Reported PAT
0.4
Adj. PAT
0.4
Change (YoY %)
(55.0)
Margins (%)
1.7
FY25
2Q
20.4
(12.5)
17.3
3.1
(21.7)
15.3
1.7
1.2
0.1
0.3
-
0.3
0.1
-
26.9
0.3
0.3
(74.7)
1.3
Neutral
EPS CHANGE (%): FY26|27|28: -16.2|-9.2|-2.8
Variable cost/t is expected to increase 9% YoY. Opex/t is
expected to increase ~7% YoY.
EBITDA is estimated to rise 11% YoY to INR3.5b. Adj. PAT is
estimated to jump 87% YoY to INR479m on a low base.
FY26E
2QE
21.2
3.9
17.7
3.5
8.4
16.4
1.8
1.1
0.1
0.7
-
0.7
0.2
-
28.0
0.5
0.5
87.2
2.3
FY25
3QE
21.4
8.2
18.0
3.4
9.2
15.9
1.9
1.0
0.1
0.6
-
0.6
0.1
-
25.0
0.4
0.4
1,312
2.1
4QE
27.0
12.7
21.4
5.6
99.6
20.7
1.9
1.1
0.1
2.7
-
2.7
0.8
-
28.5
1.9
1.9
585.1
7.2
85.0
(9.1)
72.6
12.3
(20.7)
14.5
6.9
4.6
0.4
1.3
(3.4)
4.7
0.5
-
10.4
4.2
0.9
(76.6)
1.1
(INR b)
FY26E
90.2
6.2
73.8
16.4
33.3
18.2
7.5
4.3
0.4
5.1
-
5.1
1.4
-
27.5
3.7
3.7
302.3
4.1
3Q
19.8
(6.2)
17.0
2.8
(29.3)
14.1
1.7
1.1
0.1
0.0
(3.3)
3.3
0.1
-
2.4
3.3
0.0
(96.6)
0.2
4Q
23.9
(10.5)
20.7
3.2
(23.1)
13.4
1.8
1.1
0.1
0.4
(0.1)
0.5
0.2
-
37.1
0.3
0.3
(76.7)
1.2
1Q
20.7
(0.9)
16.7
4.0
(74.4)
19.2
1.8
1.0
0.1
1.2
-
1.2
0.3
-
26.2
0.9
0.9
142.3
4.2
October 2025
86
 Motilal Oswal Financial Services
September 2025 Results Preview | Sector: Cement
Shree Cement
CMP: INR29,262| TP: INR32,000 (+9%)
Volume is expected to increase 6% YoY, and blended
realization is likely to improve ~7% YoY.
We estimate EBITDA/t at INR1,198 vs. INR780/INR1,373 in
2QFY25/1QFY26.
Standalone quarterly performance
Y/E March
Net Sales
Change (YoY %)
Total Expenditure
EBITDA
Change (YoY %)
Margin (%)
Depreciation
Interest
Other Income
PBT before EO Exp.
Extra-Ord. Exp./(Inc.)
PBT
Tax
Rate (%)
Reported PAT
Prior Period Tax Adj.
Adj. PAT
Change (YoY %)
1Q
48.3
-2.7
39.2
9.2
-1.7
19.0
6.4
0.6
1.3
3.5
0.0
3.5
0.3
9.4
3.2
0.0
3.2
-45.3
FY25
2Q
37.3
-18.3
31.3
5.9
-31.9
15.9
6.7
0.6
1.8
0.4
0.0
0.4
-0.5
-108.1
0.9
0.0
0.9
-81.0
3Q
42.4
-13.6
32.9
9.5
-23.3
22.3
7.5
0.5
1.1
2.6
0.0
2.6
0.3
11.4
2.3
0.0
2.3
-68.8
4Q
52.4
3.3
38.3
14.1
6.4
26.9
7.5
0.4
1.5
7.7
0.3
7.4
1.9
25.1
5.6
0.0
5.8
-12.5
1Q
49.5
2.3
37.2
12.3
34.1
24.8
5.5
0.4
2.0
8.3
0.0
8.3
2.1
25.8
6.2
0.0
6.2
94.7
FY26E
2QE
42.4
13.8
32.7
9.6
62.8
22.8
7.6
0.5
1.4
2.9
0.0
2.9
0.7
25.5
2.2
0.0
2.2
131.4
Neutral
EPS CHANGE (%): FY26|27|28: +2.2|+2.3|+5.8
Variable cost/t is estimated to decline 4% YoY. Opex/t is
estimated to decline 1% YoY.
Depreciation is estimated to increase ~14% YoY, while
interest is estimated to decline ~10% YoY. Adj. PAT is
estimated to increase ~131% YoY on a low base.
FY25
3QE
47.4
11.9
36.0
11.4
20.3
24.0
8.6
0.5
1.3
3.6
0.0
3.6
0.9
25.5
2.7
0.0
2.7
15.9
4QE
55.6
6.1
40.1
15.5
9.6
27.9
9.4
0.5
1.6
7.1
0.0
7.1
1.9
26.7
5.2
0.0
5.2
-10.4
180.4
-7.5
141.7
38.7
-11.4
21.4
28.1
2.1
5.8
14.3
-0.3
14.0
2.0
14.4
12.0
0.0
12.2
-50.6
(INR b)
FY26E
194.9
8.0
146.1
48.8
26.2
25.0
31.1
2.0
6.2
21.9
0.0
21.9
5.7
26.0
16.2
0.0
16.2
32.8
UltraTech Cement
CMP: INR12,119 | TP: INR14,500(+20%)
Sales volume (consolidated) is expected to increase ~17%
YoY. On a like-for-like
basis, UTCEM’s volume growth is
estimated to grow at ~4% YoY.
Blended realization is likely to increase 1% YoY.
RMC revenue is expected to increase 13% YoY, whereas
white cement revenue is expected to increase 16% YoY.
Consolidated performance
1Q
188.2
6.1
158.0
30.2
-1.1
16.0
9.2
3.3
1.7
19.4
0.88
18.5
3.6
0.0
19.6
14.9
0.0
15.7
-7.3
FY25
2Q
156.3
-2.4
136.2
20.2
-20.9
12.9
9.0
3.2
2.2
10.2
-
10.2
1.9
0.0
18.8
8.3
0.1
8.2
-36.0
3Q
177.8
6.2
148.8
28.9
-11.1
16.3
9.9
4.6
2.5
16.9
-
16.9
3.3
0.0
19.4
13.6
0.1
13.6
-23.5
4Q
230.6
13.0
184.4
46.2
12.3
20.0
11.2
4.8
1.0
31.2
0.09
31.1
6.3
0.0
20.1
24.9
0.0
24.9
7.8
1Q
212.8
13.1
168.7
44.1
46.2
20.7
11.1
4.3
1.8
30.5
0.38
30.1
7.9
0.0
26.1
22.3
0.0
22.5
44.0
FY26E
2QE
184.8
18.2
154.1
30.6
51.8
16.6
11.4
4.5
1.9
16.6
-
16.6
3.8
0.0
23.0
12.8
0.0
12.8
56.2
FY25
3QE
204.8
15.2
166.0
38.8
34.1
18.9
11.7
4.6
2.0
24.5
-
24.5
5.6
0.0
23.0
18.8
0.0
18.9
38.7
4QE
264.6
14.7
214.2
50.4
9.1
19.0
15.3
6.1
1.4
30.3
-
30.3
6.8
0.0
22.3
23.6
0.1
23.5
-5.6
759.6
7.1
634.0
125.6
-3.2
16.5
40.1
16.5
7.4
76.4
0.97
75.4
14.9
0.0
19.7
60.5
-0.1
61.2
-13.3
Buy
EPS CHANGE (%): FY26|27|28: -13.6|-7.5|-7.2
Variable cost per ton is expected to decline ~4% YoY, and
opex/t is expected to dip 3% YoY.
We expect EBITDA/t at INR951 vs INR725/INR1,197 in
2QFY25/1QFY26.
Depreciation/interest expenses are estimated to increase
26%/41% YoY. Adj. PAT is estimated to increase 56% YoY.
(INR b)
FY26E
866.9
14.1
703.0
163.9
30.6
18.9
49.5
19.5
7.0
101.9
0.38
101.6
24.1
0.0
23.7
77.5
0.0
77.9
27.3
Net Sales
Change (YoY %)
Total Expenditure
EBITDA
Change (YoY %)
Margin (%)
Depreciation
Interest
Other Income
PBT before EO Expense
Extra-Ord. Expense
PBT after EO Expense
Tax
Prior Period Tax Adj.
Rate (%)
Reported PAT
Minority Interest
Adj. PAT
Change (YoY %)
October 2025
87
 Motilal Oswal Financial Services
September 2025 Results Preview | Sector: Chemicals
Chemicals
Company
Alkyl Amines Chemicals
Atul
Clean Science
Deepak Nitrite
Ellenbarrie
Fine Organic Industries
Galaxy Surfactants
Navin Fluorine International
NOCIL
PI Industries
SRF
Tata Chemicals
Vinati Organics
Volume-led recovery amid weak spreads and pricing pressure
Brent crude prices
averaged USD68/bbl in Sep’25 (vs.
USD67.9/bbl
in Aug’25).
Oil
prices remained stable MoM despite oversupply and weak demand. This stability
was established due to geopolitical risks and an
aggressive increase in China’s
crude imports and stockpiling.
Prices of organic compounds, Butadiene (Korea)/ Toluene (Korea), fell 31%/11%
YoY in Sep’25, while prices of Benzene decreased 19% YoY and Propylene (Korea)
fell 5% YoY Sep’25. Prices of other key materials, Aniline/Acetone/IPA, dipped
22%/29%/15% YoY in Sep’25. Price of ACN rose
3% YoY in Sep’25.
Blended Phenol
and Acetone spread stood at INR82/kg in 2QFY26 (down 13% YoY). Acetic Acid was
down 5% YoY, while Ammonia prices decreased 10% YoY to INR32/kg in 2QFY26.
We estimate our coverage universe to report: 1) sales growth of 5% YoY, 2)
EBITDA growth of 4% YoY, and 3) PAT growth of 1% YoY in 2QFY26. Aggregate
gross margin is likely to expand 20bp YoY. Aggregate EBITDAM may contract
20bp YoY and 110bp QoQ.
In the first two months of 2QFY26, only two companies in our coverage universe
saw an uptick in total export value. ATLP, NFIL and VO have shown YoY growth,
while the rest have reported a decline in value terms. While INR depreciated ~2%
YoY vs. USD in 2QFY26, making export revenue appear marginally higher YoY.
We expect the companies to exhibit a measured recovery, underpinned by scale-
up in specialty segments and steady progress in domestic import substitution.
Near-term margin trajectories remain mixed given consistent oversupply in the
market and a gradual normalization in agrochemical demand. Key variables to
track in 2HFY26 include the timely execution of planned commissioning activities
and the implications of ongoing trade-remedy measures.
Exhibit 1: Summary of
2QFY26 performance estimates
Sector
Alkyl Amines
Atul
Clean Science
Deepak Nitrite
Ellenbarrie Industrial
Fine Organic
Galaxy Surfactants
Navin Fluorine
NOCIL
P I Industries
SRF
Tata Chemicals
Vinati Organics
Chemicals
CMP
(INR)
1900
6182
1097
1842
470
4525
2226
4624
174
3584
2907
918
1724
RECO
Neutral
Buy
Neutral
Sell
Buy
Sell
Buy
Neutral
Neutral
Buy
Buy
Neutral
Buy
SALES (INR M)
Var
Var
Sep-25
% YoY % QoQ
4,232
2.0
4.4
15,792
13.4
6.8
2,604
9.4
7.2
19,229
-5.4
1.7
930
NA
11.2
6,256
5.0
6.3
12,501
17.6
-2.2
7,519
45.0
3.7
3,448
-4.9
2.5
17,769
-20.0
-6.5
38,840
13.4
1.7
41,974
5.0
12.9
6,307
14.0
16.3
1,77,400
5.5
4.3
EBDITA (INR M)
Var
Var
Sep-25
% YoY % QoQ
776
5.6
1.4
2,890
19.1
22.7
977
9.0
-2.1
1,930
-35.1
1.8
351
NA
14.5
1,277
-15.2
3.3
1,324
3.8
6.9
1,731
61.3
-16.3
310
-16.3
5.0
4,349
-30.8
-16.2
8,247
47.1
0.4
6,250
1.1
-3.7
1,699
26.8
2.5
32,113
4.7
-1.8
NET PROFIT (INR M)
Var
Var
Sep-25
% YoY % QoQ
505
6.3
2.1
1,790
28.3
35.2
668
13.7
-4.6
1,151
-40.7
2.5
254
NA
35.6
1,041
-11.4
-7.0
824
-2.7
3.7
892
51.7
-23.9
195
-52.9
17.8
3,264
-35.8
-18.4
4,286
91.3
1.2
2,097
8.1
-16.8
1,251
17.9
10.9
18,218
2.7
-3.9
Research Analyst: Sumant Kumar
(Sumant.Kumar@MotilalOswal.com) |
Meet Jain
(Meet.Jain@MotilalOswal.com)
Research Analyst: Nirvik Saini
(Nirvik.Saini@MotilalOswal.com)
|
Yash Darak
(Yash.darak@MotilalOswal.com)
October 2025
88
 Motilal Oswal Financial Services
September 2025 Results Preview | Sector: Chemicals
Exhibit 2:
Comparative valuations
Company Name
Chemicals
Alkyl Amines
Atul
Clean Science
Deepak Nitrite
Ellenbarrie Industrial
Fine Organic
Galaxy Surfactants
Navin Fluorine
NOCIL
P I Industries
SRF
Tata Chemicals
Vinati Organics
CMP
INR
1,900
6,182
1,097
1,842
470
4,525
2,226
4,624
174
3,584
2,907
918
1,724
Reco
Neutral
Buy
Neutral
Sell
Buy
Sell
Buy
Neutral
Neutral
Buy
Buy
Neutral
Buy
EPS (INR)
PE (x)
PB (x)
ROE (%)
FY26E FY27E FY28E FY26E FY27E FY28E FY26E FY27E FY28E FY26E FY27E
36.7 28.7 25.4
3.9
3.5
3.1
10.5 12.1
38.7
44.5 47.3
49.0
42.7 40.1
6.3
5.7
5.2
13.5
14.0
225.0 260.6 277.3 27.5
23.7 22.3
3.0
2.7
2.4
11.3
11.8
31.1
39.2 44.7
35.3
28.0 24.5
6.9
5.7
4.8
21.3
22.3
47.9
61.7 64.1
38.4
29.9 28.8
4.2
3.8
3.4
11.5
13.3
9.4
15.6 18.7
49.9
30.2 25.1
6.4
5.3
4.4
17.5
19.3
136.8 138.7 158.2 33.1
32.6 28.6
5.3
4.6
4.0
17.4
15.2
89.7 105.2 118.8 24.8
21.2 18.7
3.0
2.7
2.5
12.8
13.6
88.5 112.4 134.5 52.3
41.1 34.4
6.3
5.6
5.0
14.2
14.5
5.2
6.5
7.5
33.7
26.7 23.2
1.6
1.5
1.5
4.8
5.9
98.8 118.0 134.3 36.3
30.4 26.7
4.8
4.2
3.7
13.9
14.7
69.5
93.6 107.7 41.8
31.0 27.0
6.1
5.2
4.5
15.4
18.2
34.8
54.4 60.6
26.4
16.9 15.1
1.1
1.0
1.0
4.1
6.1
50.4
58.5 69.7
34.2
29.5 24.8
5.5
4.8
4.1
17.3
17.4
FY28E
12.3
13.5
11.4
21.2
12.4
19.1
15.1
13.9
15.4
6.5
14.7
18.0
6.5
18.0
Exhibit 3:
Relative performance
three-month (%)
105
100
95
90
85
Nifty Index
MOFSL Chemicals Index
Exhibit 4:
Relative performance
one-year (%)
103
96
89
82
75
Nifty Index
MOFSL Chemicals Index
Source: Bloomberg, MOFSL
Exhibit 5:
Revenue snapshot for our coverage universe
Aggregate Revenue (INR b)
153.1
130.4 140.4
122.6
173.0 169.0 176.0
170.0 172.8 163.6 168.2 158.2
155.4 150.0 156.7 163.4 168.2 159.3
Source: Company, MOFSL
*Aggregate is without Ellenbarrie due to non-availability of number
October 2025
89
 Motilal Oswal Financial Services
September 2025 Results Preview | Sector: Chemicals
Exhibit 6: Gross margin snapshot for our coverage universe
Aggregate Gross margin (%)
*Aggregate is without Ellenbarrie
Source: Company, MOFSL
Exhibit 7:
EBITDAM snapshot for our coverage universe
Aggregate EBITDAM (%)
*Aggregate is without Ellenbarrie
Source: Company, MOFSL
Exhibit 8:
EBIT margin snapshot for our coverage universe
Aggregate EBIT margin (%)
*Aggregate is without Ellenbarrie
Source: Company, MOFSL
Exhibit 9:
PAT margin snapshot for our coverage universe
Aggregate adj. PAT margin (%)
*Aggregate is without Ellenbarrie
Source: Company, MOFSL
October 2025
90
 Motilal Oswal Financial Services
September 2025 Results Preview | Sector: Chemicals
Trends in key RM and product prices
Exhibit 10:
Brent crude price down 14% YoY
120.0
105.0
90.0
75.0
60.0
68.0
Brent (USD/bbl)
Exhibit 11:
Propylene (Korea) price down 5% YoY
1000
900
800
770
USD/MT
Propylene Korea
700
600
Source: Reuters, MOFSL
Source: Bloomberg, MOFSL
Exhibit 12:
Butadiene price down 31% YoY
1800
1500
1200
900
600
1,061
USD/MT
Exhibit 13:
Toluene (Korea) price down 18% YoY
1100
950
800
650
500
USD/MT
Toluene Korea
Butadiene Korea
664
Source: Bloomberg, MOFSL
Exhibit 14:
IPA price down 19% YoY
210
170
130
115
IPA (INR/kg)
Exhibit 15:
Aniline price down 22% YoY
Aniline (INR/kg)
200
150
100
50
0
128
90
50
Source: IndiaPetroChem, MOFSL
October 2025
91
 Motilal Oswal Financial Services
September 2025 Results Preview | Sector: Chemicals
Exhibit 16:
Acetic Acid price down 5% YoY
80
60
40
20
0
Acetic Acid (INR/kg)
49
Exhibit 17:
ACN price down 1% YoY
160
150
140
144
130
120
ACN (INR/kg)
Source: IndiaPetroChem, MOFSL
Exhibit 18:
Benzene price down 19% YoY
110
100
90
80
70
78
Benzene (INR/lit)
Exhibit 19:
Phenol price down 12% YoY
134
118
102
86
70
102
Phenol (INR/kg)
Source: IndiaPetroChem, MOFSL
Exhibit 20:
Acetone price down 31% YoY
120
100
80
60
40
73
Acetone (INR/kg)
Exhibit 21:
Ammonia price down 10% YoY
50
40
30
20
10
Ammonia (INR/kg)
33
Source: IndiaPetroChem, MOFSL
October 2025
92
 Motilal Oswal Financial Services
September 2025 Results Preview | Sector: Chemicals
Exhibit 22:
Blended Phenol and Acetone spread down 13% YoY
145
115
85
Blended (Phenol+Acetone) spread (INR/kg)
Long-term Average
95
91
55
25
Source: IndiaPetroChem, MOFSL
Exhibit 23:
Caustic Soda Lye price up 6% YoY
50
40
34
30
20
10
Caustic Soda Lye (INR/kg)
Exhibit 24:
Caustic Soda Flakes price up 16% YoY
55
50
45
40
35
30
Caustic Soda Flakes (INR/kg)
47
Source: IndiaPetroChem, MOFSL
Exhibit 25:
Polycarbonate price down 12% YoY
China Chemicals SunSirs PC Polycarbonate (USD/mt)
3,100
2,700
2,856
Long term average
2,300
1,900
1,500
2,006
Source: Bloomberg, MOFSL
October 2025
93
 Motilal Oswal Financial Services
September 2025 Results Preview | Sector: Chemicals
The tables below provide a snapshot of actual and estimated numbers for companies under the MOFSL coverage
universe. Highlighted columns indicate the quarter/financial year under review.
Alkyl Amines
Neutral
CMP: INR1,900 | TP: INR2,00 (+5%)
EPS CHANGE (%): FY26|27: -12|-12
Expect revenue to increase 2% YoY and EBITDA to grow ~6%
Expect EBITDA margin to expand 60bp YoY to 18.3% in
YoY.
2QFY26.
Key monitorables: Stabilization of the Ethylamines plant and
Watch out for updates on the progress of new products and
update on ACN market conditions post the ADD imposition.
ADD probe on MIPA.
Standalone - Quarterly Snapshot
Y/E March
Gross Sales
YoY Change (%)
Gross Margin (%)
EBITDA
Margin (%)
Depreciation
Interest
Other Income
PBT before EO expense
PBT
Tax
Rate (%)
Adj PAT
YoY Change (%)
Margin (%)
1Q
3,997
-2.5
47.0%
791
19.8
177
2
47
659
659
170
25.9
489
-1.8
12.2
FY25
2Q
3Q
4,149
3,712
17.8
15.3
45.4% 48.4%
735
712
17.7
19.2
180
179
4
9
92
66
643
591
643
591
169
153
26.2
25.9
475
438
74.2
30.9
11.4
11.8
4Q
3,861
8.3
45.9%
678
17.6
176
2
93
594
594
133
22.5
460
19.7
11.9
1Q
4,055
1.5
45.8%
766
18.9
179
3
80
663
663
169
25.5
494
1.2
12.2
FY26
2QE
3QE
4,232
4,083
2.0
10.0
46.3% 48.2%
776
746
18.3
18.3
187
193
3
3
88
91
674
641
674
641
170
161
25.2
25.2
505
479
6.3
9.6
11.9
11.7
4QE
4,247
10.0
46.8%
776
18.3
197
4
99
675
675
170
25.2
505
9.7
11.9
FY25
(INR m)
FY26E
15,718 16,617
9.1
5.7
46.6% 46.8%
2,911
3,063
18.5
18.4
712
756
10
12
298
358
2,486
2,653
2,486
2,653
625
670
25.1
25.2
1,861
1,984
25.0
6.6
11.8
11.9
Atul
Buy
CMP: INR6,182| TP: INR9,120 (+48%)
EPS CHANGE (%): FY26|27: -4|+2
Expect revenue to increase 13% YoY and EBITDA to rise 20%
EBITDA margin is likely to expand 90bp YoY, while gross
YoY.
margin is anticipated to contract 40bp YoY.
Expect revenue for Life Science Chemicals to grow by 20%
Monitor the commissioning and subsequent ramp-up of
YoY, while revenue for Performance to increase 11% YoY.
newly added capacities throughout CY25.
Consolidated - Quarterly Snapshot
Y/E March
Gross Sales
YoY Change (%)
Gross Margin (%)
EBITDA
Margin (%)
Depreciation
Interest
Other Income
PBT before EO expense
PBT
Tax
Rate (%)
Minority Interest and Profit/Loss of Asso. Cos.
Reported PAT
Adj PAT
YoY change (%)
Margin (%)
1Q
13,221
11.8
50.0%
2,232
16.9
766
54
130
1,543
1,543
455
29.5
33
1,121
1,121
9.8
8.5
FY25
2Q
3Q
13,928 14,168
16.7
24.5
53.1% 50.5%
2,427
2,241
17.4
15.8
775
810
89
43
315
158
1,878
1,546
1,878
1,546
514
407
27.4
26.4
31
33
1,395
1,171
1,395
1,171
52.9
62.5
10.0
8.3
4Q
14,516
19.8
49.7%
2,229
15.4
817
54
487
1,845
1,845
560
30.3
16
1,301
1,301
121.3
9.0
1Q
14,780
11.8
48.7%
2,355
15.9
820
45
262
1,752
1,752
447
25.5
19
1,324
1,324
18.1
9.0
FY26
2QE
3QE
15,792 16,521
13.4
16.6
52.7% 50.0%
2,890
2,810
18.3
17.0
830
836
58
63
355
290
2,356
2,201
2,356
2,201
595
554
25.2
25.2
28
28
1,790
1,675
1,790
1,675
28.3
43.1
11.3
10.1
FY25
4QE
17,279
19.0
50.5%
2,938
17.0
841
78
380
2,399
2,399
597
24.9
38
1,840
1,840
41.4
10.6
55,834
18.1
50.8%
9,130
16.4
3,168
240
1,090
6,812
6,812
1,937
28.4
113
4,988
4,988
53.9
8.9
(INR m)
FY26E
64,371
15.3
50.5%
10,993
17.1
3,328
245
1,287
8,708
8,708
2,192
25.2
113
6,629
6,629
32.9
10.3
October 2025
94
 Motilal Oswal Financial Services
September 2025 Results Preview | Sector: Chemicals
Ellenbarrie Industrial Gases
CMP: INR470 | TP: INR640 (+36%)
Expect revenue to increase 11% QoQ to INR930m.
Buy
EPS CHANGE (%): FY26|27: -10|-8
EBITDA margin likely to be at 36.8% vs. 36.7% in 1QFY26
Ellenbarrie is set to commission and ramp up its new capacity
in CY25, driving volume growth and margin expansion ahead.
(INR m)
FY25
1Q
4Q
673
825
NA
NA
454
579
88.6%
85.4%
219
246
32.5
29.8
49
65
39
54
79
114
211
241
0
0
211
241
49
59
23.2
24.3
162
183
NA
NA
24.1
22.2
1Q
836
24.3
529
88.8%
307
36.7
51
46
68
278
0
278
91
32.8
187
15.6
22.4
FY26
2QE
3QE
930
1,150
NA
NA
578
677
89.9%
85.4%
351
473
37.8
41.1
58
62
35
29
80
100
338
482
0
0
338
482
85
121
25.0
25.0
254
362
38.9
93.2
27.3
31.4
4QE
1,550
87.9
900
89.8%
650
41.9
70
25
118
673
0
673
150
22.3
523
106.2
33.8
FY25
3,125
16.0
2,027
88.6%
1,097
35.1
207
171
359
1,078
0
1,078
245
22.8
833
26.7
FY26E
4,466
42.9
2,684
88.5%
1,782
39.9
241
135
366
1,773
0
1,773
446
25.2
1,326
59.3
29.7
Consolidated - Quarterly Snapshot
Y/E March
Gross Sales
YoY Change (%)
Total Expenditure
Gross Margin (%)
EBITDA
Margin (%)
Depreciation
Interest
Other Income
PBT before EO expense
Extra-Ord. expense
PBT
Tax
Rate (%)
Adj. PAT
YoY Change (%)
Margin (%)
Clean Science & Technology
CMP: INR1,097 | TP: INR1,175 (+7%)
Expect revenue to increase 9% YoY; EBITDA to increase 9%
YoY
Key monitorables: Ramp-up of the new HALS plant in the
subsidiary and updates on new product commissioning.
Consolidated - Quarterly Snapshot
Y/E March
Gross Sales
YoY Change (%)
Gross Margin (%)
EBITDA
Margin (%)
Depreciation
Other Income
PBT
Tax
Rate (%)
Adj. PAT
YoY Change (%)
Margin (%)
1Q
2,240
19.1
65.4%
947
42.3
158
99
887
228
25.7
659
11.9
29.4
FY25
2Q
3Q
2,381 2,408
31.5
23.7
62.4% 63.5%
897
985
37.7
40.9
175
183
111
52
832
853
245
196
29.4
23.0
587
656
12.6
4.8
24.7
27.3
4Q
2,637
15.9
63.7%
1,048
39.7
174
124
996
255
25.6
741
5.4
28.1
1Q
2,429
8.4
65.5%
999
41.1
187
134
946
245
25.9
701
6.3
28.8
FY26
2QE
3QE
2,604 3,059
9.4
27.0
63.3% 65.0%
977 1,252
37.5
40.9
194
197
122
129
904 1,183
236
247
26.1
20.9
668
936
13.7
42.6
25.7
30.6
4QE
3,414
29.5
61.2%
1,344
39.4
203
119
1,259
259
20.6
1,000
35.0
29.3
Neutral
EPS CHANGE (%): FY26|27: -2|-2
Expect EBITDAM to remain stable at 37.5% in 2QFY26.
Watch out for the changing sales mix between the flagship
and non-flagship products.
(INR m)
FY25 FY26E
9,666
22.1
63.7%
3,876
40.1
691
386
3,567
923
25.9
2,644
8.3
27.4
11,506
19.0
63.6%
4,573
39.7
781
505
4,292
987
23.0
3,305
25.0
28.7
October 2025
95
 Motilal Oswal Financial Services
September 2025 Results Preview | Sector: Chemicals
Deepak Nitrite
CMP: INR1,842 | TP: INR1,540 (-16%)
Expect revenue to decrease 5% YoY.
Sell
EPS CHANGE (%): FY26|27: -15|-5
Successful commissioning and run‑rate stabilization of WNA
by 2Q end; we expect margin expansion from 3Q onward.
Key risks: Substantial margin fluctuations due to the highly
commoditized nature of the products.
(INR m)
FY26E
Expect EBITDA margin of 10% (vs. 14.6% in 2QFY25).
Consolidated - Quarterly Snapshot
Y/E March
Gross Sales
YoY Change (%)
Gross Margin (%)
EBITDA
Margin (%)
Depreciation
Interest
Other Income
PBT before EO expense
Extra-Ord expense
PBT
Tax
Rate (%)
Reported PAT
Adj PAT
YoY Change (%)
Margin (%)
1Q
21,668
22.5
30.8%
3,092
14.3
475
58
188
2,748
0
2,748
723
26.3
2,025
2,025
35.1
9.3
FY25
2Q
3Q
20,320 19,034
14.3
-5.3
32.0% 26.8%
2,975
1,685
14.6
8.9
485
482
63
61
213
210
2,640
1,352
0
0
2,640
1,352
698
371
26.4
27.4
1,942
981
1,942
981
-5.3
-51.4
9.6
5.2
4Q
1Q
21,797 18,899
2.5
-12.8
30.6% 28.0%
3,166
1,896
14.5
10.0
513
513
93
81
228
246
2,788
1,547
0
0
2,788
1,547
762
425
27.3
27.5
2,025
1,123
2,025
1,123
3.4
-44.6
9.3
5.9
FY26
2QE
3QE
4QE
19,229 20,963 23,738
-5.4
10.1
8.9
27.5% 30.7% 32.0%
1,930
2,836
3,559
10.0
13.5
15.0
525
560
600
102
107
113
237
225
249
1,540
2,394
3,095
0
0
0
1,540
2,394
3,095
389
604
769
25.2
25.2
24.8
1,151
1,790
2,326
1,151
1,790
2,326
-40.7
82.4
14.8
6.0
8.5
9.8
FY25
82,819 82,828
7.8
0.0
30.1% 29.7%
10,918 10,221
13.2
12.3
1,954
1,995
275
403
839
956
9,528
8,779
0
0
9,528
8,779
2,554
2,240
26.8
25.5
6,974
6,539
6,974
6,539
-7.3
-6.2
8.4
7.9
Fine Organic Industries
CMP: INR4,525 | TP: INR3,980 (-12%)
Expect revenue to decline 2% YoY and EBITDA margin to
contract 310bp YoY to 20.9% in 2QFY26.
Sell
EPS CHANGE (%): FY26|27: -1|-5
Be advised of escalating freight costs and prolonged lead
times for exports specifically routed to the US and Europe.
Key risk: Delay in capacity addition could dent growth, with
almost all existing capacities running at optimum utilization.
(INR m)
FY25 FY26E
4QE
6,371 22,655 24,157
5.0
16.1
6.6
5,071 17,566 19,221
39.6% 22.5% 20.4%
1,301 5,089 4,935
20.4
22.5
20.4
140
512
523
7
17
22
292
966 1,230
1,446 5,527 5,621
70
0
-70
1,376 5,527 5,691
363 1,350 1,436
26.3
24.4
25.2
0
0
7
1,014 4,177 4,247
1,065 4,177 4,195
9.3
13.5
0.4
16.7
18.4
17.4
Consolidated - Income Statement
Y/E March
Gross Sales
YoY Change (%)
Total Expenditure
Gross Margin (%)
EBITDA
Margin (%)
Depreciation
Interest
Other Income
PBT before EO expense
Extra-Ord expense
PBT
Tax
Rate (%)
Minority Interest & Profit/Loss of Asso. Cos.
Reported PAT
Adj PAT
YoY Change (%)
Margin (%)
1Q
5,497
0.5
4,100
43.6%
1,397
25.4
117
4
245
1,521
0
1,521
383
25.2
5
1,134
1,134
13.6
20.6
FY25
2Q
3Q
5,958 5,132
10.2
5.1
4,452 4,142
42.8% 39.4%
1,506
990
25.3
19.3
124
130
4
4
219
291
1,597 1,146
0
0
1,597 1,146
418
319
26.2
27.8
5
0
1,175
827
1,175
827
13.6
-12.2
19.7
16.1
4Q
6,068
11.0
4,872
39.6%
1,196
19.7
148
5
258
1,300
0
1,300
327
25.2
-1
974
974
-15.2
16.1
1Q
5,884
7.0
4,648
40.4%
1,236
21.0
118
5
398
1,511
-70
1,581
403
25.5
7
1,171
1,119
-1.3
19.0
FY26
2QE
3QE
6,256 5,645
5.0
10.0
4,980 4,523
40.0% 40.0%
1,277 1,122
20.4
19.9
130
135
5
6
250
290
1,392 1,272
0
0
1,392 1,272
351
320
25.2
25.2
0
0
1,041
951
1,041
951
-11.4
15.0
16.6
16.9
October 2025
96
 Motilal Oswal Financial Services
September 2025 Results Preview | Sector: Chemicals
Galaxy Surfactants
Buy
CMP: INR2,226 | TP: INR2,630 (+18%)
EPS CHANGE (%): FY26|27: -3|-3
Expect revenue to increase 18% YoY, with rising volumes and
EBITDA margin to be 10.6%, with absolute EBITDA/kg flat
improving realization in 2QFY26.
YoY.
The impact of the various geopolitical uncertainties would
also be keenly monitored.
Consolidated - Quarterly Snapshot
Y/E March
Gross Sales
YoY Change (%)
Total Expenditure
Gross Margin (%)
EBITDA
Margin (%)
Depreciation
Interest
Other Income
PBT
Tax
Rate (%)
Reported PAT
Adj PAT
YoY Change (%)
Margin (%)
1Q
9,741
3.4
8,500
33.6%
1,241
12.7
266
40
54
989
192
19.4
797
797
6.0
8.2
FY25
2Q
3Q
10,630 10,417
8.1
10.8
9,353
9,361
33.0% 31.1%
1,276
1,056
12.0
10.1
278
277
41
50
87
40
1,045
769
198
123
18.9
16.0
847
646
847
646
9.4
-9.5
8.0
6.2
4Q
11,449
23.2
10,180
29.4%
1,269
11.1
283
62
78
1,001
243
24.2
759
759
-2.1
6.6
1Q
12,779
31.2
11,541
26.2%
1,239
9.7
293
66
112
992
197
19.9
795
795
-0.3
6.2
FY26
2QE
3QE
12,501 12,032
17.6
15.5
11,176 10,768
27.8% 28.5%
1,324
1,263
10.6
10.5
294
301
67
72
70
61
1,033
951
209
192
20.2
20.2
824
759
824
759
-2.7
17.5
6.6
6.3
FY25
4QE
11,393
-0.5
10,096
31.0%
1,297
11.4
308
74
88
1,003
203
20.2
800
800
5.5
7.0
42,237
11.3
37,394
31.7%
4,842
11.5
1,103
193
258
3,804
755
19.8
3,049
3,049
1.1
7.2
(INR m)
FY26E
48,705
15.3
43,581
28.3%
5,124
10.5
1,195
279
331
3,980
801
20.1
3,178
3,178
4.2
6.5
Navin Fluorine International
CMP: INR4,624 | TP: INR5,100 (+10%)
Expect revenue to grow 45% YoY to INR7.5b, led by strong
growth across segments.
Key monitorable: Company is expected to execute AHF
commissioning by end-2QFY26.
Consolidated - Quarterly Snapshot
Y/E March
Gross Sales
YoY Change (%)
Gross Margin (%)
EBITDA
Margin (%)
Depreciation
Interest
Other Income
PBT before EO expense
Extra-Ord. expense
PBT
Tax
Rate (%)
Minority Interest & Profit/Loss of Asso. Cos.
Reported PAT
Adj. PAT
YoY Change (%)
Margin (%)
1Q
5,237
6.6
56.0%
1,004
19.2
267
156
103
683
0
683
171
25.0
0
512
512
-16.8
9.8
FY25
2Q
3Q
5,186 6,062
9.9
21.2
56.8% 56.6%
1,074 1,473
20.7
24.3
279
296
139
202
112
105
768 1,080
0
0
768 1,080
179
244
23.4
22.6
0
0
588
836
588
836
-2.9 131.2
11.3
13.8
4Q
7,009
16.4
54.2%
1,787
25.5
353
283
118
1,270
0
1,270
320
25.2
0
950
950
35.0
13.6
1Q
7,254
38.5
57.6%
2,068
28.5
352
304
139
1,551
0
1,551
379
24.5
0
1,172
1,172
128.8
16.2
FY26
2QE
3QE
7,519 8,487
45.0
40.0
56.0% 56.0%
1,731 2,094
23.0
24.7
371
410
291
290
123
125
1,192 1,519
0
0
1,192 1,519
300
383
25.2
25.2
0
0
892 1,135
892 1,135
51.7
35.8
11.9
13.4
Neutral
EPS CHANGE (%): FY26|27: 0|0
EBITDA margin to expand 230bp YoY to 23%.
Watch out for rising volumes and realization.
FY25
4QE
8,692
24.0
56.9%
2,258
26.0
420
157
109
1,791
0
1,791
461
25.7
0
1,330
1,330
40.0
15.3
(INR m)
FY26E
23,494 31,952
13.8
36.0
55.8% 56.6%
5,337 8,151
22.7
25.5
1,194 1,553
779 1,041
437
495
3,801 6,053
0
0
3,801 6,053
915 1,523
24.1
25.2
0
0
2,886 4,529
2,886 4,529
26.3
56.9
12.3
14.2
October 2025
97
 Motilal Oswal Financial Services
September 2025 Results Preview | Sector: Chemicals
NOCIL
CMP: INR174 | TP: INR160 (-8%)
Expect revenue to decline 5% YoY to INR3.4b, with volume
and realization declining YoY.
Key monitorables: further details on new capex
announcements.
Standalone - Quarterly Earning Model
Y/E March
Gross Sales
YoY Change (%)
Gross Margin (%)
EBITDA
Margin (%)
Depreciation
Interest
Other Income
PBT
Tax
Rate (%)
Reported PAT
Adj PAT
YoY Change (%)
Margin (%)
1Q
3,722
-6.2
41.7%
398
10.7
128
5
100
364
92
25.3
272
272
-18.9
7.3
FY25
2Q
3,627
3.4
43.3%
371
10.2
130
5
88
324
-91
-28.0
415
415
54.3
11.4
3Q
3,181
-6.6
44.4%
238
7.5
132
4
148
249
64
25.7
185
185
-37.8
5.8
4Q
3,397
-4.7
41.6%
335
9.9
132
4
54
254
50
19.7
204
204
-50.4
6.0
1Q
3,362
-9.7
42.5%
296
8.8
133
4
64
222
57
25.4
166
166
-39.1
4.9
FY26
2QE
3,448
-4.9
41.7%
310
9.0
135
5
91
261
66
25.2
195
195
-52.9
5.7
3QE
3,567
12.1
42.4%
363
10.2
140
6
111
328
82
25.2
245
245
32.5
6.9
4QE
3,771
11.0
42.6%
403
10.7
169
10
116
341
85
25.1
255
255
25.3
6.8
FY25
Neutral
EPS CHANGE (%): FY25|26: -8|-15
EBITDAM to contract 120bp YoY to 9%; absolute EBITDA/kg
to decline YoY.
Key risk: Higher dumping from China as US tariffs come into
play.
(INR m)
FY26E
14,147
1.6
42.3%
1,372
9.7
577
24
381
1,152
290
25.2
862
862
-19.9
6.1
13,927
-3.6
42.7%
1,342
9.6
523
18
389
1,191
115
9.7
1,076
1,076
-18.1
7.7
PI Industries
Buy
CMP INR3,584| TP: INR4,310 (+20%)
EPS CHANGE (%): FY26|27: -7|-7
We expect total revenue to decline 20% YoY to INR17.6b.
EBITDA margin is likely to contract by ~380bp YoY.
Demand scenario and product launches in the domestic and
CSM segments will be a key focus area.
Quarterly Earning Model
Y/E March
Net Sales
YoY Change (%)
Total Expenditure
EBITDA
Margins (%)
Depreciation
Interest
Other Income
PBT before EO expense
Extra-Ord expense
PBT
Tax
Rate (%)
Minority Interest & Profit/Loss of
Asso. Cos.
Reported PAT
Adj PAT
YoY Change (%)
Margins (%)
1Q
20,689
8.3
14,857
5,832
28.2
834
83
727
5,642
0
5,642
1,175
20.8
-21
4,488
4,488
17.2
21.7
FY25
2Q
3Q
22,210 19,008
4.9
0.2
15,928 13,888
6,282
5,120
28.3
26.9
798
991
85
83
1,222
759
6,621
4,805
0
0
6,621
4,805
1,546
1,080
23.3
22.5
-7
5,082
5,082
5.8
22.9
-2
3,727
3,727
-16.9
19.6
4Q
17,871
2.6
13,315
4,556
25.5
902
79
734
4,309
0
4,309
1,017
23.6
-13
3,305
3,305
-10.6
18.5
1Q
19,005
-8.1
13,814
5,191
27.3
965
39
859
5,046
0
5,046
1,074
21.3
-28
4,000
4,000
-10.9
21.0
FY26E
2QE
3QE
17,769 21,309
-20.0
12.1
13,420 15,944
4,349
5,365
24.5
25.2
975
1,000
38
35
890
940
4,226
5,270
0
0
4,226
5,270
972
1,212
23.0
23.0
-10
3,264
3,264
-35.8
18.4
-10
4,068
4,068
9.2
19.1
FY25
4QE
19,947
11.6
15,112
4,835
24.2
1,077
32
1,027
4,754
0
4,754
1,093
23.0
-20
3,680
3,680
11.4
18.5
79,778
4.1
57,988
21,790
27.3
3,525
330
3,442
21,377
0
21,377
4,818
22.5
-43
16,602
16,602
-1.3
20.8
(INRm)
FY26E
78,030
-2.2
58,290
19,740
25.3
4,017
144
3,716
19,296
0
19,296
4,351
22.6
-68
15,012
15,012
-9.6
19.2
October 2025
98
 Motilal Oswal Financial Services
September 2025 Results Preview | Sector: Chemicals
SRF
CMP INR2,907 | TP: INR3,700 (+27%)
Expect margins to be better than 2QFY25.
Buy
EPS CHANGE (%): FY26|27: +1|+1
Chemical business is expected have better margins than
2QFY25.
Expects strong revenue growth in chemicals, led by better
pricing. Technical textile is expected to see a muted quarter.
(INR m)
FY26E
Consolidated - Quarterly Earning Model
Y/E March
Net Sales
YoY Change (%)
Total Expenditure
EBITDA
Margins (%)
Depreciation
Interest
Other Income
PBT before EO expense
Extra-Ord expense & DO
PBT
Tax
Rate (%)
Reported PAT
Adj PAT
YoY Change (%)
Margins (%)
1Q
34,641
3.8
28,435
6,207
17.9
1,882
965
253
3,612
172
3,440
918
25.4
2,522
2,695
-29.6
7.8
FY25
2Q
3Q
34,243
34,913
7.8
14.4
28,637
28,375
5,606
6,538
16.4
18.7
1,939
1,943
938
963
333
396
3,063
4,029
226
342
2,837
3,687
822
976
26.9
24.2
2,014
2,711
2,240
3,053
-30.0
12.4
6.5
8.7
4Q
43,133
20.8
33,108
10,025
23.2
1,952
894
345
7,525
451
7,074
1,813
24.1
5,261
5,712
30.4
13.2
1Q
38,186
10.2
29,975
8,212
21.5
2,032
799
291
5,671
-87
5,758
1,435
25.3
4,323
4,236
57.2
11.1
FY26
2QE
38,840
13.4
30,593
8,247
21.2
2,040
895
365
5,677
0
5,677
1,391
24.5
4,286
4,286
91.3
11.0
FY25
3QE
39,828
14.1
31,263
8,565
21.5
2,100
900
375
5,940
0
5,940
1,455
24.5
4,485
4,485
46.9
11.3
4QE
49,120 1,46,931 1,65,975
13.9
11.8
13.0
36,143 1,18,555 1,27,974
12,977 28,376 38,001
26.4
19.3
22.9
2,393
7,715
8,565
871
3,760
3,465
436
1,327
1,467
10,150 18,229 27,439
0
1,192
-87
10,150 17,037 27,525
2,487
4,529
6,769
24.5
24.8
24.7
7,662 12,508 20,757
7,662 13,700 20,670
34.1
-3.0
50.9
15.6
9.3
12.5